
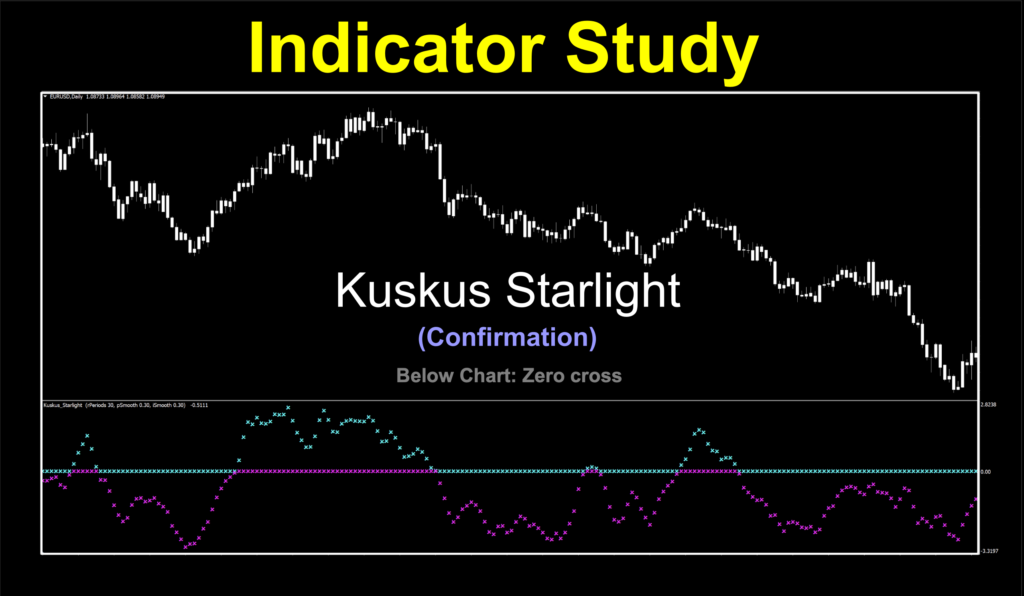
Kuskus Starlight
Starlight, Star Bright
Funny name. A couple of mental images came to mind. The first, a middle eastern food, but spelled differently. And the second one a child’s rhyme. Connecting the dots after saying the whole thing let to more dots;
*
*
Starlight, star bright, first star I see tonight, I wish I may, I wish I might, have this wish I wish tonight.

I’ll bet traders all over the world silently wish for something.
I Wish…
“Please, oh please, go up (or down). I’ll never overleverage/ignore risk, break my own rules, trade with money I shouldn’t/ listen to other people/ ignore my algorithm/trade live too soon…if I can just get out of this trade without cratering my account into the ground.
Putting Your Humanity Aside
You’ve done it, we’ve done it, even professionals do it. It’s human nature. Getting control of that humanity within us is what separates you from someone who “dabbles” and doesn’t treat trading like a business. We’re not investing. We have no vested interests in anything really tangible. The market acts and we respond accordingly. We don’t dabble because this is a serious venture for those who want to become profitable traders and will put in the effort to get from “here” to “there”.
Psych 101
Pardon our foray into a short trading psychology moment, brought to you by anxiety, greed, fear and a host of other nasties. Speaking of which, if you haven’t downloaded VP’s book on Trading Psychology, you’re really getting your feet kicked out from under you.

Written for anybody (everybody) to understand, it’s on our must-read book list, and it should definitely be on yours. Take it from us, many other trading psychology books are really only good for holding windows up, propping doors open, or smashing flies.
We Hear You
We’ve received a few questions about it, so we’ll make it easy for you. We have the link HERE, and we’ll be setting up a page on the Stonehill Forex site with some background information for those who would like to know more. It’s a good read. You’ll even laugh, or at least chuckle a few times.
Let It Shine
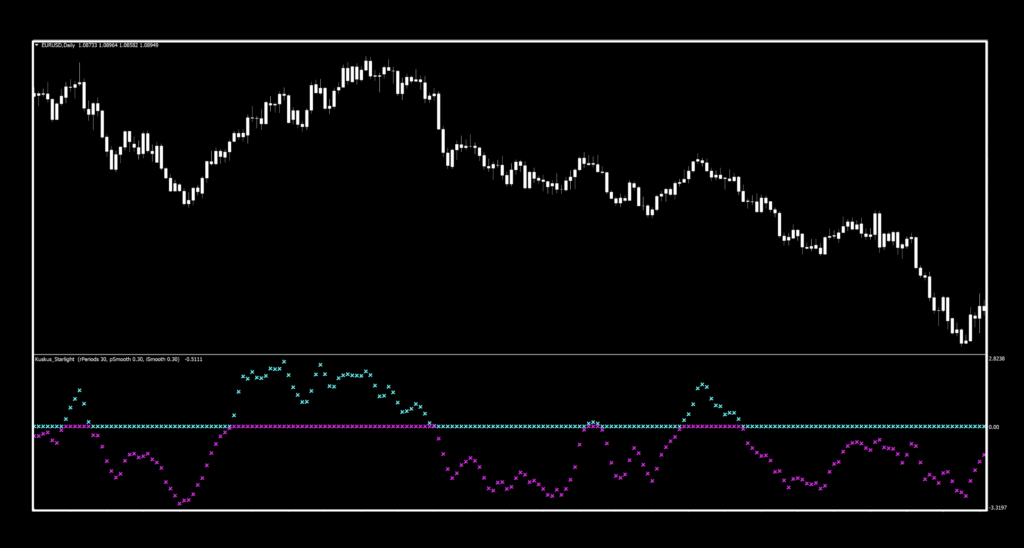
Let’s all settle back and watch the video and see how much of a star this indicator really is. We’ve made some minor changes to its appearances just for easier viewing, but left the default values.
On To Business
Where were we? Ah, yes…this week we’ve got an interesting little gem called Kuskus Starlight. This one has been around a little longer, since 2007, and it’s got a few pretty cool things going on to generate our digital dots. It’s also a user submitted indicator from our email archives. We’d like to throw out some recognition and appreciation to Anna P. from Norway, who suggested this. Maybe it was those northern latitudes and cold winter starry nights which inspired her.
Pray Tell
Glad you asked. We’ll break it down into steps to keep the logic in order.
1. Lean out your windowsill and stare into the sky. Just kidding. The first step compares the first (high-low) prices with the ((highest high) — (lowest low)) prices over the specified number of periods.
2. The value from the first step is then averaged with an RMA (Modified Moving Average also known as a Running Moving Average).
3. This smoothed value is then converted with a logarithmic function.
4. Finally, this value is averaged again using RMA.
So Sparkly
As mentioned earlier, we’ve kept the default settings, but brightened things up from blue/red to aqua/magenta for this color change (or zero cross if you’re partial to that) confirmation indicator. We took our ghost candles from last week and returned their sheets, so we’re white on white to keep things spiffy.
Settings
There are five variables here, but we’re only concerned with three of them, which gives us a fair degree of control without getting too crazy. The other two allow you to change the visuals.
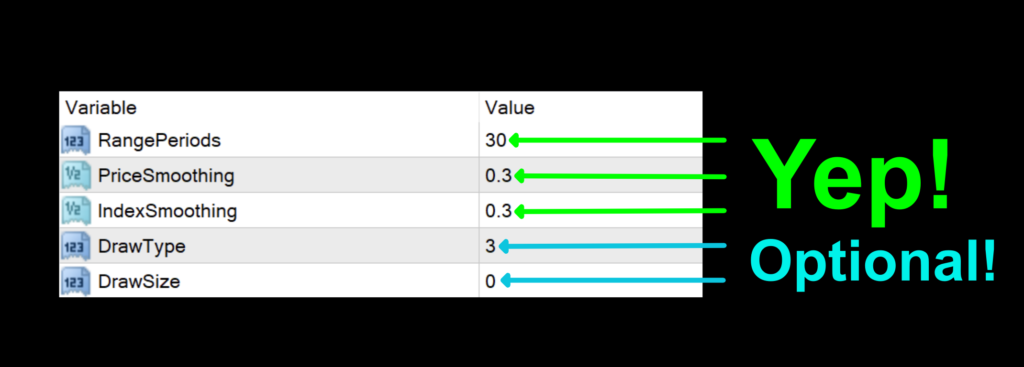
RangePeriods: The number of periods used for the overall calculation of the signal line. The default value is 30.
PriceSmoothing: First iteration of a smoothing function. The default value is 0.3.
IndexSmoothing: Second iteration of the smoothing function. The default value is 0.3.
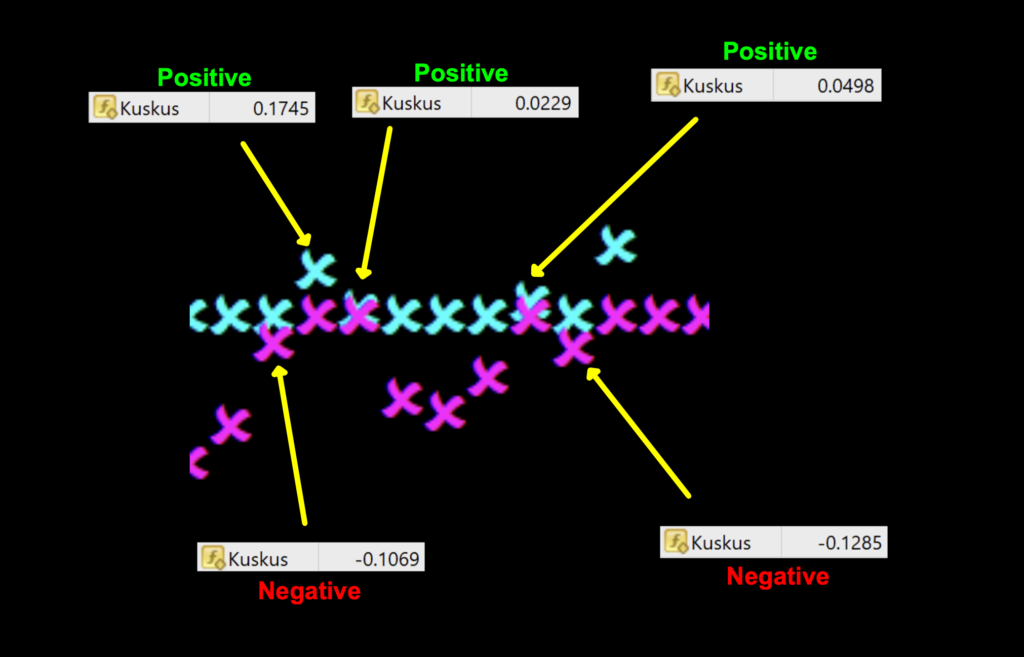
Zoom Zoom
We wanted to include a close up of the zero line, where attention to detail matters. Below, you can see that the symbols print above or below and if it’s too close to tell, use the data window to get conclusive evidence.
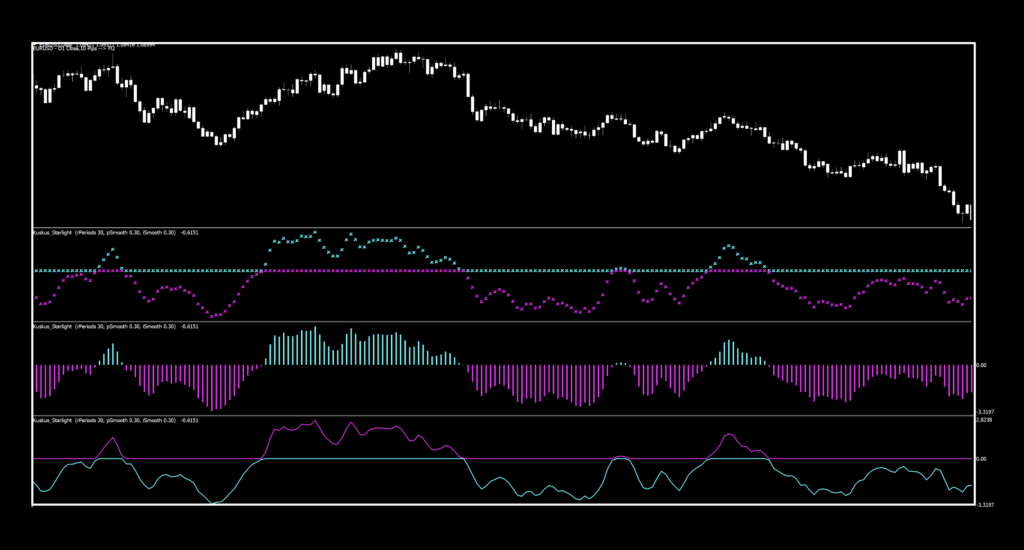
Other Visuals
As a bonus, the optional two settings control how the indicator looks. The default are the odd looking stars, but if you’re partial to histograms, or just signal lines, we’ve got you covered. Below is an image with all three, so you can pick your poison. The default value is 3; stars, and 2 is the histogram, leaving option 1 as red and blue signal lines. The size controls…well, the size! Now, go have some fun.
Setting Notes
To prevent a wild goose chase, pay attention to the second and third settings in the testing data. The first thing that you’ll notice is that the numerical value doesn’t really move too far from the original value. That means you won’t have to spend unnecessary time with numbers which aren’t helpful.
Advantages
* Colors make it easy to visually determine signals.
* Smooth signals for longer trend trades.
* Variables are easier to test due to narrow range.
How we use it.
One of three actions need to happen in the last 30 minutes prior to the close of the trading day. They are; opening, maintaining, or closing, a position. This is when you make your trading decisions, and not actually wait for the close at 1700 EST, because we trade on the daily time frame.
Long: Blue signal line rises above zero. Entry is in the last 30 min. of the trading day.
Short: Red signal line falls below zero. Entry is in the last 30 min. of the trading day.
Star Signals
On the mark-up below, we took advantage of the starry theme and identified signals with…well, stars!
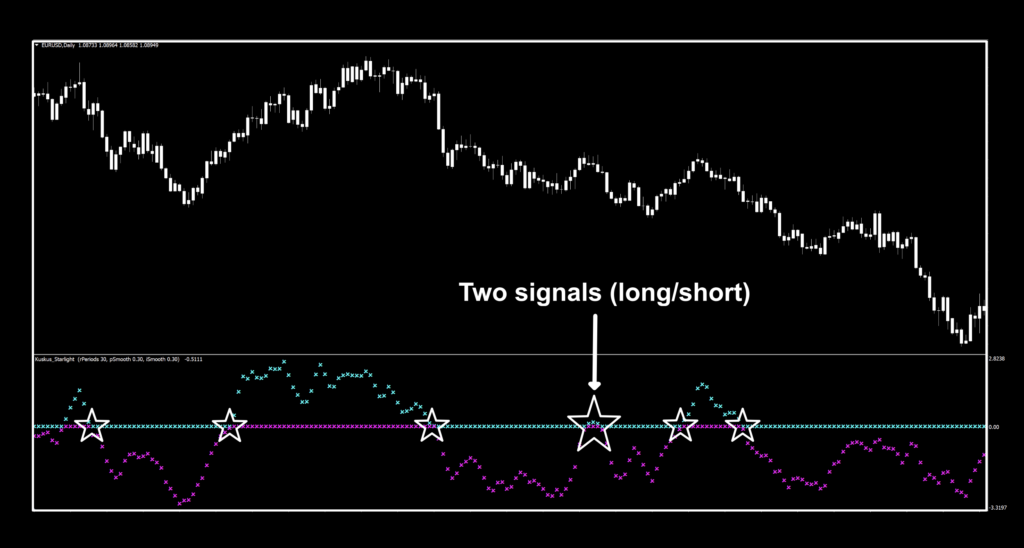
We really appreciated how this indicator kept us in trades when a faster confirmation would have returned multiple signals. A good C2, perhaps? There was really only one bad spot where the signal line popped up over the zero line, took a break and went back below. We liked this one, and wait until you see the testing results. Exciting stuff.
Star Signs
If you’re new to these studies, we recommend looking at some older blogs to understand how we conduct our testing. We’re going to be using our alternative numbers.
No Wishing Required
Below is the data from our testing.
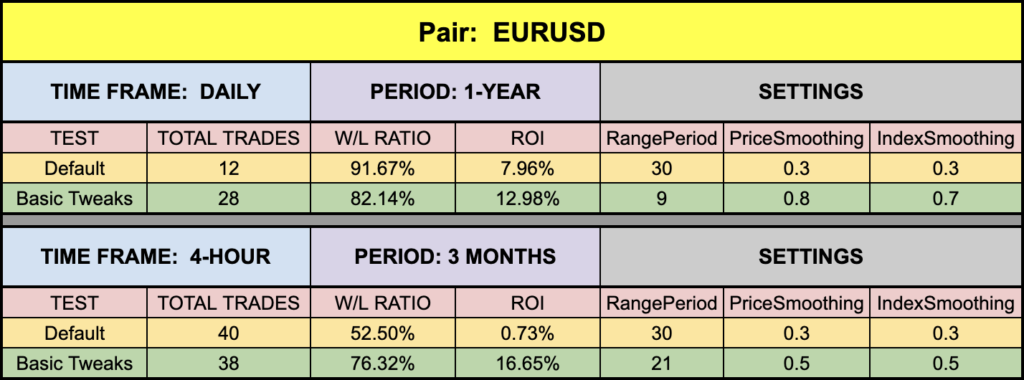

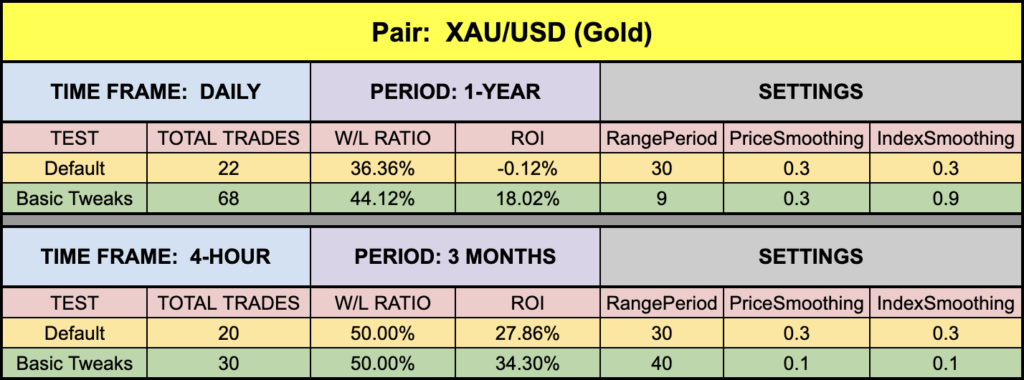
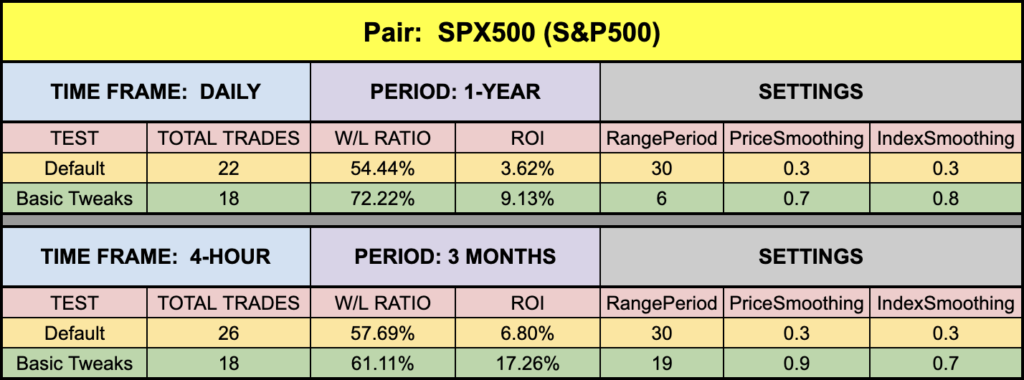
Well now, pretty darn good all the way around. In fact, you’ll notice that the default values on most of the results are positive. That’s a great way to start. We got some good numbers on the EUR and of course XAU was the darling, posting excellent default and tweaked settings. Go try this one out. We’re glad we found it and happy to share it.
Resources
You can find this superstar indicators in the library for free. When you’re ready to get them, click HERE. Be sure to subscribe to the Stonehill Forex YouTube channel for the technical analysis videos. For the advanced course, click HERE.
Our only goal is to make you a better trader.
BTW — Any information communicated by Stonehill Forex Limited is solely for educational purposes. The information contained within the courses and on the website neither constitutes investment advice nor a general recommendation on investments. It is not intended to be and should not be interpreted as investment advice or a general recommendation on investment. Any person who places trades, orders or makes other types of trades and investments etc. is responsible for their own investment decisions and does so at their own risk. It is recommended that any person taking investment decisions consults with an independent financial advisor. Stonehill Forex Limited training courses and blogs are for educational purposes only, not a financial advisory service, and does not give financial advice or make general recommendations on investment.