A Trend-Following Sidekick
If technical indicators were characters in a movie, the Rahul Mohindar Oscillator (RMO) would be the calm, thoughtful detective—not the overexcited rookie chasing every clue. Designed by Rahul Mohindar, a prominent Indian trader, technical analyst, and director of Viratech Software, the RMO helps traders identify the dominant market trend, measure momentum, and filter out much of the day-to-day noise that can make markets feel like a roller coaster.
We’re Grabbing This
The RMO was developed in the early 2000s and became widely known when it was included in MetaStock 10, which was released in 2006. Not to be confused with MT4, MetaStock 10 was primarily used by stock and futures traders. It wasn’t until 2008 that MT4 users started asking about it, and it eventually became available for the platform sometime between 2009 and 2011.
Keep Your Eye on the Prize
The goal of any good indicator is to help traders focus on the bigger picture instead of getting distracted by every wiggle and wobble in price. Even though we trade on the daily time frame as swing traders (or the 4-hour chart if you’re so inclined), it pays to let an indicator filter out short-term market noise and help you stay on track.
Parts of a Whole
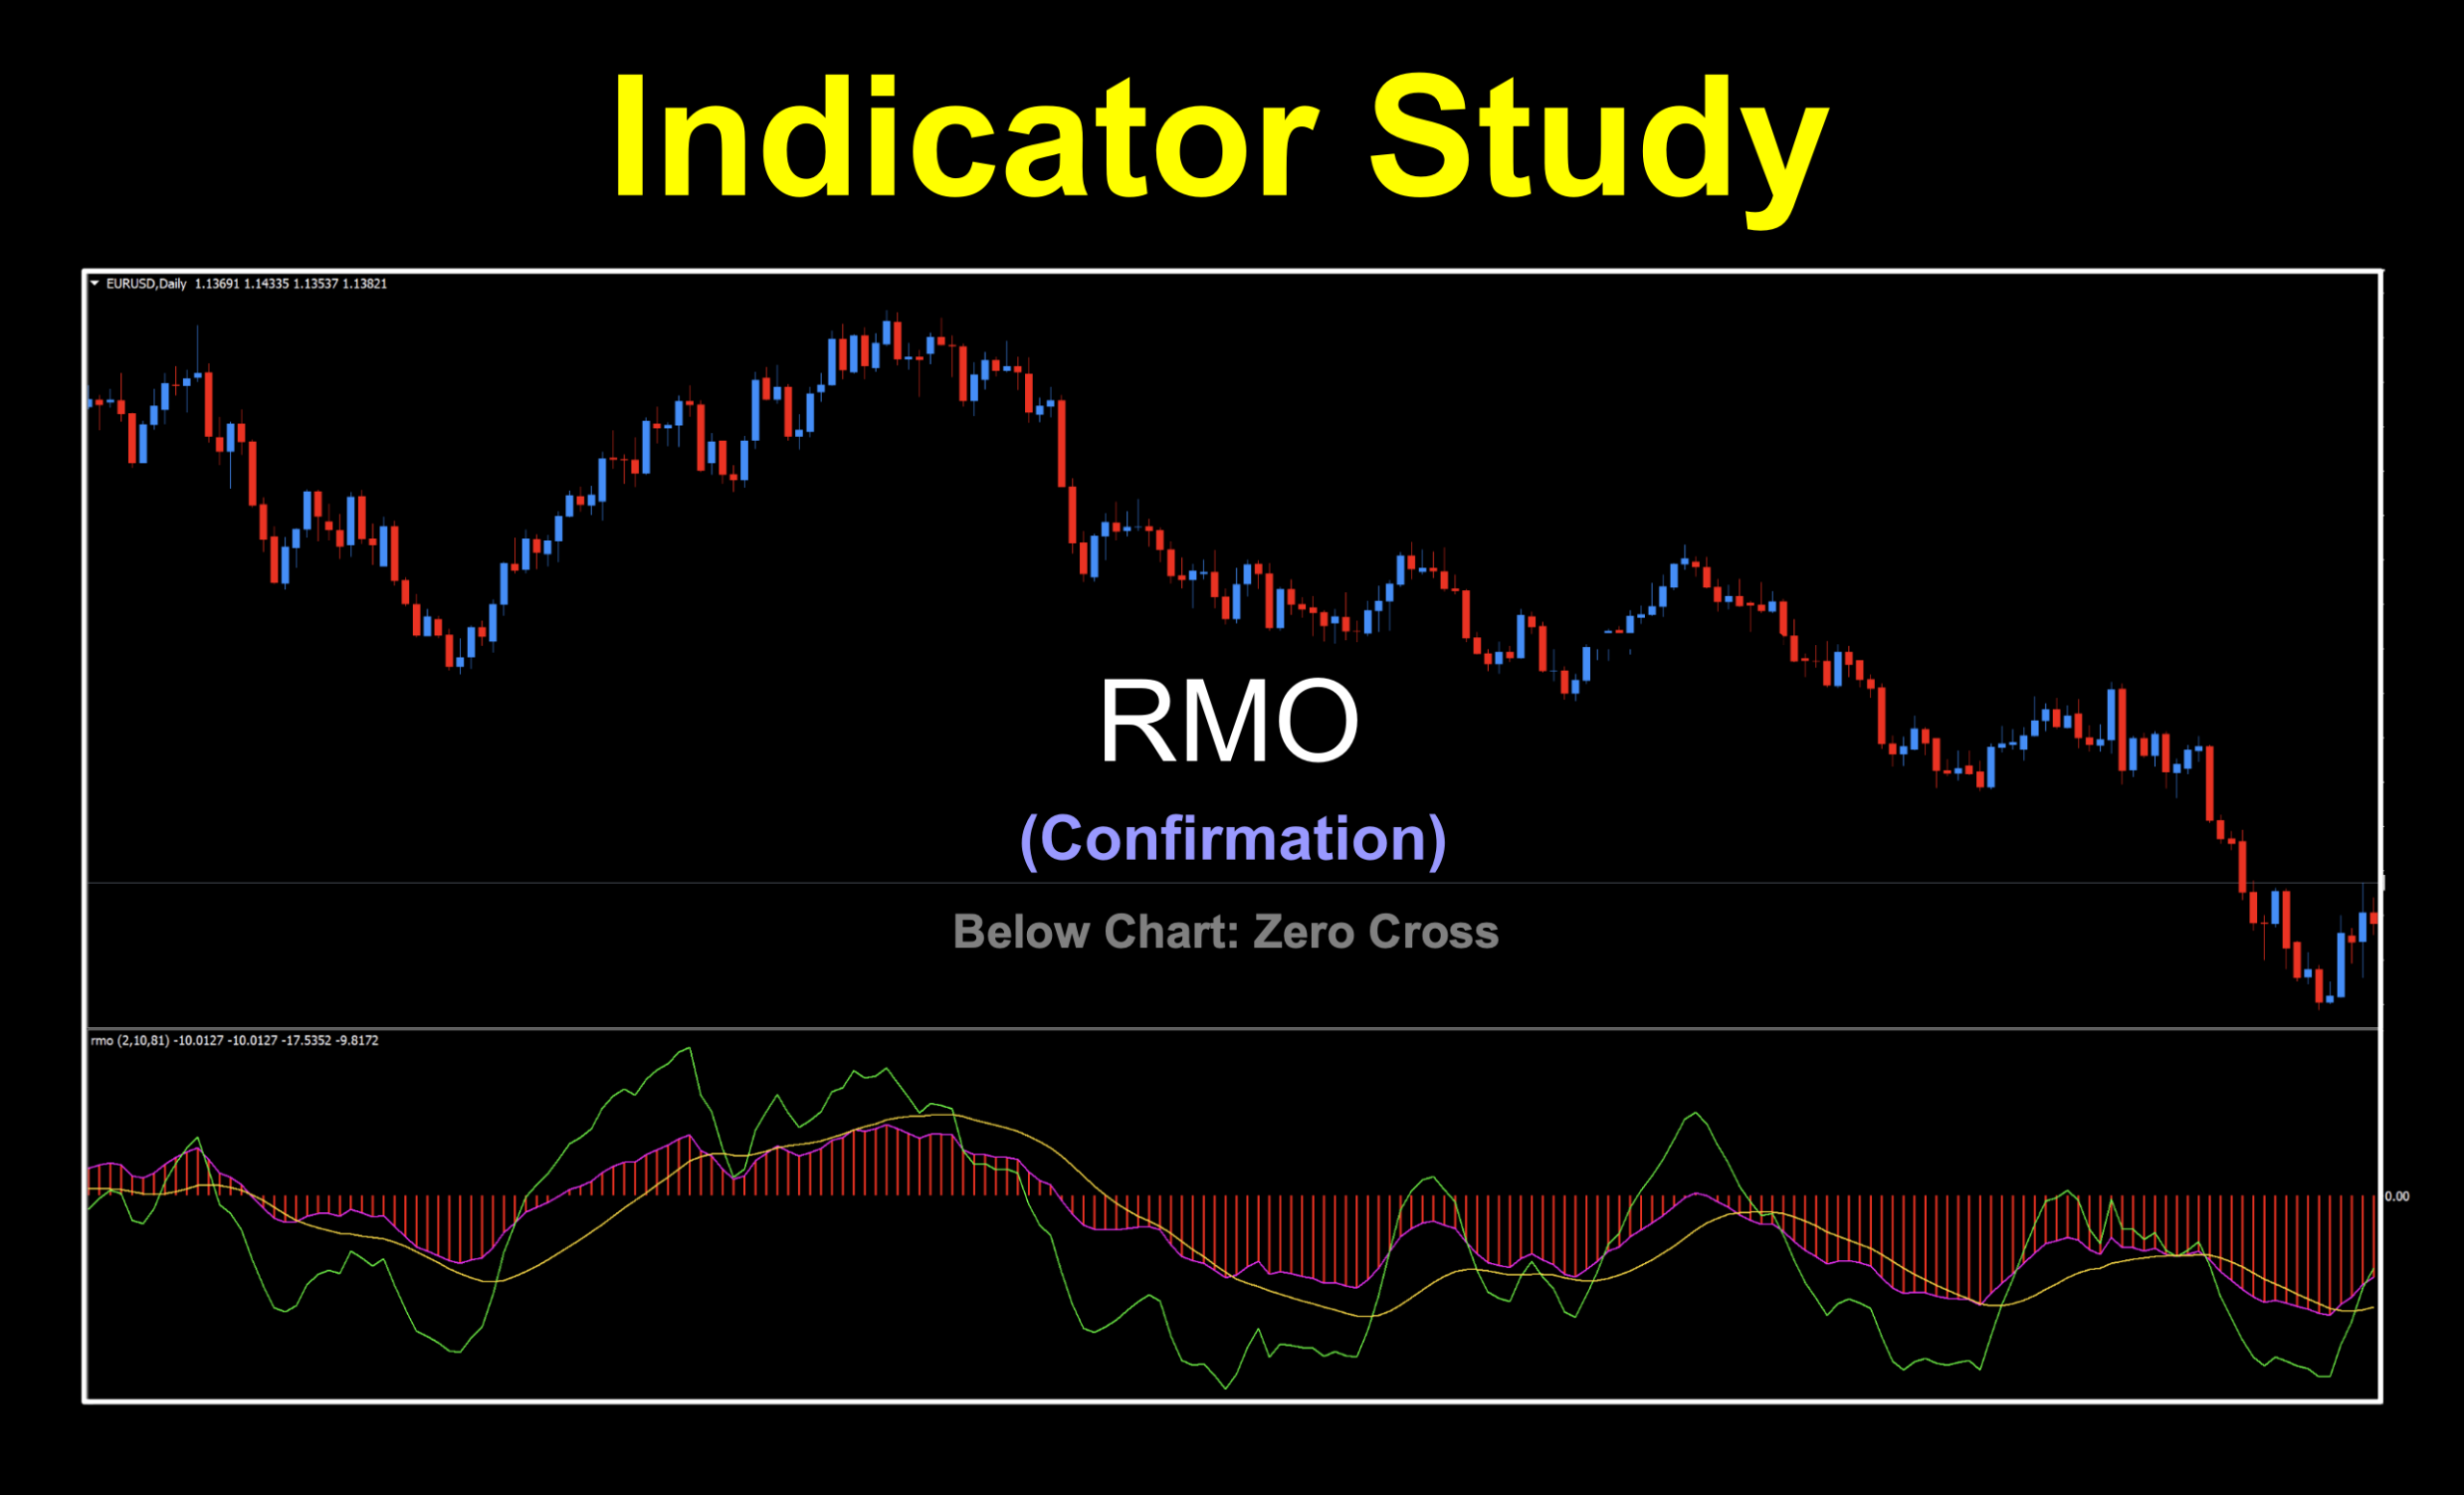
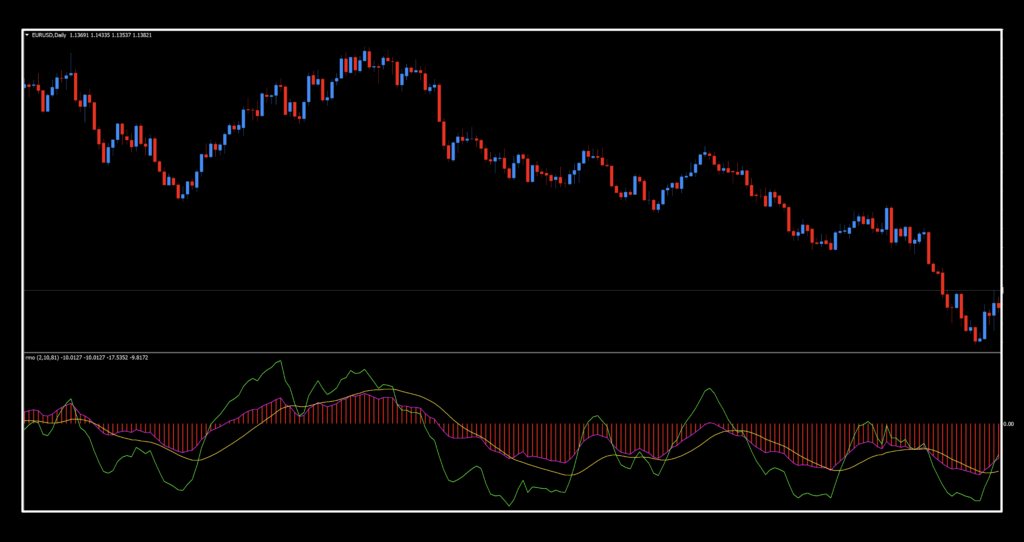
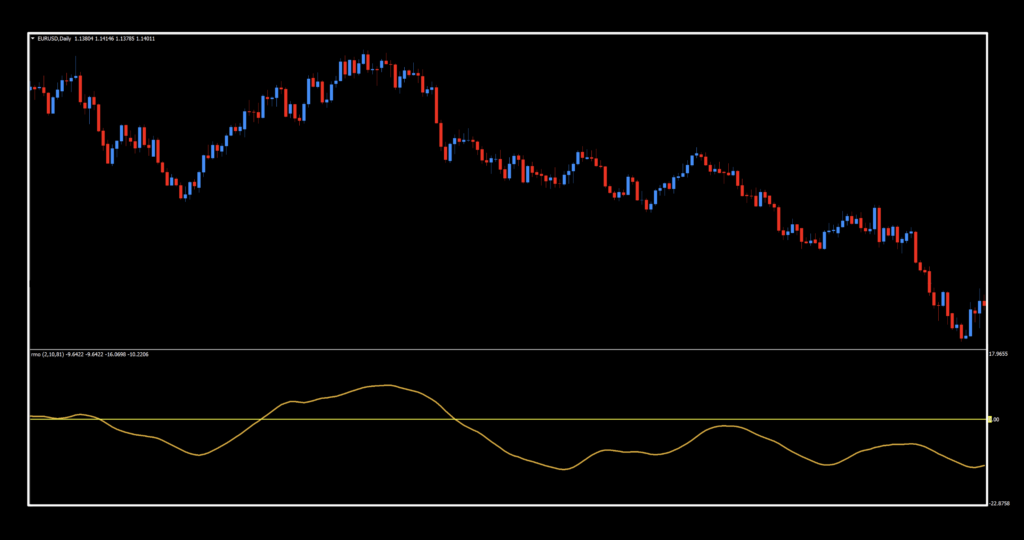
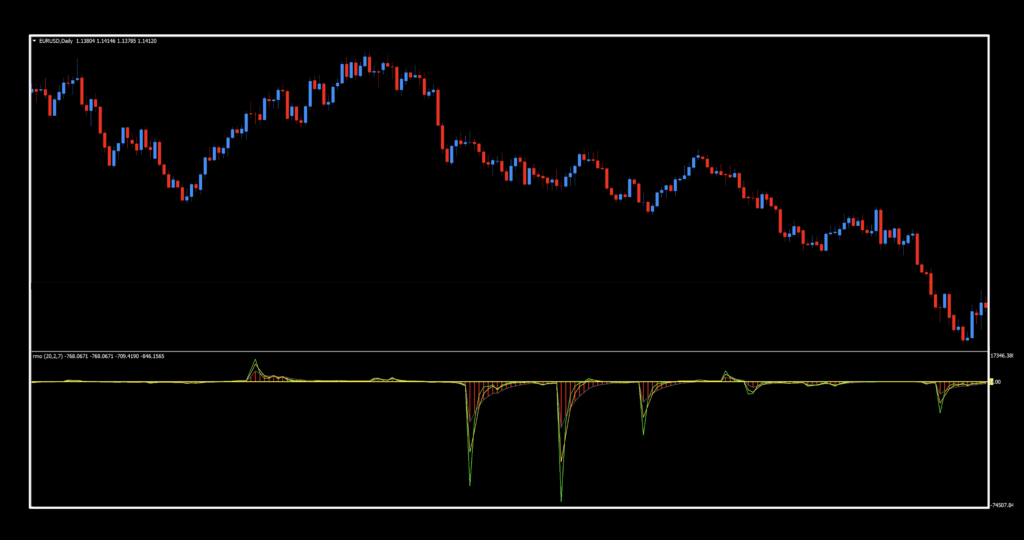
There are three components to the indicator shown in the chart below. We’ll take a brief look at each one and explain how we’ve chosen to use it, since not every feature aligns with NNFX methodology and philosophy.
They are:
- The histogram (displayed with a magenta outline instead of the default dark gray)
- The gold signal line
- The green filter line
Histogram First
The histogram represents the market’s primary trend and is the most important part of the RMO. Think of it as showing what the market is really doing. When the histogram is above the zero line, we look for long (buy) trades. When it’s below the zero line, we look for short (sell) trades. The histogram also rises and falls, providing clues about momentum. For now, though, simply focus on whether it’s above or below the zero line. Technically, this isn’t a true histogram. However, because it’s made up of bars that create the curve, we’ll continue referring to it as one.
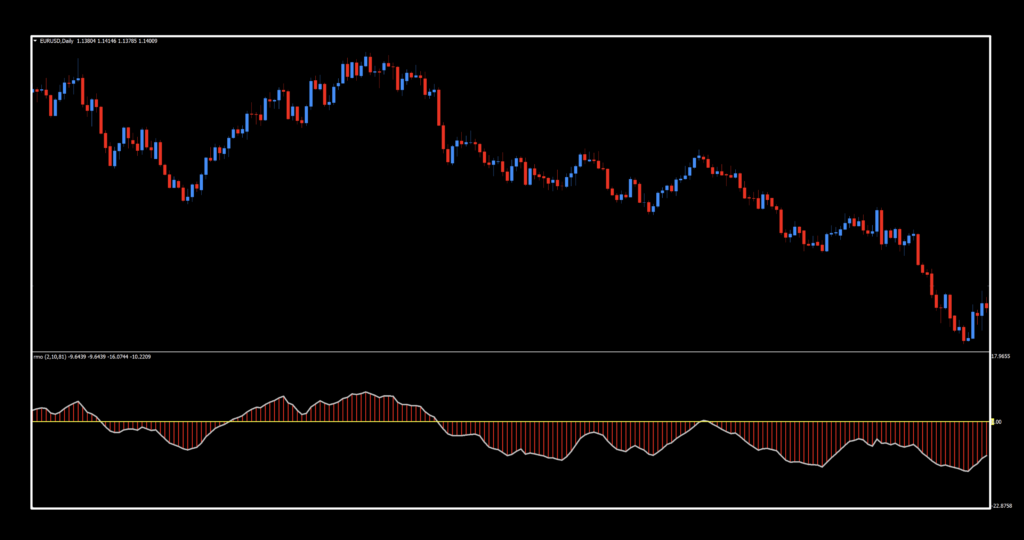
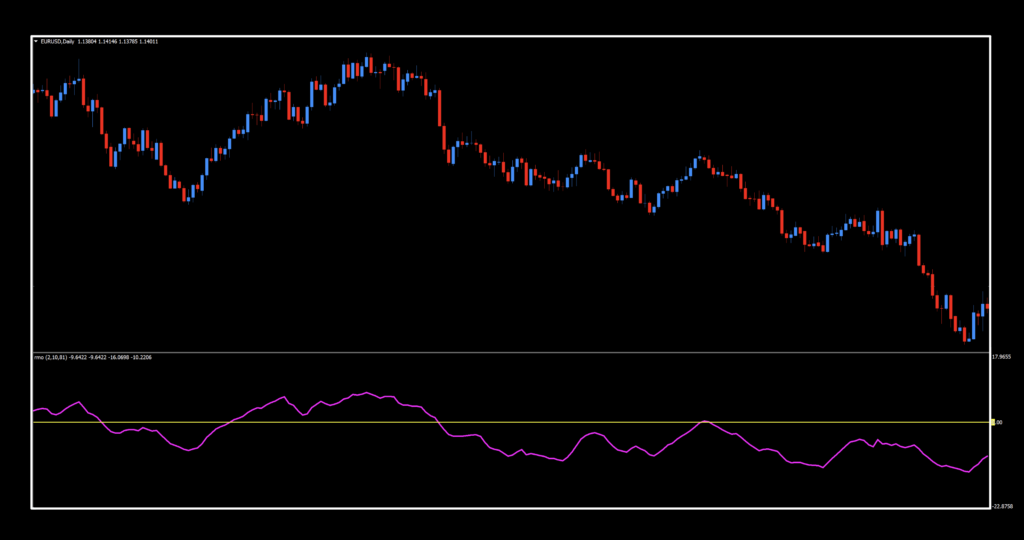
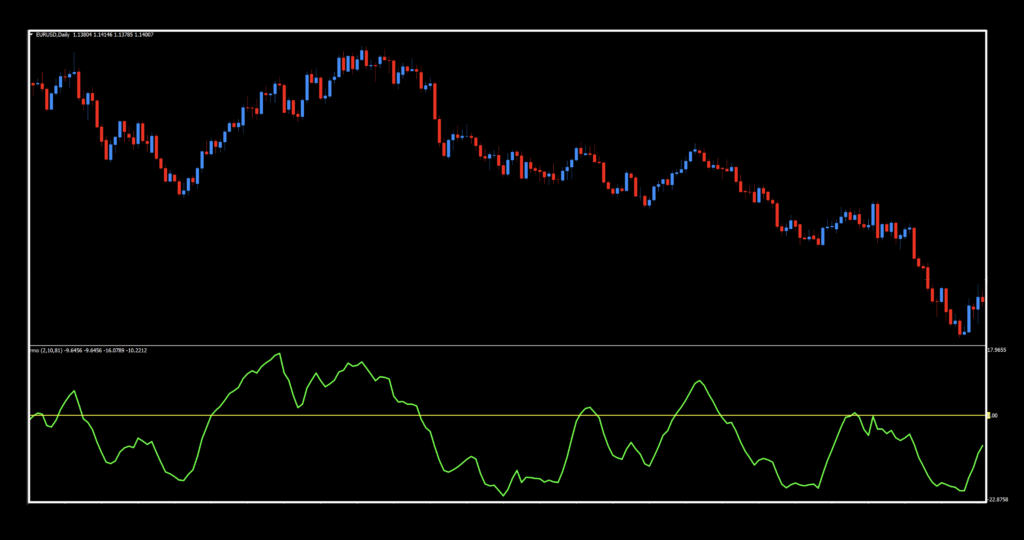
Since it’s really not a pure histogram, we can remove the bars and we have just the curve…like this.
Golden Thread
The gold signal line is a slower, smoother line that helps traders determine whether a price move is genuine or simply random market noise. Think of it as a checkpoint that the faster components of the indicator—such as the green filter line or the histogram—must cross or align with before a signal is considered reliable.
It is created by applying an additional layer of smoothing—typically an exponential moving average—to the already smoothed RMO values. As a result, it reacts more slowly than the other components but provides more reliable confirmation of trend changes.
Spotting Green Momentum
The green filter line is the faster component of the RMO and highlights short-term changes in momentum. Because it responds more quickly than the histogram or the gold signal line, it can provide early hints that the market may be preparing to change direction.
It is created by smoothing the RMO values once with an exponential moving average, allowing it to closely follow recent price action. Traders often watch for crossovers between the green filter line and the slower gold signal line as an early indication that buying or selling pressure is strengthening or weakening.
Rabbit Hole
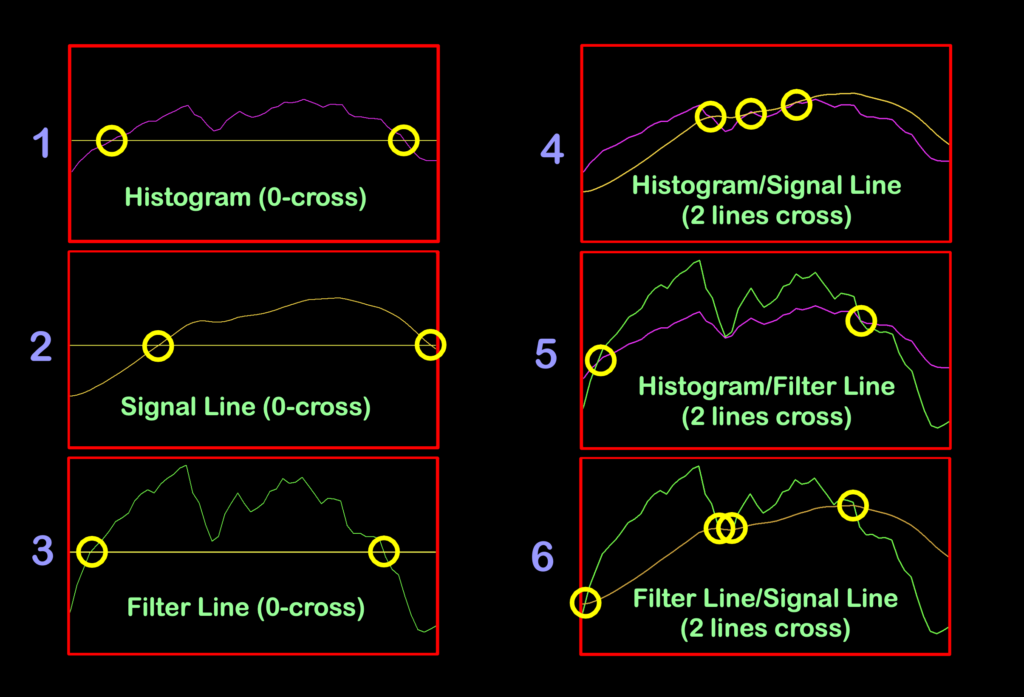
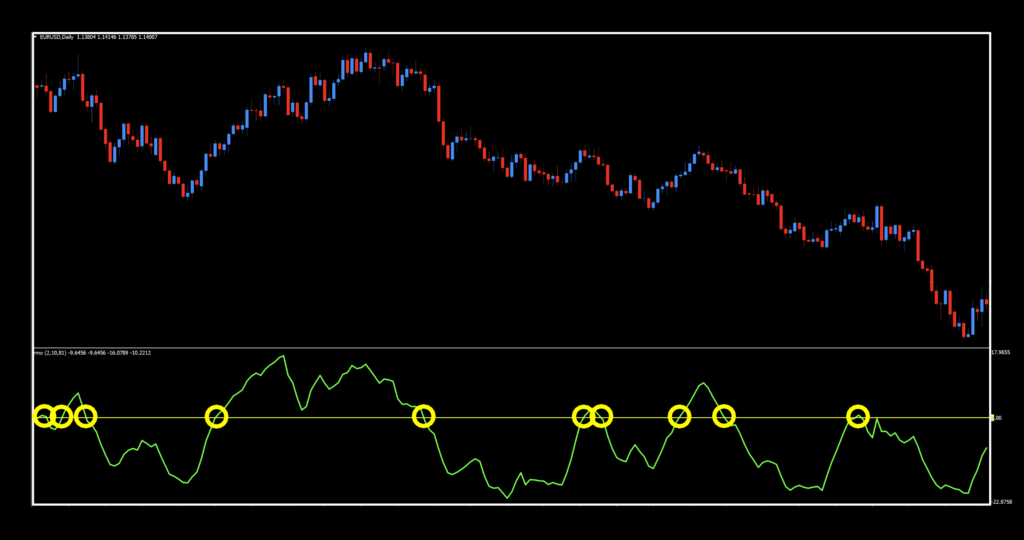
There are several different ways to interpret signals within the RMO, as shown in the list and image below:
- Histogram alone (zero-line crossover)
- Gold signal line alone (zero-line crossover)
- Green filter line alone (zero-line crossover). Remember, this line represents the relationship between the other two.
- Histogram and gold signal line (two-line crossover)
- Histogram and green filter line (two-line crossover)
- Gold signal line and green filter line (two-line crossover)
We ended up spending a ridiculous amount of time testing each variation to determine which produced the best overall results. As you already know, our philosophy isn’t about how everyone else uses an indicator; it’s about discovering what works best for us.
Settings
You’ll notice a bit of a laundry list of settings. Some are required, while others simply control the visual appearance of the indicator and don’t affect its functionality.
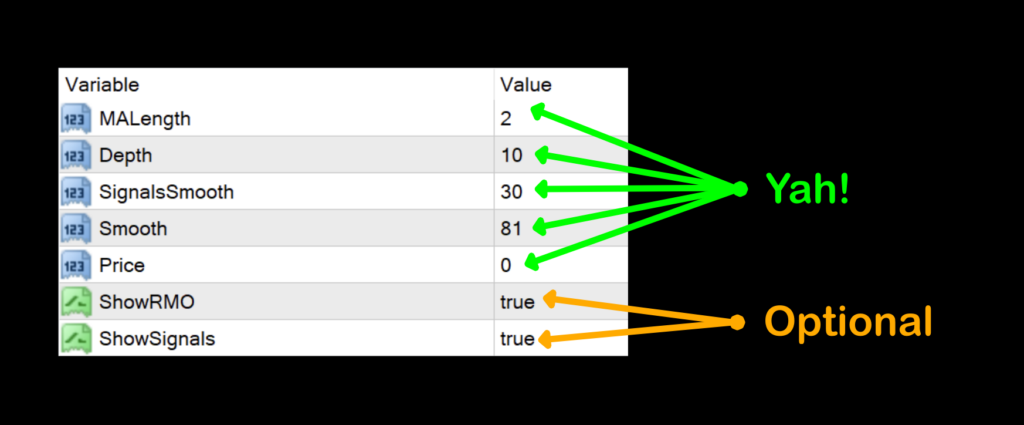
MALength: Controls the period of the moving average used in the RMO calculation.
- Higher values = smoother but slower signals.
- Lower values = faster signals with more noise.
Default value: 2
Depth: Depth is not part of the original RMO formula. It appears in some MT4 versions and modified RMO indicators, where it controls the lookback period used to calculate the trend component.
Default value: 10
In practical terms:
- Lower Depth values (3–5) make the RMO react more quickly to price changes, producing earlier—but often less reliable—signals.
- Higher Depth values (10–20) smooth the oscillator, helping it focus on larger trends while delaying signals.
- Increasing Depth generally reduces noise and whipsaws, while decreasing it increases sensitivity.
SignalsSmooth: Smooths the signal lines. Increasing this value reduces whipsaws but delays crossovers.
Default value: 30
Smooth: Applies additional smoothing to the oscillator itself. Larger values create a smoother histogram but respond more slowly to changes in trend.
Default value: 81
Price: Selects which price is used in the calculations.
0 = Close
1 = Open
2 = High
3 = Low
4 = Median
5 = Typical
6 = Weighted
Default value: Close (0)
ShowRMO: Turns the main histogram on or off.
Generally speaking:
- Above zero = bullish momentum
- Below zero = bearish momentum
ShowSignals: Shows or hides the signal moving-average lines that generate crossover signals.
Daily Maintenance
Remember, once you’re ready to perform daily maintenance on your trades during the last 20–30 minutes of the trading day (1700 New York time), you’ll be presented with one of four options.
- Opening a trade.
- Closing a trade
- Maintaining a trade; i.e.
- Moving a stop loss level.
- Exiting a trade.
- Taking a pass (nothing to do).
Long:
- When (as a zero cross) the line crosses and closes over the zero line.
- Histogram (magenta)/Signal line (gold) is a two lines cross with the magenta line crossing over the gold line.
- Histogram (magenta)/Filter line (green) is a two lines cross with the magenta line crossing over the green line.
- Filter line (green)/Signal line (gold) is a two lines cross with the green line crossing over the gold line.
Short:
- When (as a zero cross) the line crosses and closes below the zero line.
- Histogram (magenta)/Signal line (gold) is a two lines cross with the gold line crossing over the magenta line.
- Histogram (magenta)/Filter line (green) is a two lines cross with the magenta line crossing over the green line.
- Filter line (green)/Signal line (gold) is a two lines cross with the gold line crossing over the green line.
Multi Panel
Instead of showing a bunch of separate screenshots, we’ll group them together so you can get a better idea of where the various signals occur, depending on how you prefer to visualize your charts. Kind of like sitting in a sports bar with half a dozen games playing at once—you can quickly compare what’s happening without constantly changing channels. By the way – each “clip” is of the same market time span so you can see how each version interprets the market.
Preferred Choice
Although all of the signal combinations performed reasonably well, we still had to decide which one best fit our overall trading philosophy.
At the end of the day, we decided that using just the green filter line as a zero cross (smoothing the RMO values once with an exponential moving average, allowing it to closely follow recent price action) was the best fit for our needs. That doesn’t mean it’s the only valid way to use the RMO—far from it. After all, we’re not the indicator police. We’re simply the guides showing you the different paths you can take and sharing the one that produced the most consistent results during our testing.
The Winner Is
Below are the final numbers from our testing sessions. Take a close look, and we’ll meet you below to discuss the results.
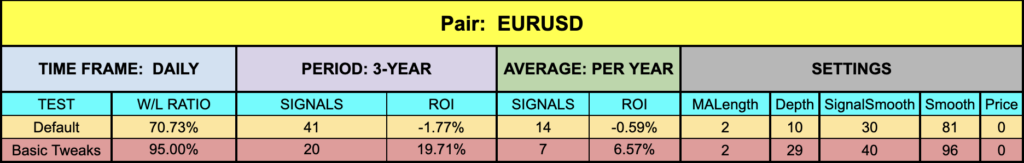
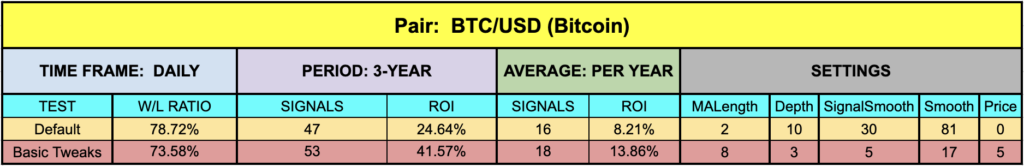
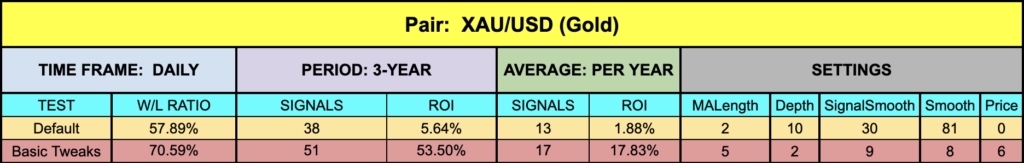
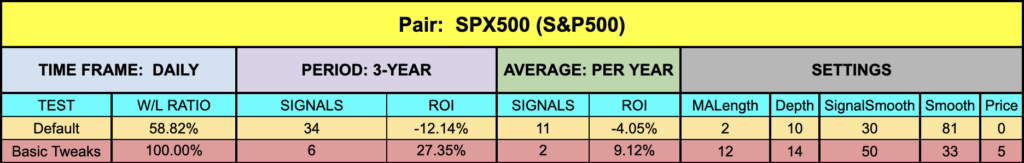
There Can Be Only One
Looking through all the results, we felt that while it was fairly average on the EURO, pretty good on BTC, well appointed on XAU, and very good on SPX500, this indicator encompassed a nice balance between all the metrics – and that’s what we like to see.
Curve Fitting Mention
There’s one important point worth mentioning before you head off to do your own testing.
Every now and then, we stumble across an indicator and parameter combination that produces absolutely stellar backtesting results. The equity curve looks amazing on a graph, the ROI is through the roof, and you start wondering whether you’ve just found the Holy Grail.
Then you put it on a chart.
Reality has a funny way of showing up.
Below is an example of a setup that generated well over a 50% ROI during testing. On paper, it looks incredible. In practice, it’s simply not a strategy we’d ever want to trade.
Take Away
The takeaway is simple: don’t judge an indicator solely by its statistics. Whenever you perform your own backtesting, spend a few minutes looking at how the indicator behaves on the chart. A strategy should not only produce good numbers—it should also make practical trading sense.
Resources
You’ll find this multifaceted indicator in the indicator library for free, and it’ll be marked with “NEW” in red to help you locate it quickly. Be sure you’re subscribed to the Stonehill Forex YouTube channel, where we’ll show this Swiss Army knife of an indicator in action and explain how we use it within our NNFX workflow.
If you’re ready to take things a step further, the Advanced NNFX Course is here to help fast-track your trading education so you can shorten your learning curve to a fraction of what most traders experience.
Our only goal is to make you a better trader.
*Our published testing results are based on the money management strategies employed by the NNFX system and depend on a variety of external factors that may differ between individuals and their specific broker conditions. No guarantees, trading recommendations, or other market suggestions are implied. Your results and subsequent trading activities remain solely your own responsibility.
BTW — Any information communicated by Stonehill Forex Limited is provided solely for educational purposes. The information contained in our courses, blogs, and on our website does not constitute investment advice or a general recommendation to invest. It is not intended to be, and should not be interpreted as, investment advice or a recommendation regarding any investment or trading activity. Any person who places trades, enters orders, or engages in any other form of trading or investment is solely responsible for their own investment decisions and does so at their own risk. Individuals should consult an independent financial adviser before making any investment decisions. Stonehill Forex Limited’s training courses, blogs, and other educational materials are provided for educational purposes only. Stonehill Forex Limited is not a financial advisory service and does not provide financial advice or make general investment recommendations.