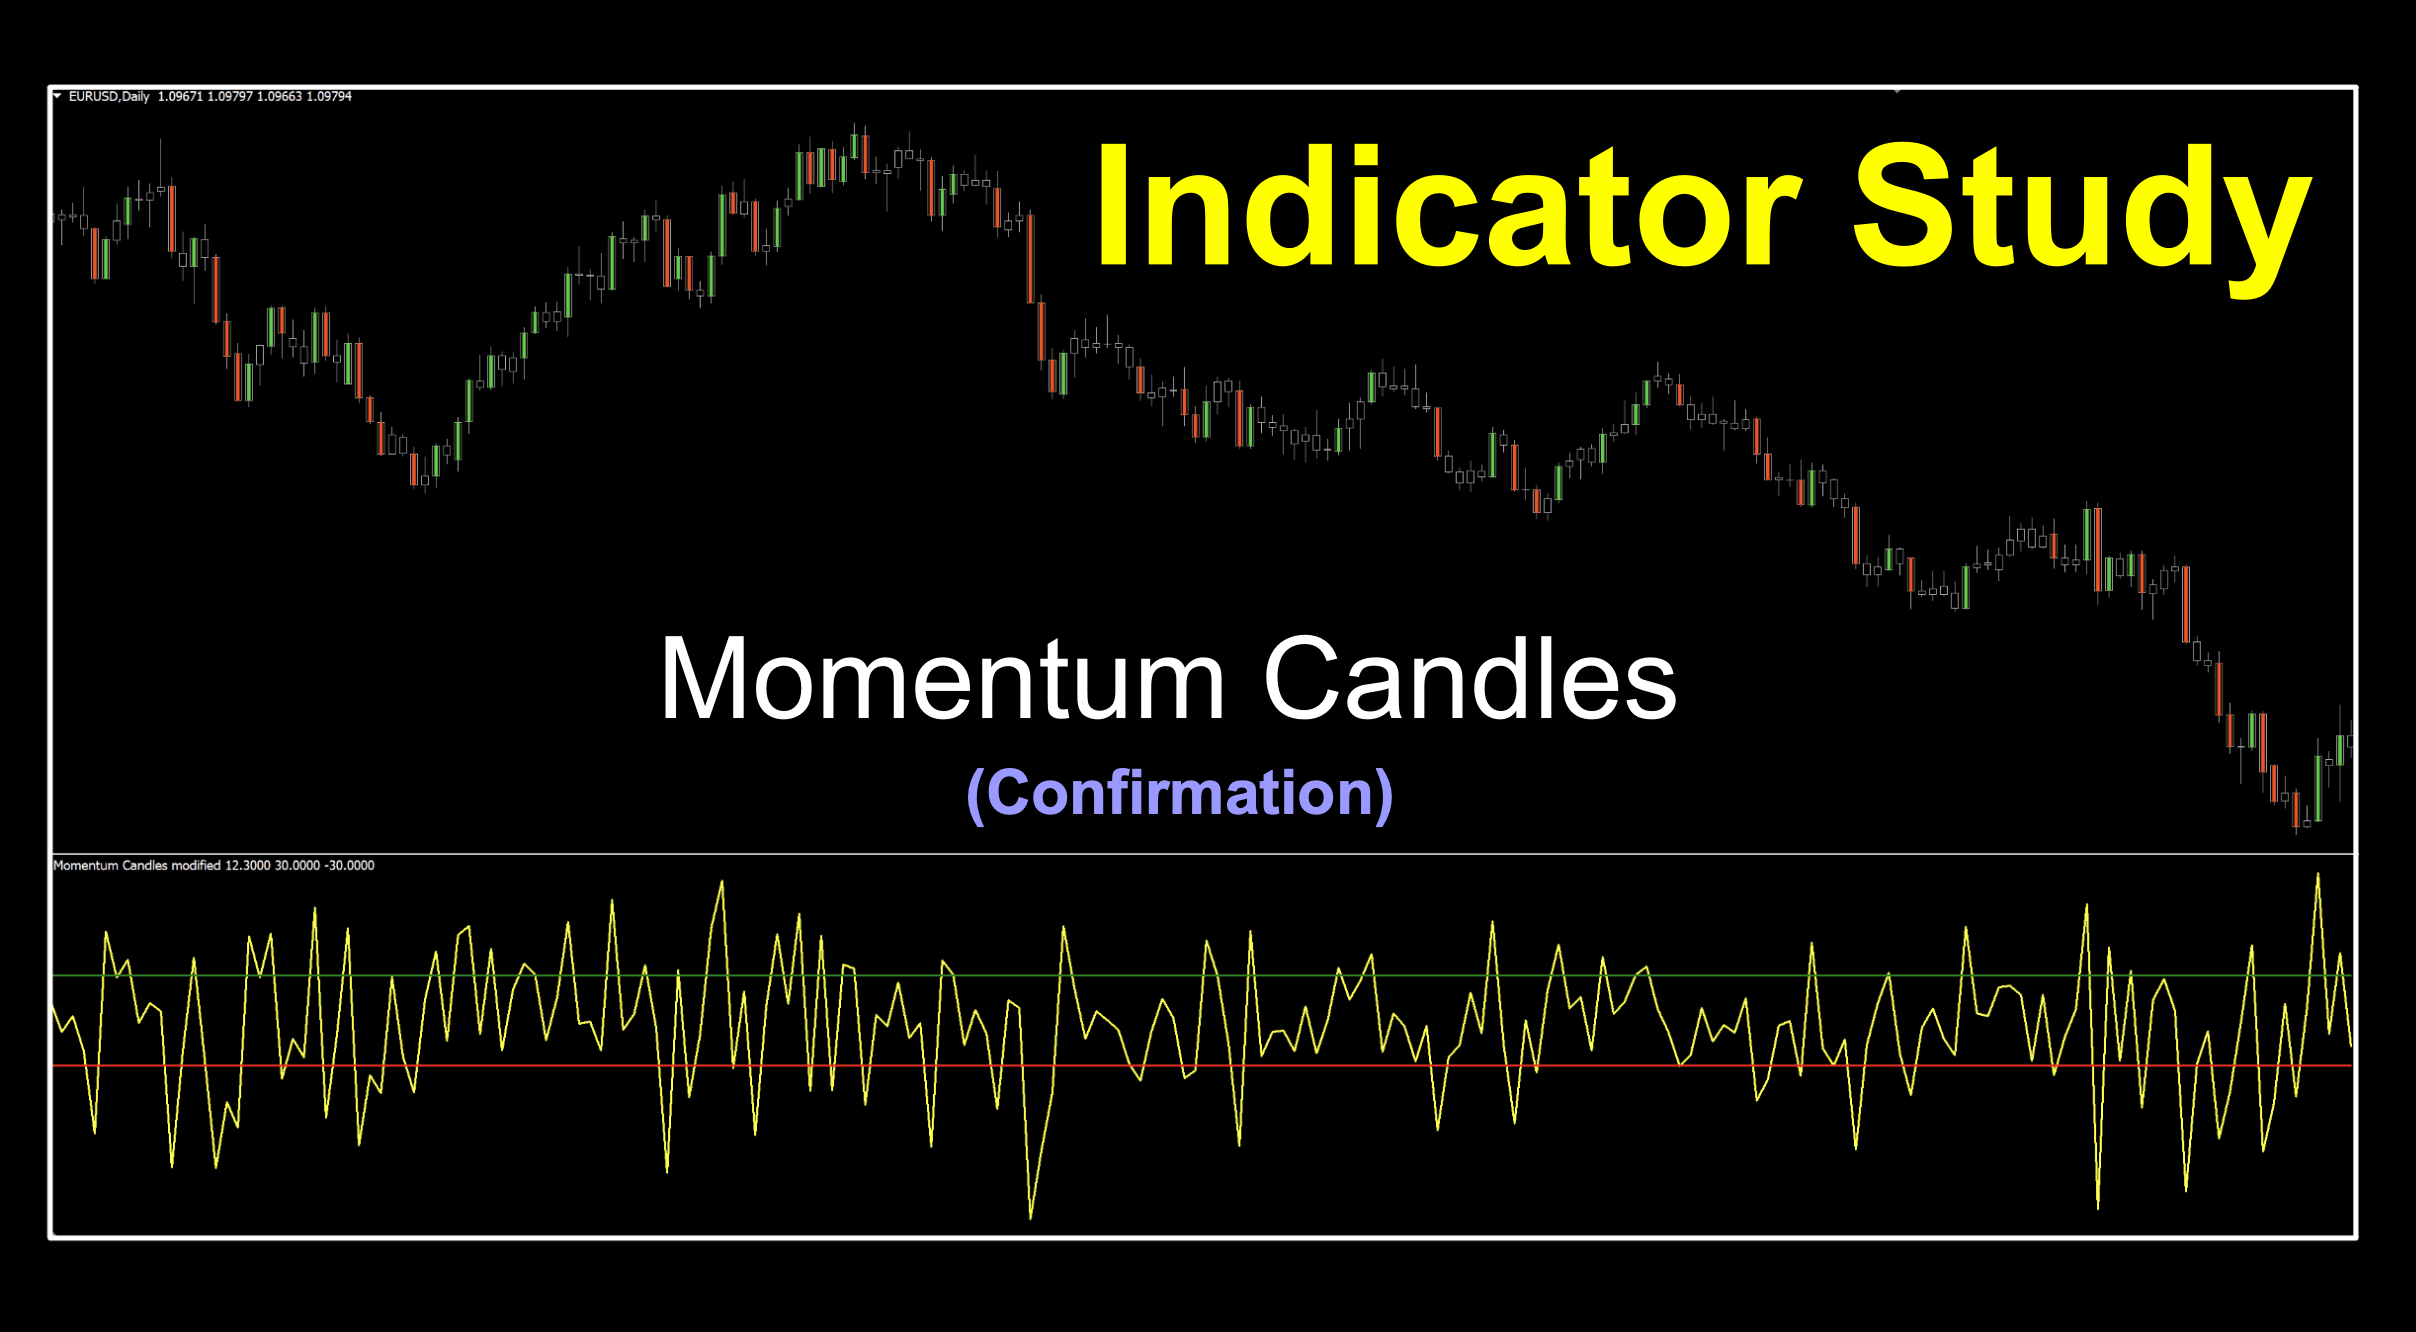
Momentum Candles

The Two Step
An interesting turn of events necessitated modifying this week’s indicator. In fact, we’re beginning to see a pattern. It didn’t plot correctly with the BTC/USD, and we’re noticing a trend. Don’t fret. We’ve got the horsepower to address this issue. Stay with us on this.
Newish
A relatively new addition to the MT4 world, the Momentum Candle indicator, was created in 2020. Momentum is a wonderful thing for us. Price charged with momentum (either way) tends to result in trending markets, which is what we’re all about. If you’re a BTC trader, the initial version we found would not plot correctly. That being the case, our good friend Niels not only made some adjustments in the code in the initial version to work correctly with BTC, but he also created the alternate version as well. We’ll have both modified versions in the library.
Dual Screen Dance
VP and I discussed the best way to approach this and decided to show both ways. A first, no doubt. So that being the case, we’re going to present the data stream with both versions overlaid; one of which is candle color dependent and the other a banded below chart oscillator. Man, that’s a mouthful. But, it’ll make more sense once you read how we use it and watch the video from your Sable Brown Corinthian Leather Barcalounger.

Simple Settings for Simple Decisions.
The math in this indicator is quite simple. It pulls the mathematical difference between period close and open. If that difference is greater than the indicator’s setting, it turns green. If the difference is less than the setting, it turns red. Easy-peasy. However, given that, this could become somewhat of an issue if we get an “FU” candle with a massive ATR, as we sometimes do with BTC. That’s where it failed and would not work correctly. Niels suggested using an ATR multiplier in lieu of the actual pip range and created the modified versions. It still performs as intended. Pretty nifty stuff.
Fun With Candles
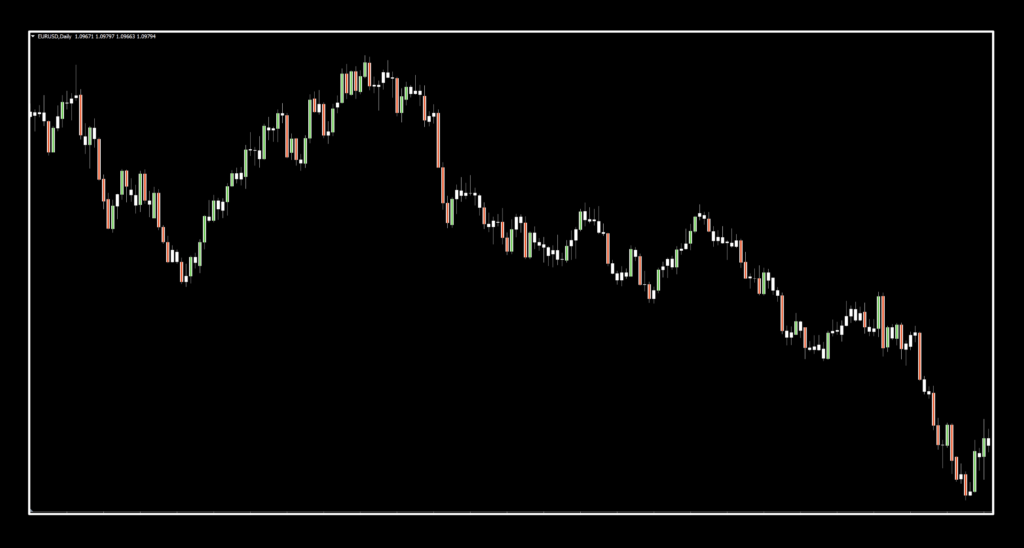
We’re going to look at the original (modified) version first. We made no changes. This is a candle color change; however, on whatever color candles you have, it’s a bit difficult to discern the indicator. So, we’re going to “ghost” the candles to let the indicator shine through.
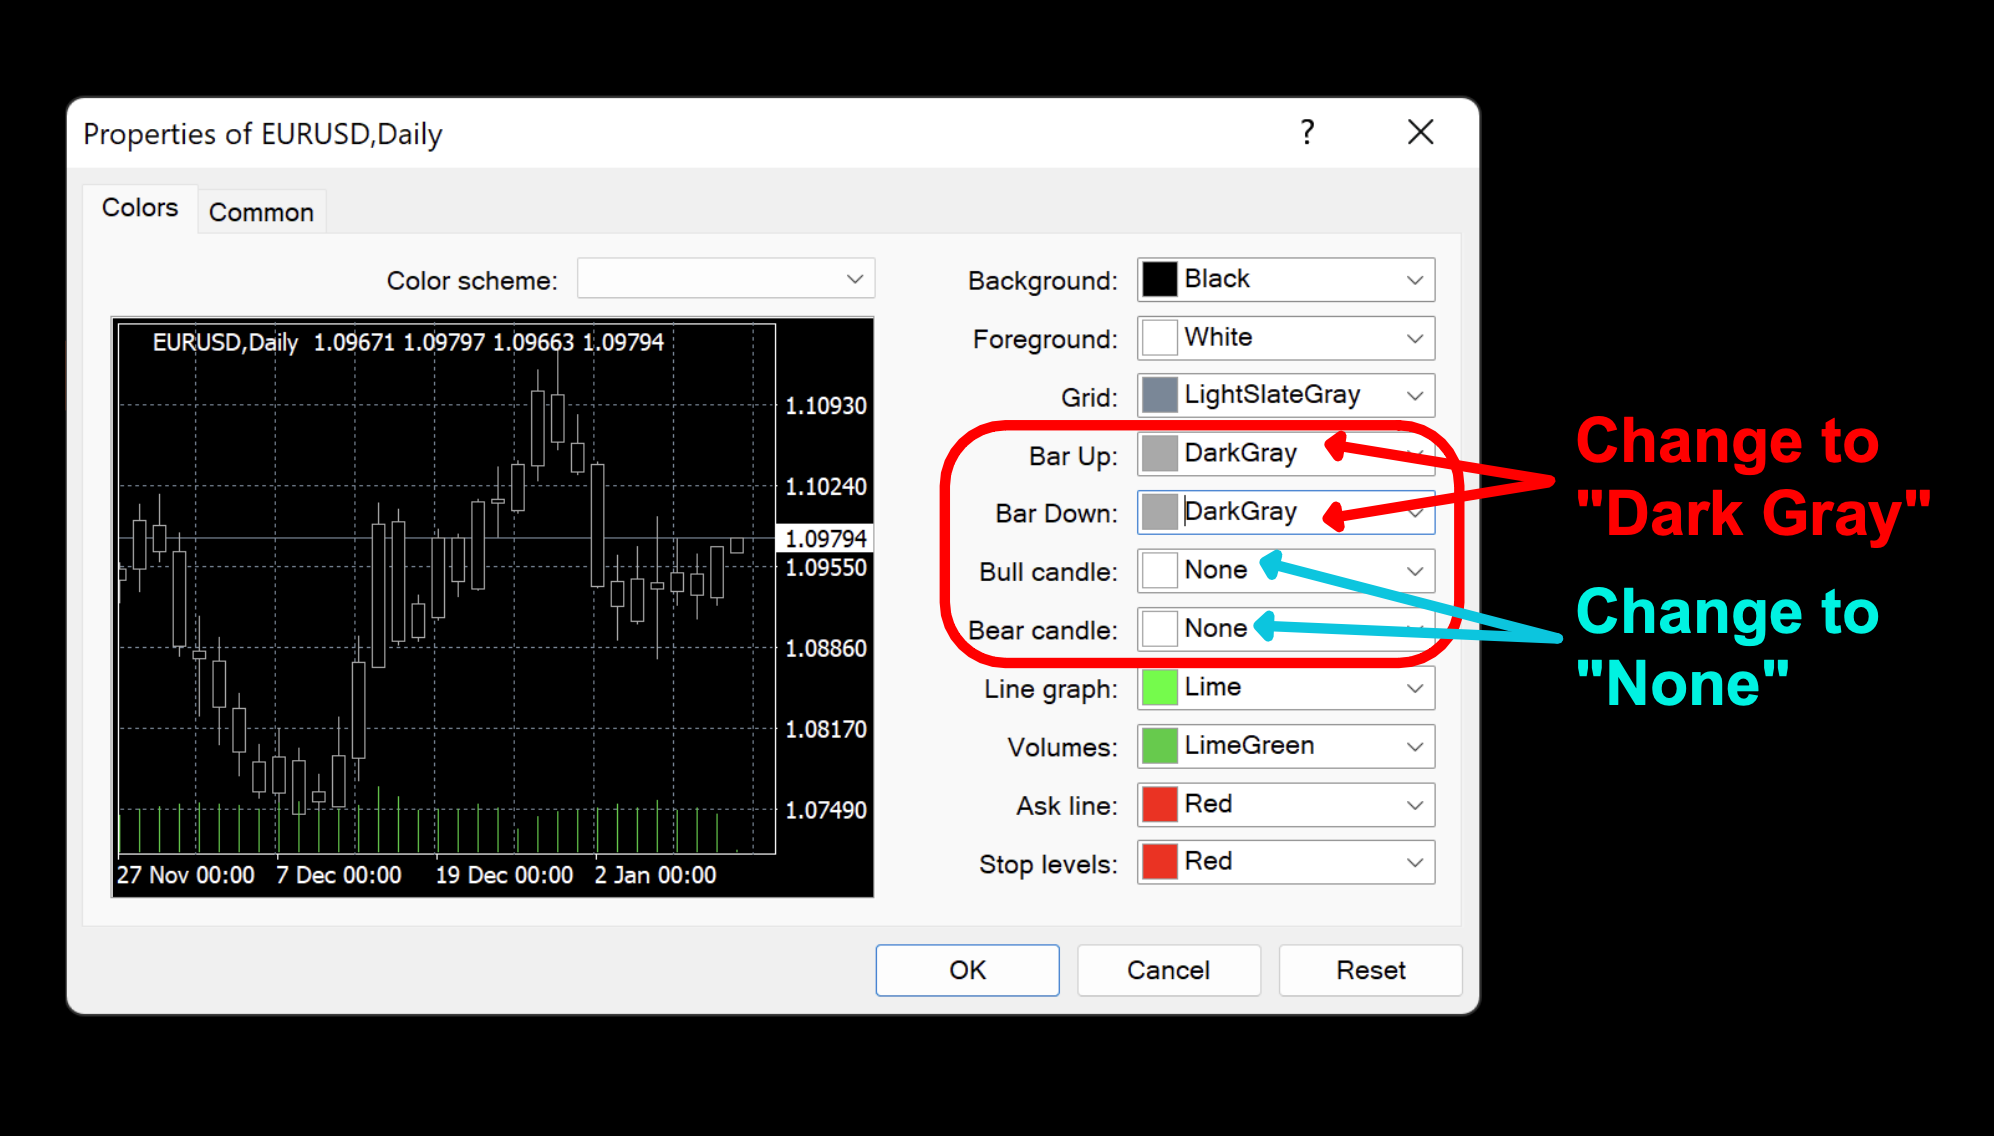
Below is an easier to see image for using this type of indicator. What we did was pull up the “properties” menu to make our changes. You can just right-click right on the chart or press F8.
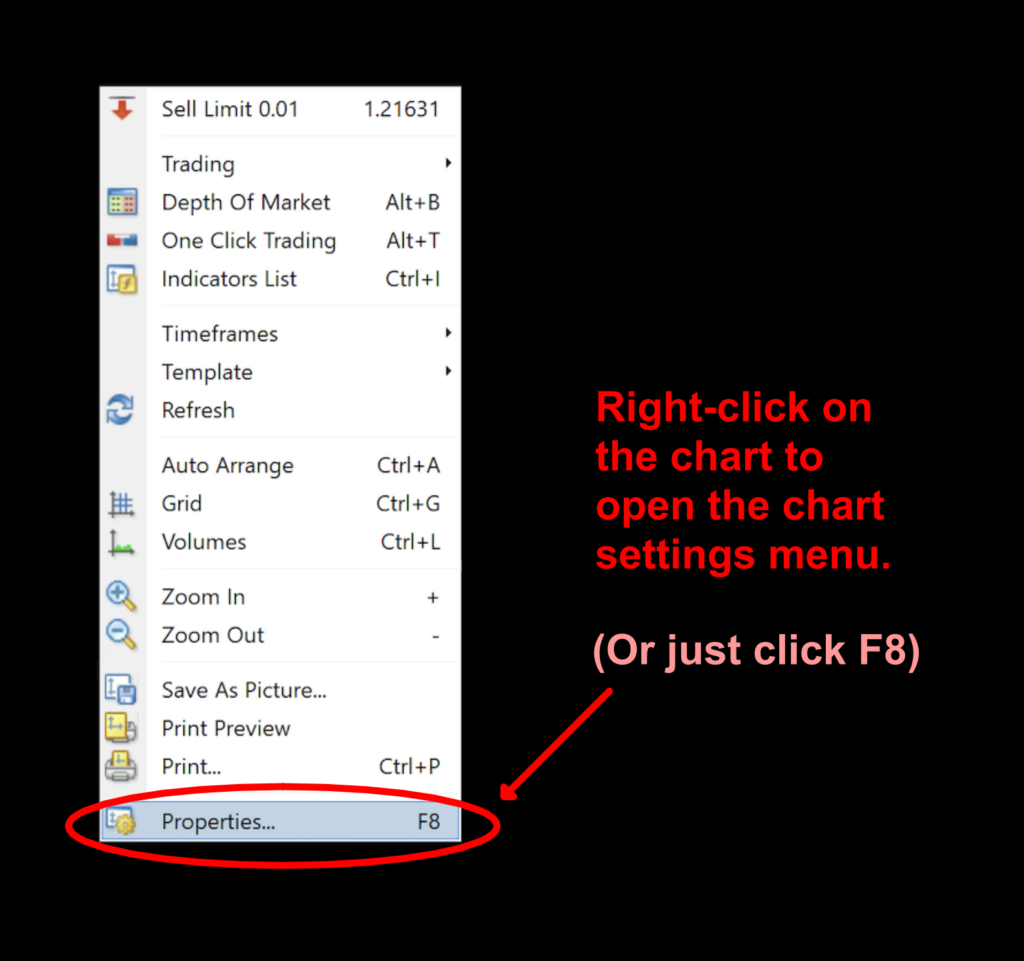
Once you click on “Properties”, the property menu pops up where various chart settings can be accessed. Click on the “Colors” tab to view the multiple chromatic choices for individual components.
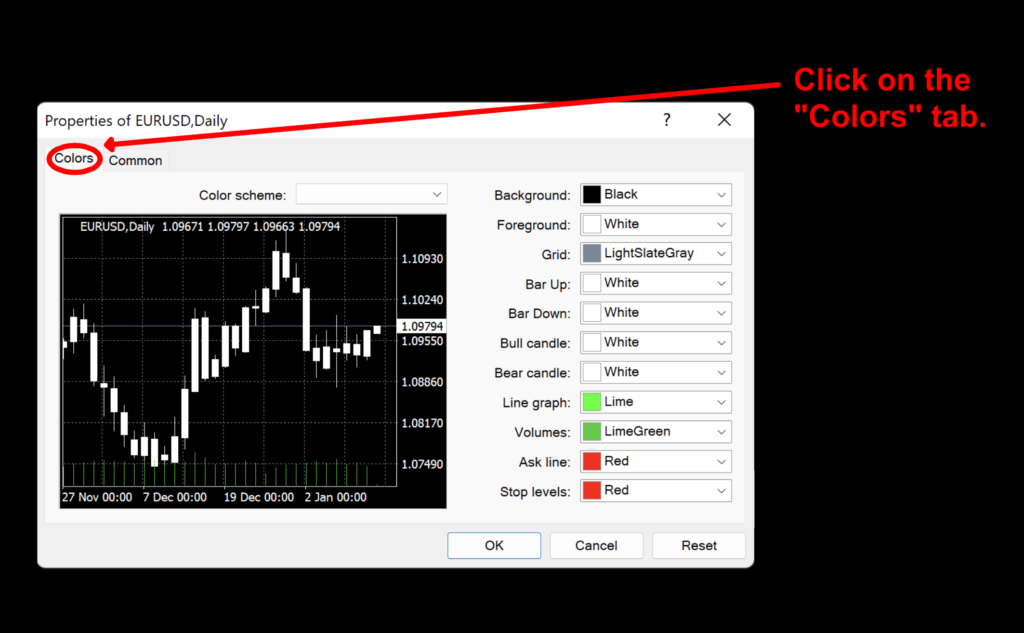
Now, you’ll change the “Bar Up”, “Bar Down”, “Bull candle”, and “Bear candle” from whatever setting you have to the following.
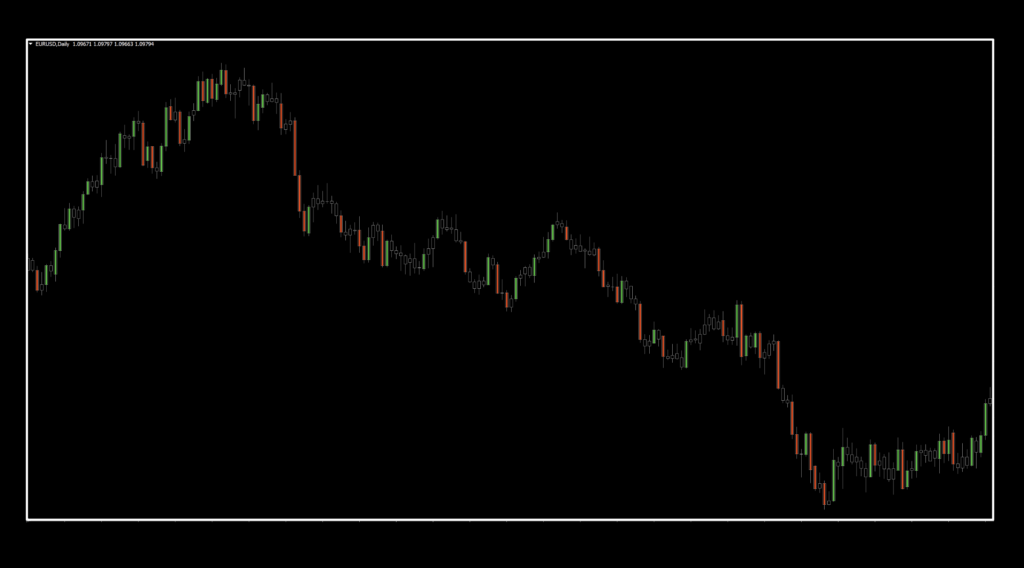
When you’ve completed the changes, your chart should look like this:
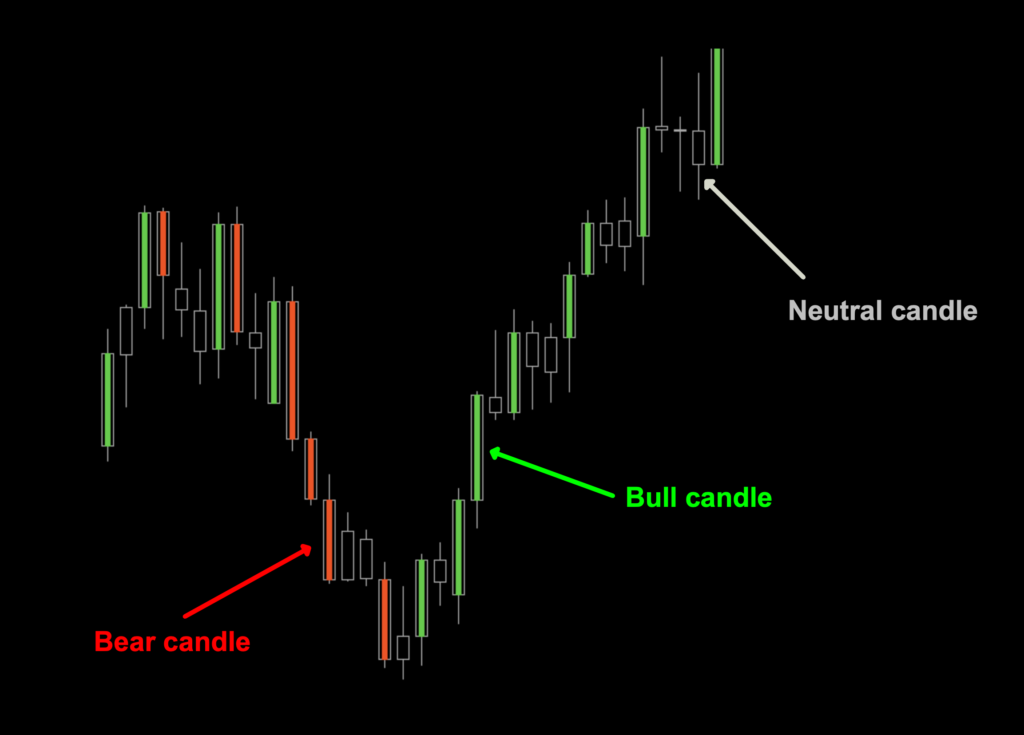
We’ll do us a close-up so you’ll have no questions about what you’re looking at.
Double Vision
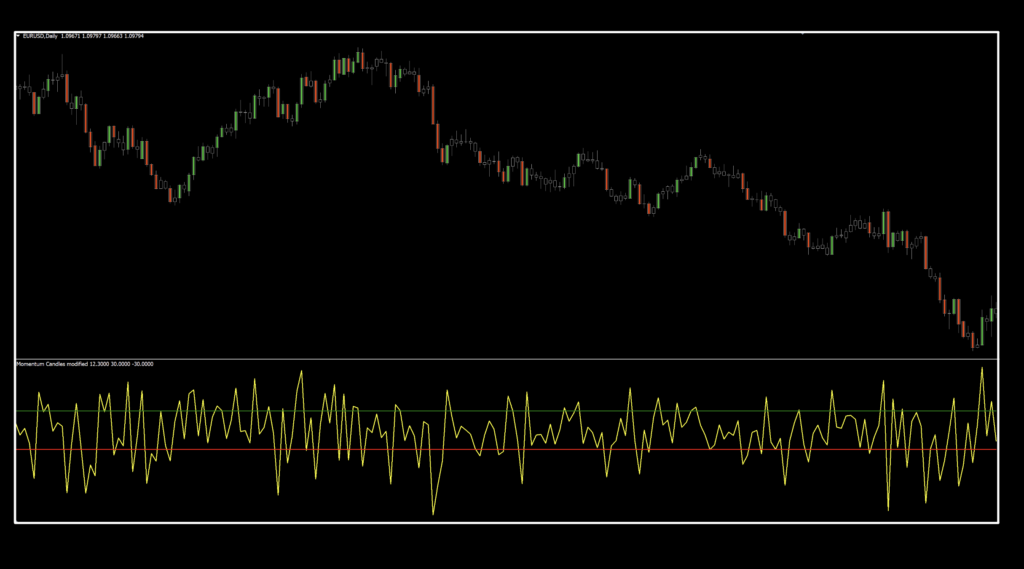
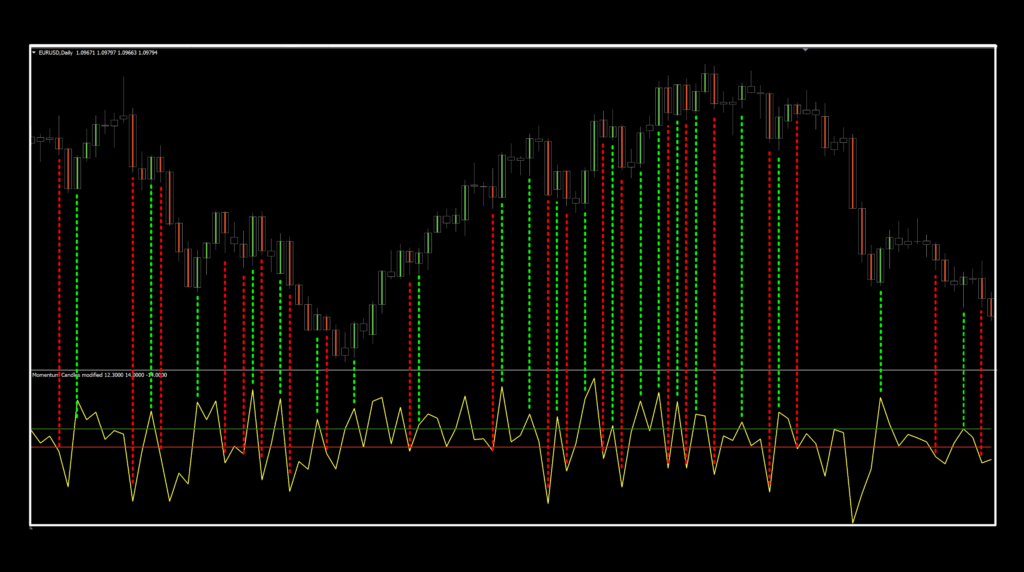
Now that we’ve explored the original version, let’s take a look at the modified version on the same chart.
I suspect it needs just a little explanation. Thanks to our handy dandy graphics department who just returned from their midday espresso break, we’ve got an image which will help explain what’s going on. We zoomed it and took a section of the chart.
Now, we’ll compare the two.
What we did was connect the candles to the corresponding points on the oscillator. Same signals, completely different views. The reason for this is that some traders prefer to style their charts in particular manners. Some want nothing on the price window and some want limited below chart windows, so…we’re giving you a choice.
Settings
We’re going to show you both setting menus. The first is the original and the second; the modified version. Happily, there is only one setting we use for both versions. The original candle version has a few alarm settings, but you can change the colors and their individual properties in both versions, if you wish.
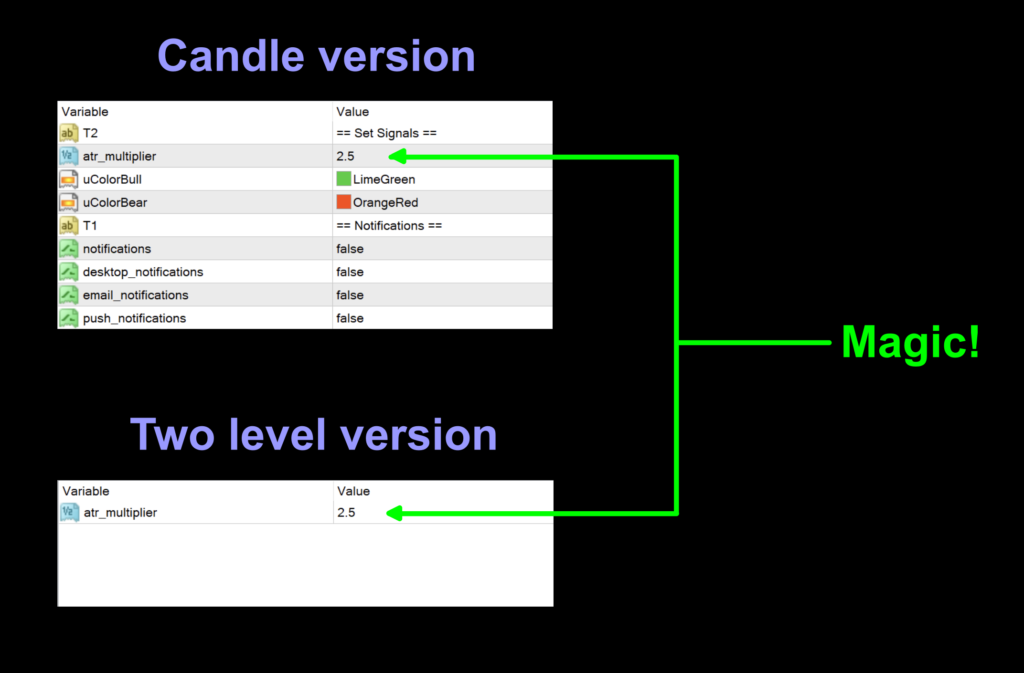
atr_multiplier: The “delta” or difference variable between the open and close of the period. The default value is 2.5.
Advantages
* Definitive signals.
* Choice of visual signal representations.
* Easy to test.
How we use it.
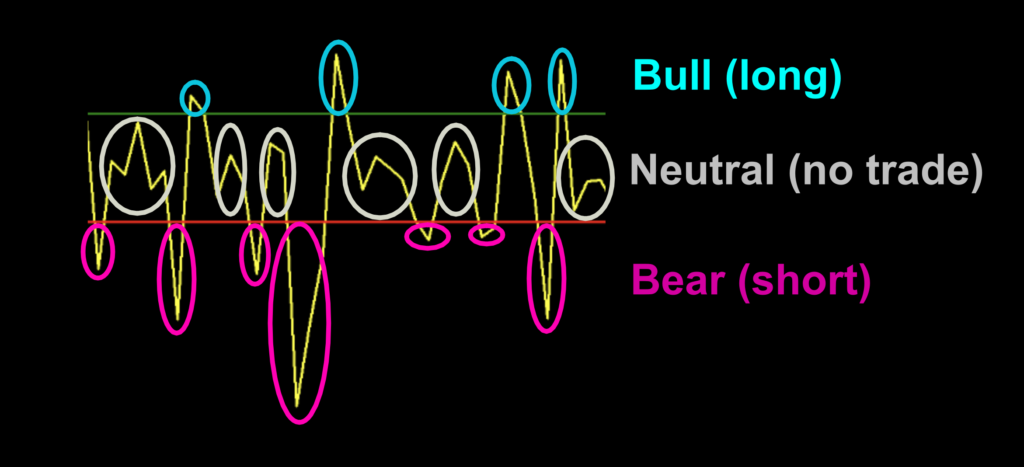
One of three actions need to happen in the last 30 minutes prior to the close of the trading day. They are; opening, maintaining, or closing, a position. This is when you make your trading decisions, and not actually wait for the close at 1700 EST, because we trade on the daily time frame. We explained it in a graphic mark up, but for anybody snoozing in the back of the class, this is for you.
Long (candle version): Interior of the candle turns green. Entry is in the last 30 min. of the trading day.
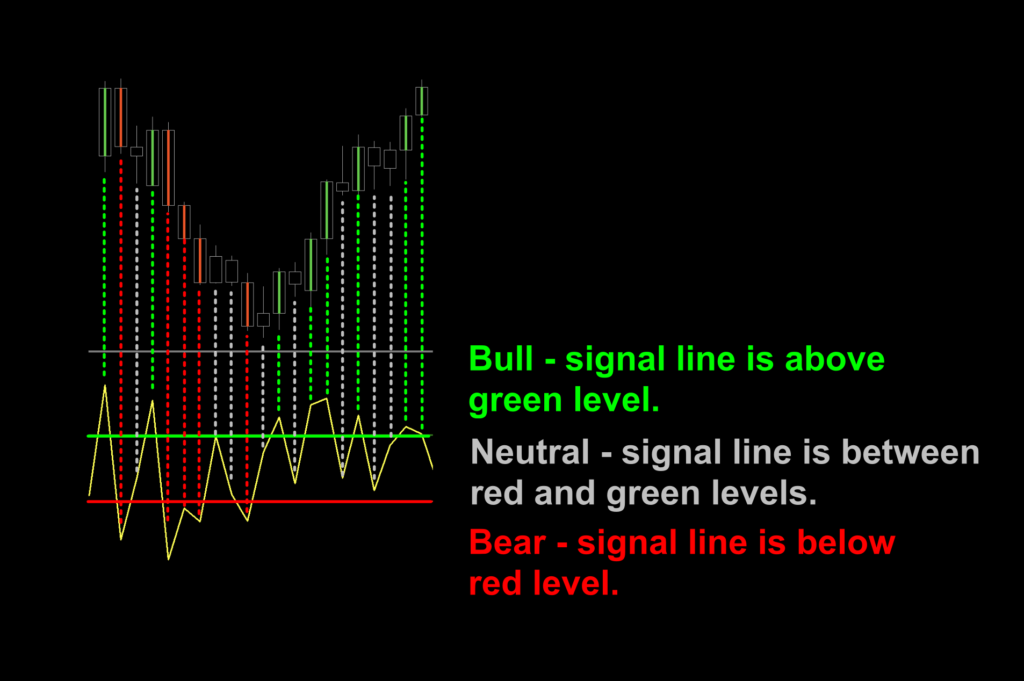
Long (two level version): Signal line is above green level. Entry is in the last 30 min. of the trading day.
Short (candle version): Interior of the candle turns red. Entry is in the last 30 min. of the trading day.
Short (two level version): Signal line is below red level. Entry is in the last 30 min. of the trading day.
No Trade (candle version): Interior of the candle remains colorless.
No Trade (two level version): Signal line is between green levels.
Zoomies
For the mark-up, we’re going to zoom in for a closer examination, as we’ll be marking off signals for both versions concurrently.
Pro hint: The smaller the number, the bigger price movement and the more chance of better momentum identification. However, too small of a number, and eventually you’ll get no signals.
Additional Notes
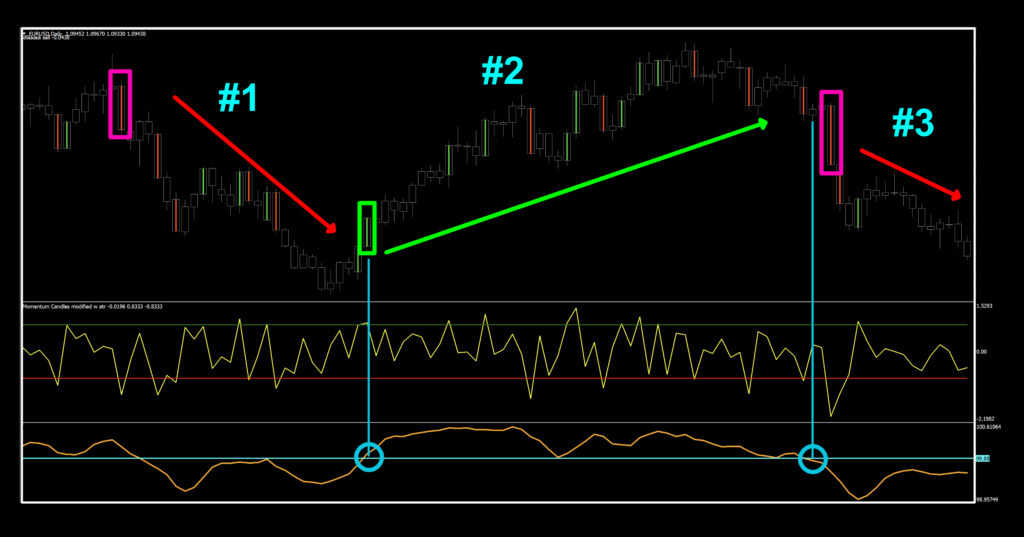
There is something we want to discuss. Given the fact that this indicator is based solely on price action, using it as an exit indicator is really not recommended. In fact, the results in the testing section don’t really give us a true gauge of what this indicator may be capable of. That being the case, we’ll also be including a supplemental graphic to help you understand how to use this indicator. In the mark-up below, we made a few random changes to the indicator settings to better explain it.
Whatcha Got There, Son?
Trade #1: Our profiled indicator is exhibiting a short signal (red rectangle). Once we’re in, we’re ignoring further signals and using a different exit indicator for our example. This one happens hasn’t been profiled yet, so we’re keeping it a secret for the moment (sorry, not sorry). The exit (first blue circle/line) happens to coincide with the next entry.
Trade #2: The green rectangle is the long signal given by our indicator. You would ignore subsequent signals and just look for the exit, which is the second blue circle/line.
Trade #3: A couple of candles later, we get the next short signal on that long red rectangle. We’d still be in this trade, according to the exit indicator.
Data Delivery, Sign Here
If you’re new to these studies, we recommend looking at some older blogs to understand how we conduct our testing. We’re going to be using our alternative numbers.
Numbers Needed
Below is the data from our testing.
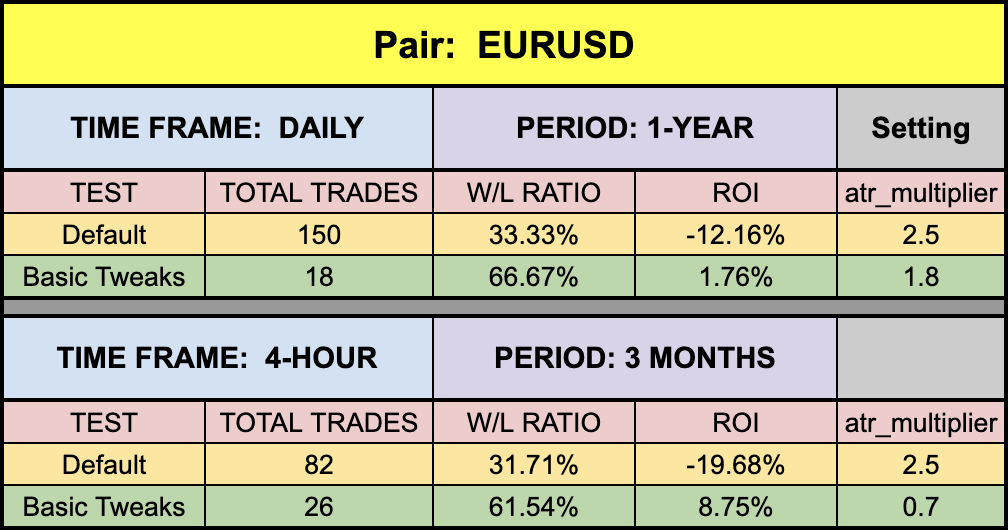
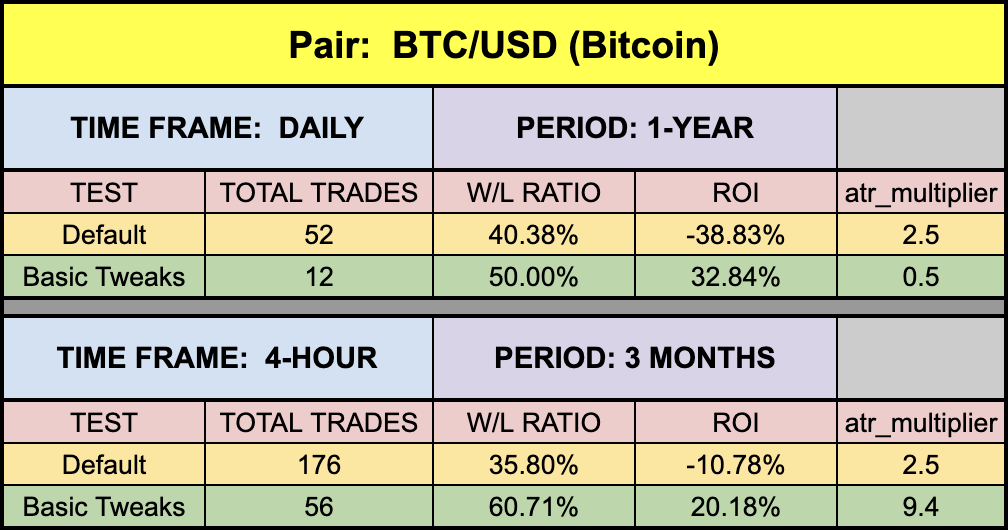
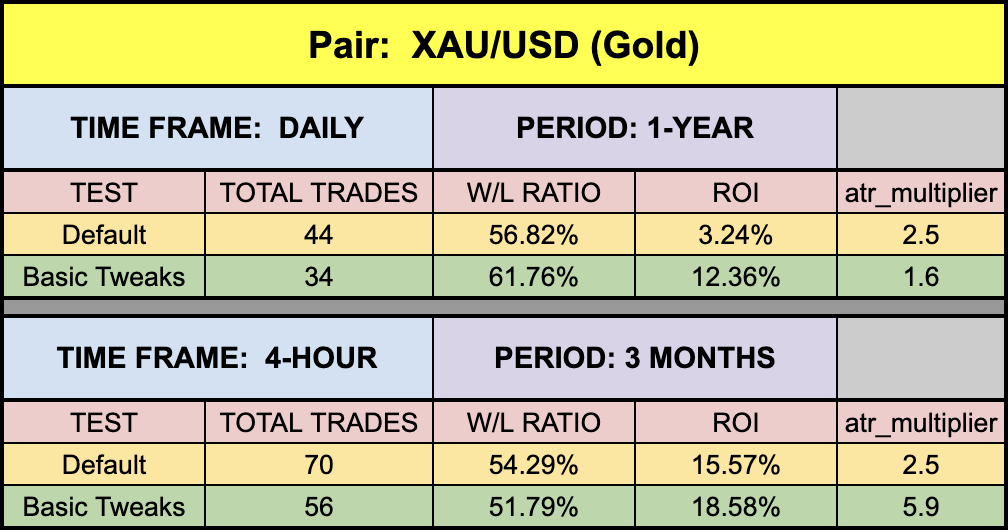
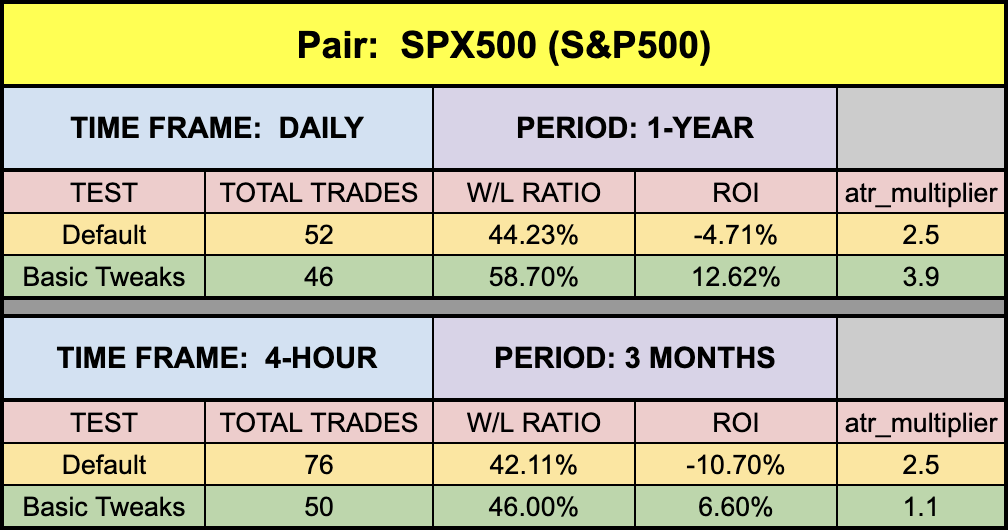
Not altogether bad across the board, if you ignore the EUR. That doesn’t mean it won’t perform on other Forex pairs, just that the current volatility in that particular market resulted in those settings for the time span tested. Good thing we’ve got 36 currency pairs to watch. BTC and XAU did quite nicely, with BTC winning the most improved award. SPX also posted decent numbers. I’d definitely take this for a spin as it’s easy to test, easy on the eyes, and because you’re a dedicated student of the craft.
Resources
As mentioned, both indicators will be available in the library for free. When you’re ready to get them, click HERE. For the advanced course, click HERE.
Our only goal is to make you a better trader.
BTW – Any information communicated by Stonehill Forex Limited is solely for educational purposes. The information contained within the courses and on the website neither constitutes investment advice nor a general recommendation on investments. It is not intended to be and should not be interpreted as investment advice or a general recommendation on investment. Any person who places trades, orders or makes other types of trades and investments etc. is responsible for their own investment decisions and does so at their own risk. It is recommended that any person taking investment decisions consults with an independent financial advisor. Stonehill Forex Limited training courses and blogs are for educational purposes only, not a financial advisory service, and does not give financial advice or make general recommendations on investment.