
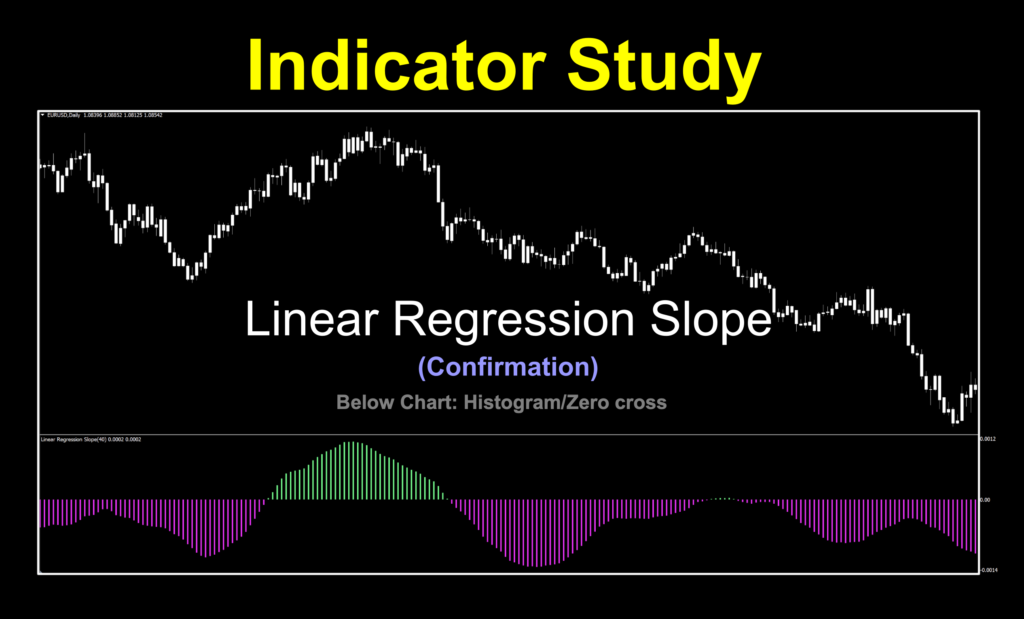
Linear Regression Slope
Stuck in a Rut
We’ve been on a bit of a tear with one particular mathematical type of system lately. But that’s okay because it’s done pretty good by us. We’ve also got a minor correction we wanted to bring up, which actually got us going down the road for this week. We promise, it’s not a big deal, and we’re pretty sure it won’t keep you up at night.
First Things First
We wanted to bring up a minor “misspeak” regarding last week’s indicator profile called the Kuskus Starlight (I still can’t get past that name without grinning). Any way, when we were discussing the math portion, we inadvertently mentioned that Linear Regression was part of its architecture. That was not correct. There is no LR math in that indicator. We happen to be looking at this week’s project at the same time, and confusion ensued. Our apologies. We’ve corrected the blog, but the video still stands and there is no way to fix that, so we’re just letting you know because we want to be as correct as possible.
Returning To Your Regularly Scheduled Broadcast
Now that’s out of the way, let’s continue where we left off. We’re looking at an indicator called Linear Regression Slope, which coincidentally is exactly what it contains. It’s a histogram that crosses a zero line, so you can just ignore the amplitude (height) of the colored lines as you’re not using it as a reversal or divergence indicator. The version we’re using was coded in 2019, and we’ll take a little nose dive into what LR is all about.
LR for the Masses
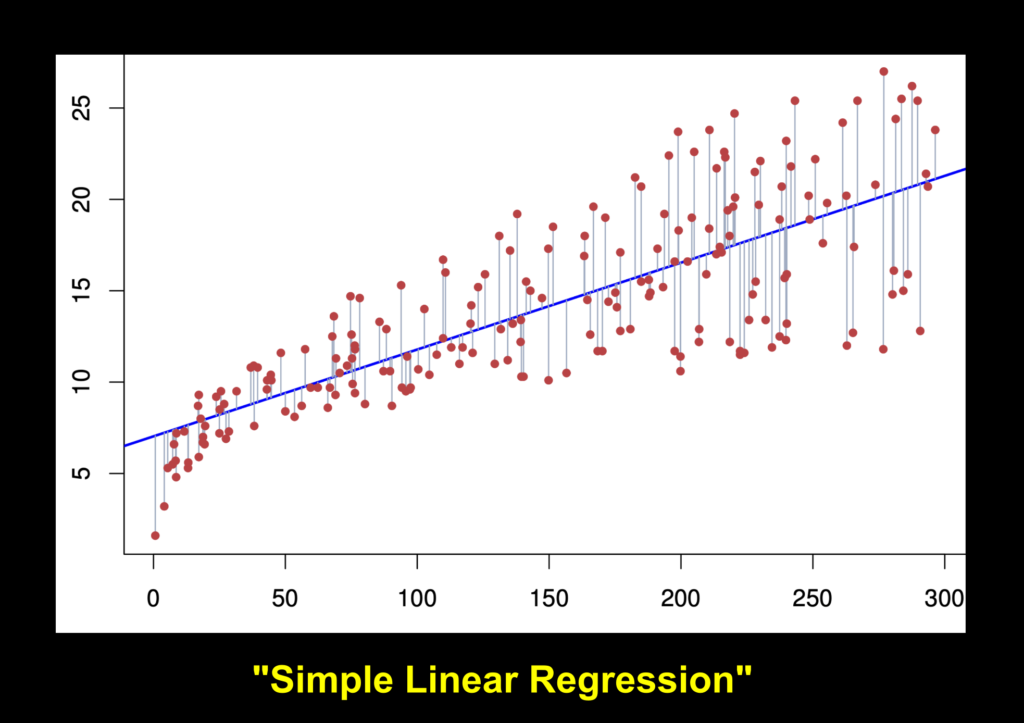
We briefly covered what LR is in the last blog, but since we edited it for accuracy, it’s no longer there. That being the case, we’ll throw in a quick reminder. By the way, there are multiple types of linear regression. The one we generally see is “Simple Linear Regression”. In a nutshell, it’s a bunch of points where the objective is to find a line that “fits” them the best. Kind of like this…
Walk The Line
For any line you try, each point has a distance to that line, which tries to minimize the discrepancies between predicted and actual output values. Linear regression is used in everything from biological, behavioral, environmental and social sciences to business. Did we just read “business”? Yeppers, that’s us. We see it all over the place.
Bunny Slopes
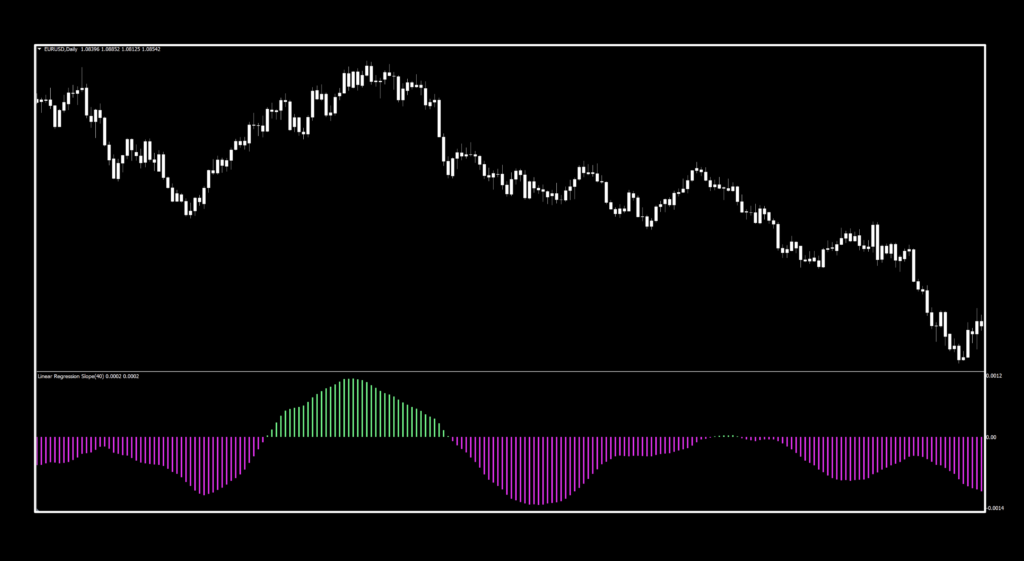
Except for the colors, we left everything the same. The default colors were just plain red and green, but by golly, aren’t these just festive and bright? There’s no mistaking these signals. Maybe squint a bit if it causes you any discomfort. We left candles dirty snowball colored white to keep you focused on the festivities.
Settings
The settings for this indicator are just the best. Only one. So testing won’t take long for you to find what works best for you.
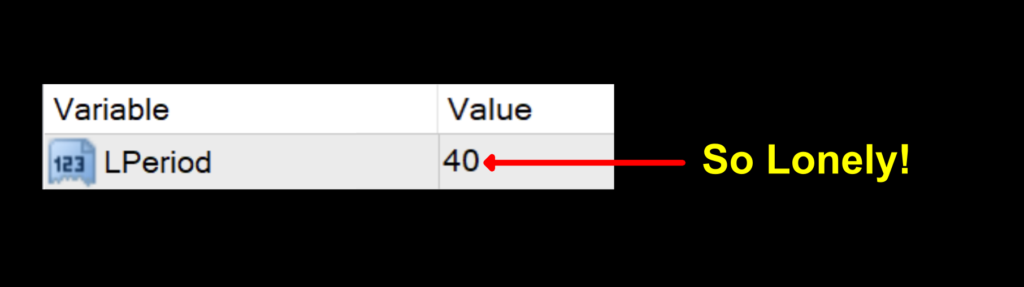
LPeriod: The number of periods used to calculate the histogram. The default value is 40.
Advantages
* Very easy to test.
* Super clear signals.
* Uses a proven methodology used extensively in trading.
How we use it.
One of three actions need to happen in the last 30 minutes prior to the close of the trading day. They are; opening, maintaining, or closing, a position. This is when you make your trading decisions, and not actually wait for the close at 1700 EST, because we trade on the daily time frame.
Long: Histogram turns green and is above zero line. Entry is in the last 30 minutes of the trading day.
Short: Histogram turns red and is below zero line. Entry is in the last 30 minutes of the trading day.
Get Your Coloring Book
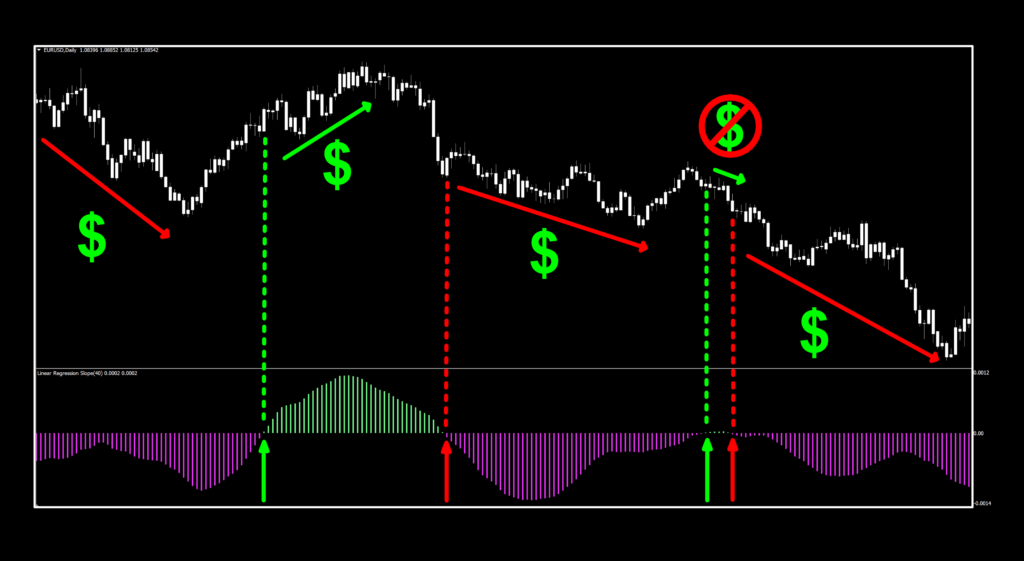
There are some good signals which will keep you in a trade, but at the default setting, they’re a bit late (slow) on both the entry and from that long trade, the exit. So a C2, perhaps? We’ll see what we can do with it during our testing phase.
Money Moguls
If you’re new to these studies, we recommend looking at some older blogs to understand how we conduct our testing. We’re going to be using our alternative numbers.
The Gift That Keeps on Giving
Below is the data from our testing.
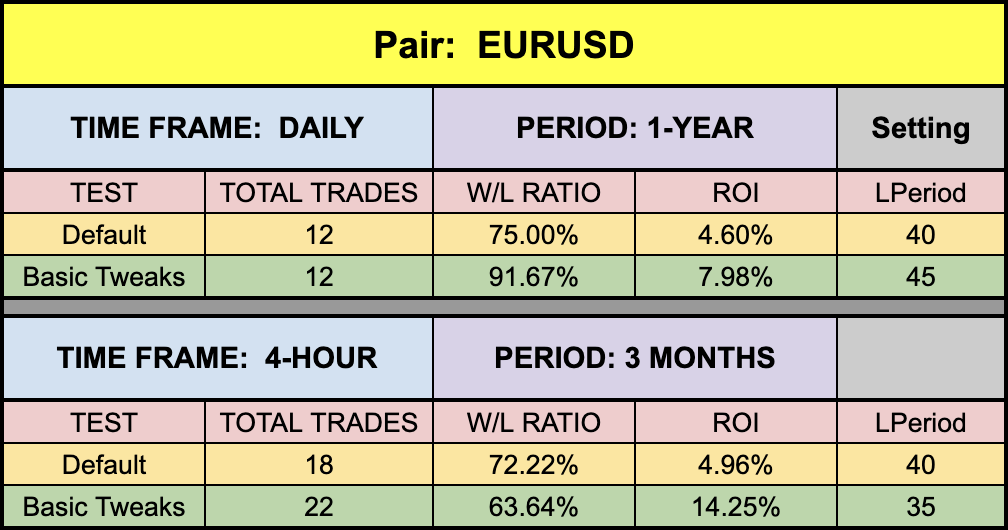
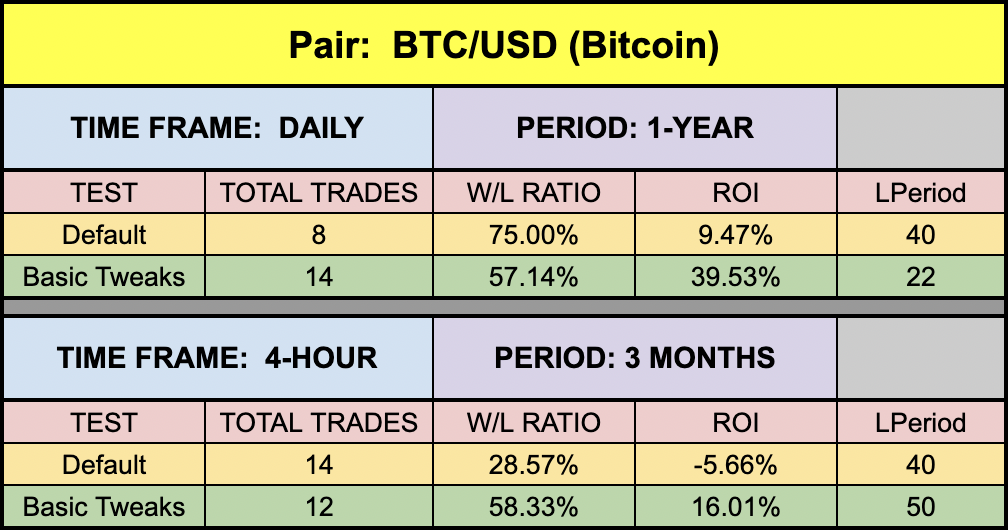
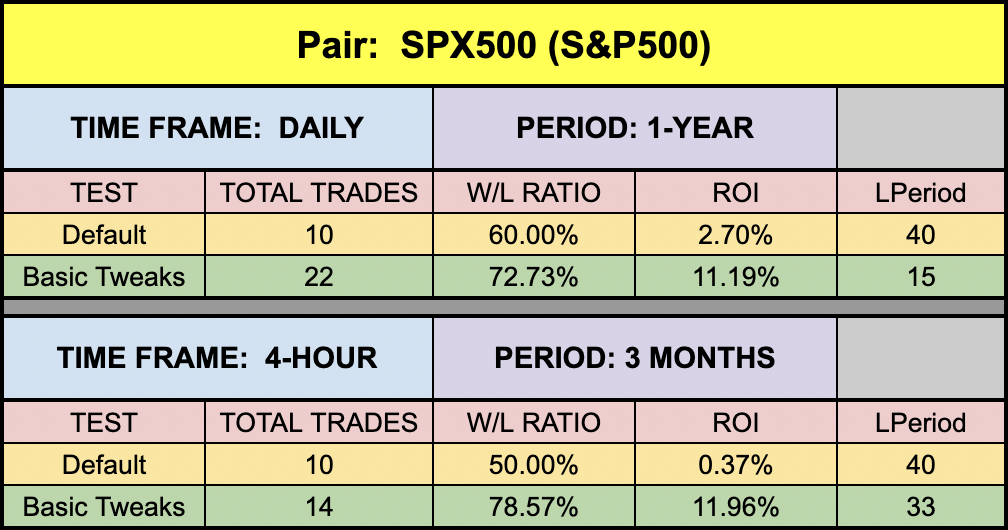
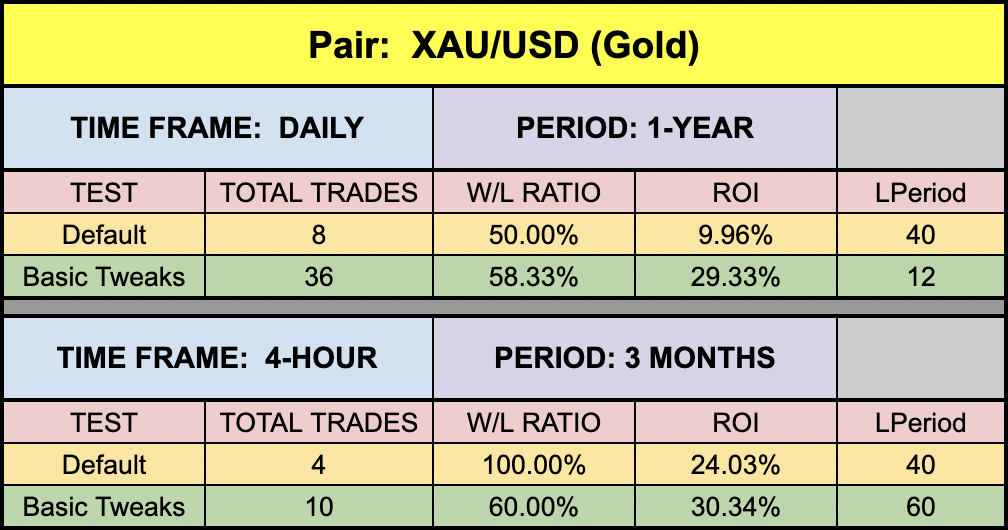
Again, not a bad way to begin your day. Granted, it’s not pops, puffs, or pebbles, but it’s at least second best. Nice smoothness. Did you happen to notice that every ROI except for one started out positive? Of course, it’s slower than some other confirmation indicators, this decidedly C2 bowl of tasty goodness has some pretty good numbers. Grab your spoon and dig in…
Resources
You can find this indicator in the library for free. When you’re ready to get it, click HERE. Be sure to subscribe to the Stonehill Forex YouTube channel for the technical analysis videos. For the advanced course, click HERE.
Our only goal is to make you a better trader.
BTW — Any information communicated by Stonehill Forex Limited is solely for educational purposes. The information contained within the courses and on the website neither constitutes investment advice nor a general recommendation on investments. It is not intended to be and should not be interpreted as investment advice or a general recommendation on investment. Any person who places trades, orders or makes other types of trades and investments etc. is responsible for their own investment decisions and does so at their own risk. It is recommended that any person taking investment decisions consults with an independent financial advisor. Stonehill Forex Limited training courses and blogs are for educational purposes only, not a financial advisory service, and does not give financial advice or make general recommendations on investment.