
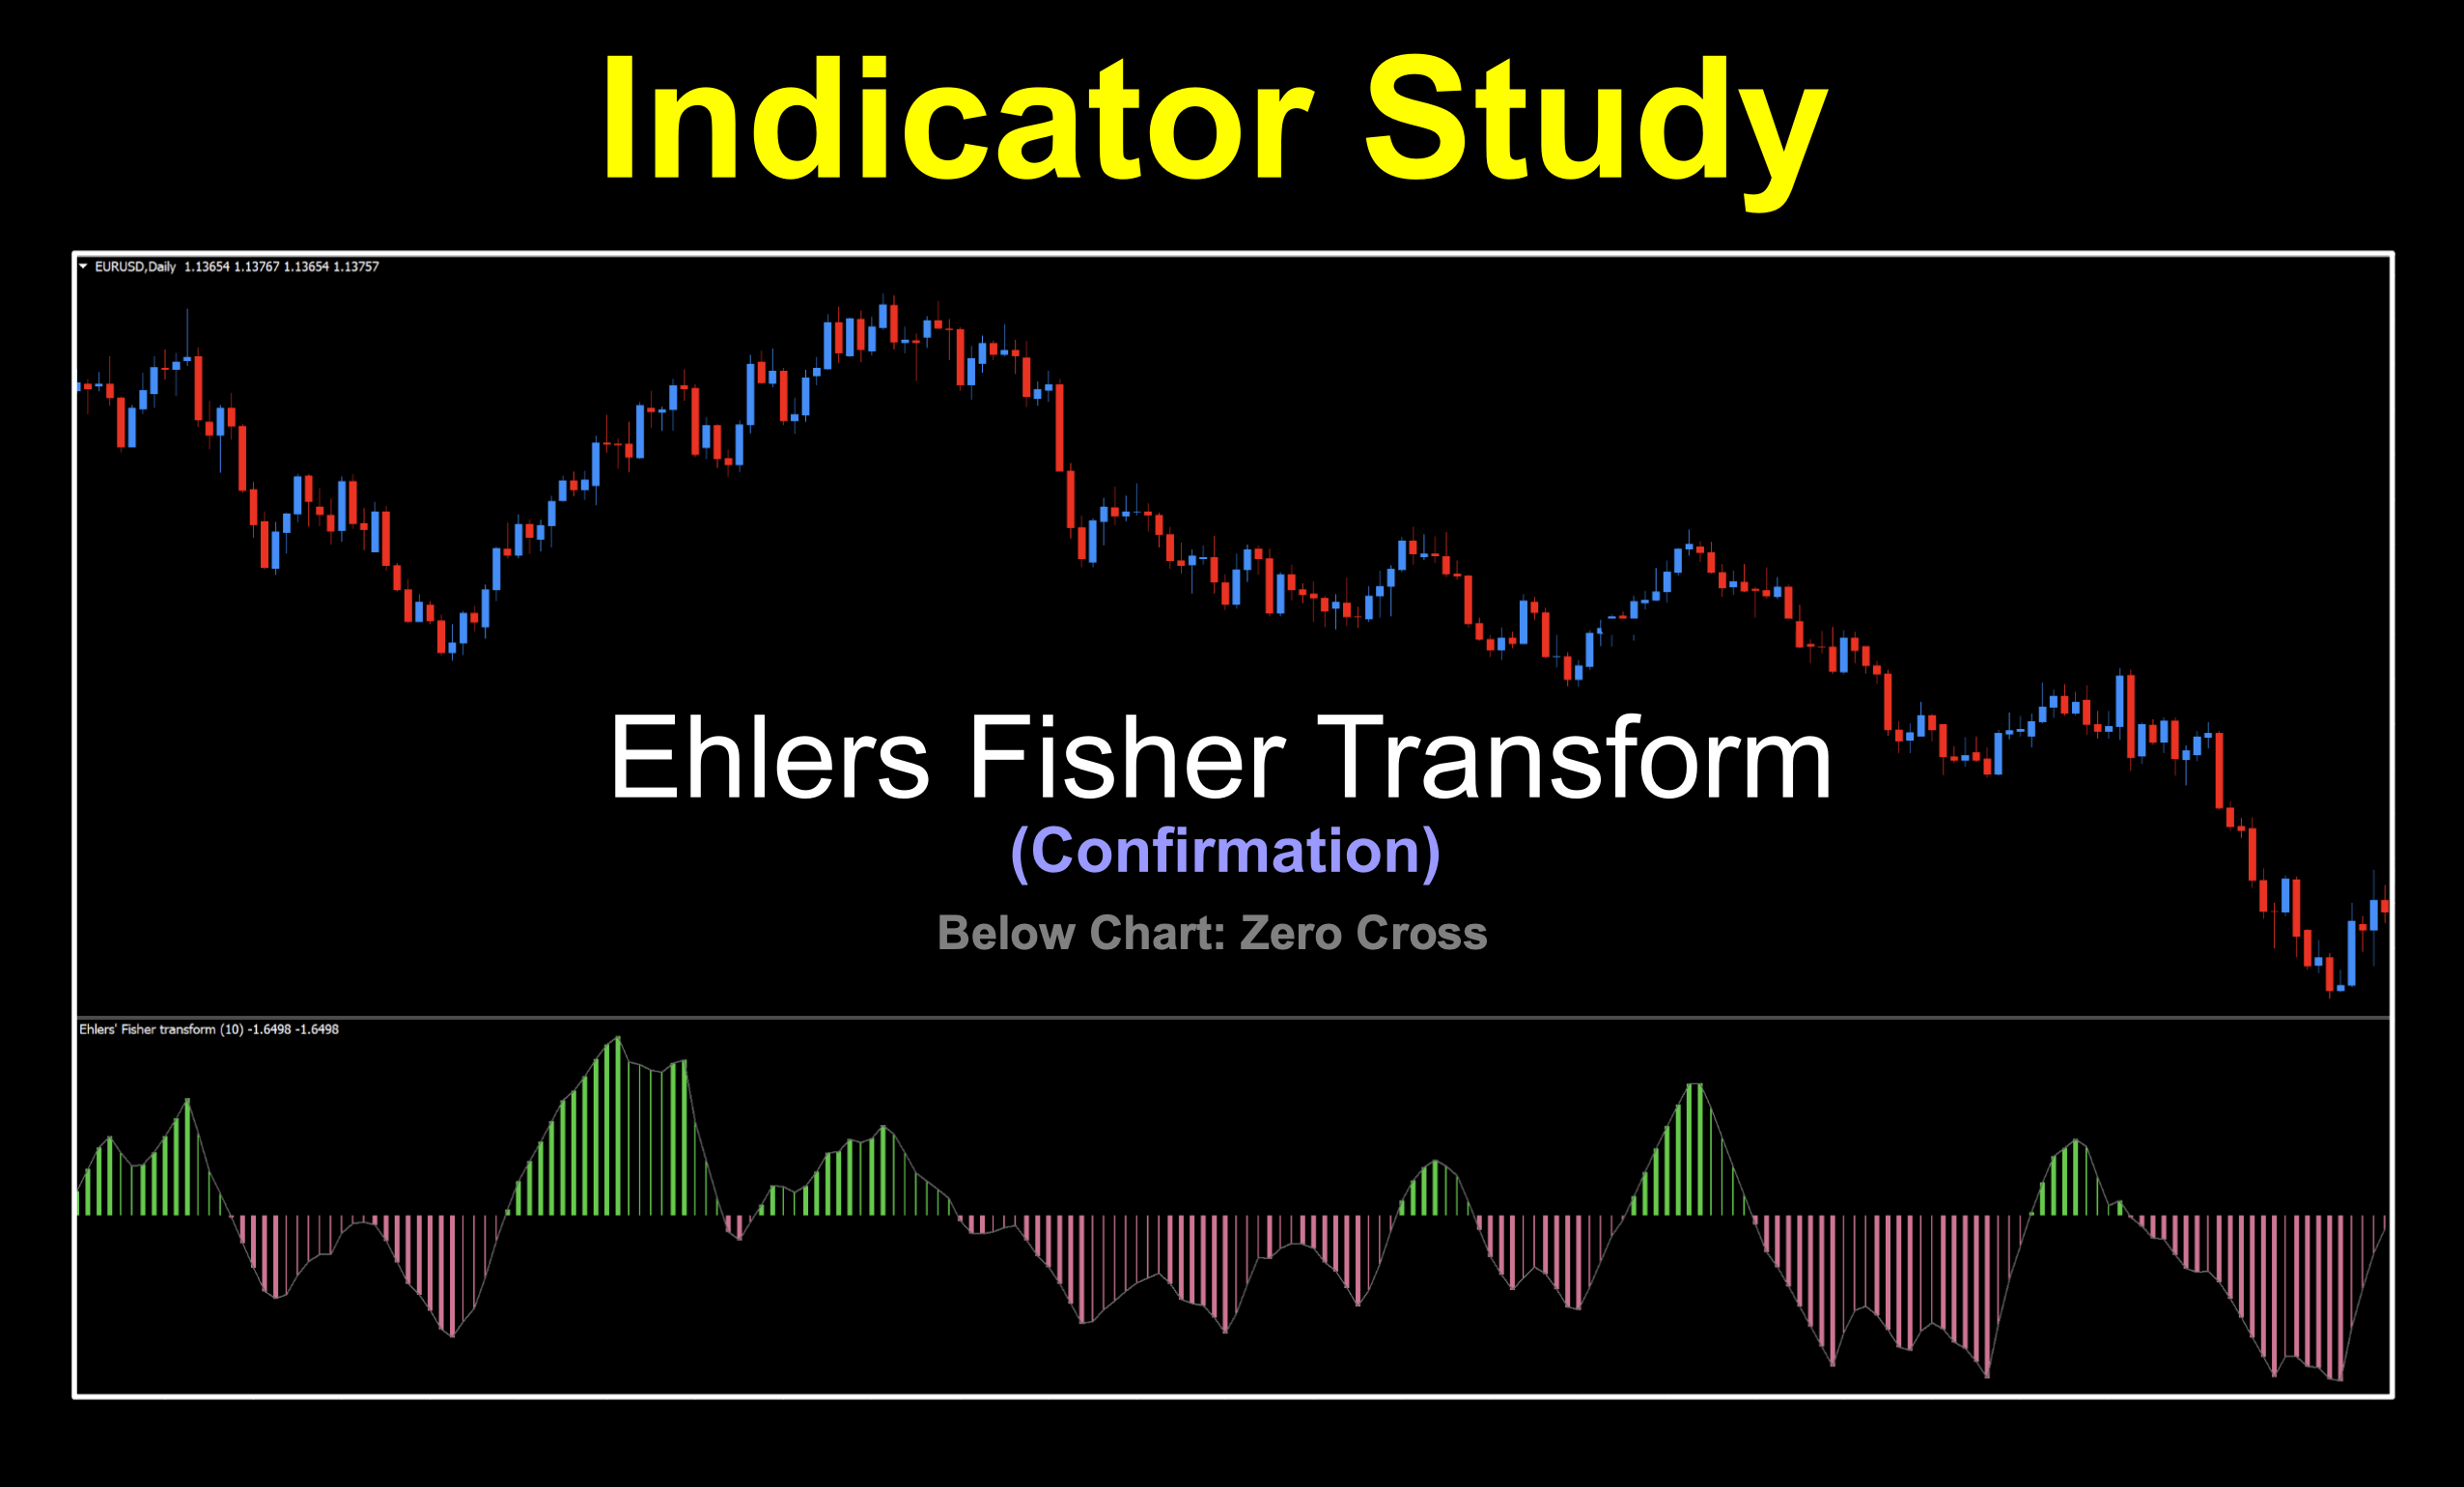
The Dude
We’ve got another goodie from our man, Mr. John Ehlers. By the way, what’s with the term; “Fisher”? We see this term in a few other indicators as well, but who actually knows what it refers to? Hey, we do! Fisher is in reference to the Fisher Transformation, a mathematical function named after the famous statistician and geneticist Sir Ronald A. Fisher who created the original statistical transformation function in 1915 to transform Pearson’s correlation coefficient into a variable with a normal distribution. John Ehlers adapted this statistical formula for this indicator in 2002.
No Wiggles
What makes it useful is that it filters out random price wiggles that can trick traders into making horrible decisions. While it was originally designed to spot reversals, something we really don’t subscribe to, it was mentioned that it does quite well when used in a system. Say, isn’t that what we do?
Link for Technical Analysis Video will be uploaded shortly!
Computational Reckoning
The Ehlers Fisher Transform begins by normalizing price data, which simply means converting price into a standard format that shows where the current price is located compared to its recent trading range. Instead of focusing on the actual price level, the indicator looks at whether price is near the top, middle, or bottom of its recent range.
This allows the Fisher Transform to compare price movement more accurately, even across different markets with different price levels and volatility. After the price is normalized, the Fisher calculation highlights stronger momentum moves by making important changes stand out more clearly.
Gone Fishing With Ehlers
- Median Price:
- (High + Low) / 2
- Normalize Price Within Range:
- Value = 2 × ((Price – Lowest Low) / (Highest High – Lowest Low) – 0.5)
- Apply Fisher Transformation:
- Fisher = 0.5 × ln((1 + Value) / (1 – Value))
And as they say in France…”Cool, eh?”
Look’in Fine
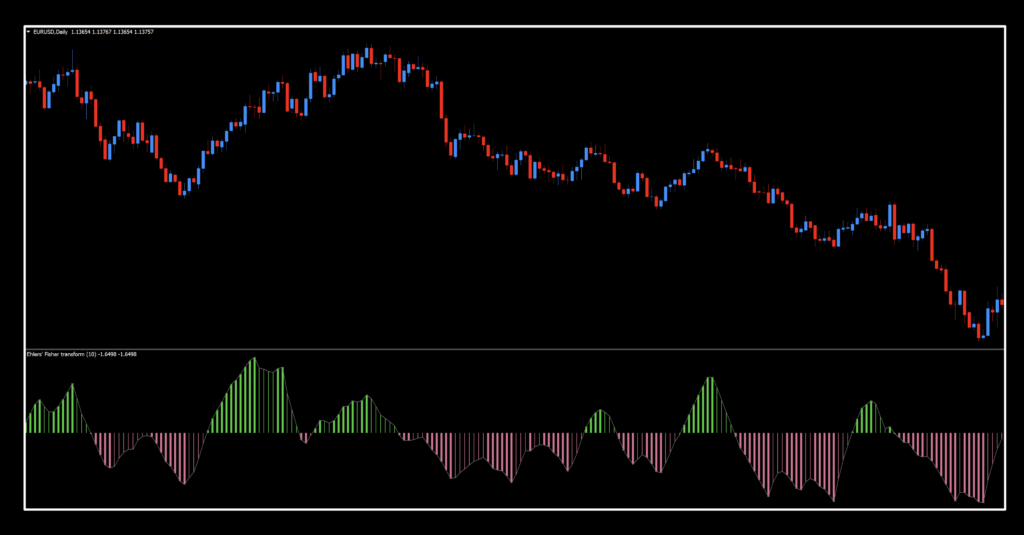
Below is the default view of the chart. Happily, we did not have to make any changes to the appearances, so one less thing to do, is always welcomed.
Settings
Unlike the last indicator we did which had six (6) variables and created a zillion iterations for testing lasting days, this one only has two and tested much quicker. However, for our fellow testing nerds, I’ll be making a slightly deeper dive into what to look for so you’re not out fishing for your own good results.
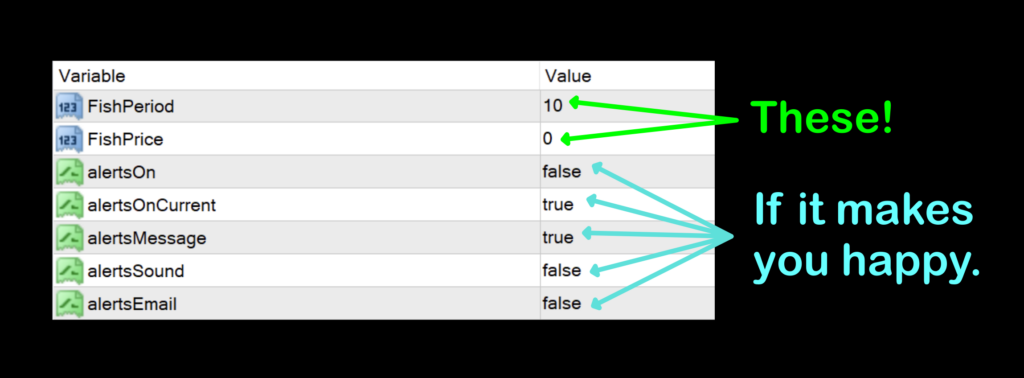
FishPeriod: The number of periods used in the overall calculations. The default value is 10.
FishPrice: Selects which price is used for the calculation. The default value is 0.
- Close=0
- Open=1
- High=2
- Low=3
- Median=4
- Typical=5
- Weighted=6.
Daily Maintenance
Remember, once you’re ready to perform daily maintenance on your trades during the last 20–30 minutes of the trading day (1700 New York time), you’ll be presented with one of four options.
- Opening a trade.
- Closing a trade
- Maintaining a trade; i.e.
- Moving a stop loss level.
- Exiting a trade.
- Taking a pass (nothing to do).
Using It
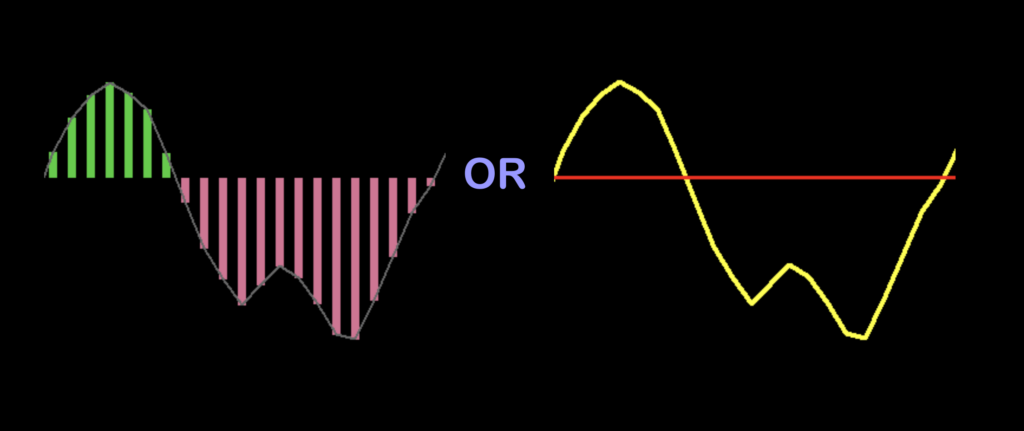
Using it is pretty straight forward, but there are a few intermediary things we wanted to communicate to you. First, you can use this indicator as a simple green/red histogram bar. Ignore the shades of green (we’ll address those later). You can also just use it as a zero cross by removing the colors and leaving the line created by the bars. Less noise on the chart.
Long: When the histogram bars turn green and/or the signal line is above the zero line.
Short: When the histogram bars turn red and/or the signa line is below the zero line.
Taking a Closer Look
If you look a little closer at the histogram bars, you’ll notice they’re not all the same as noted below.
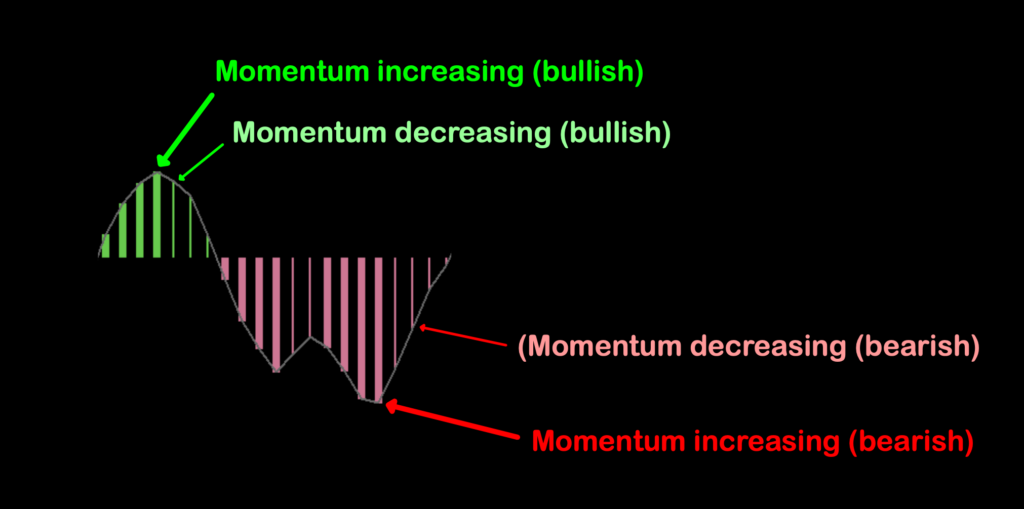
Those who consider themselves reversal, rather than trend traders may use these differentiated histogram bars to help them try and figure out when price is changing directions. As we are trend traders, we ignore those “signals” and focus on what is more definitive; red/green or above/below. If it makes it easier, consider changing the indicator to look like this.
Action Signals
Now that we’ve addressed the visuals, let’s take a look at the signals.
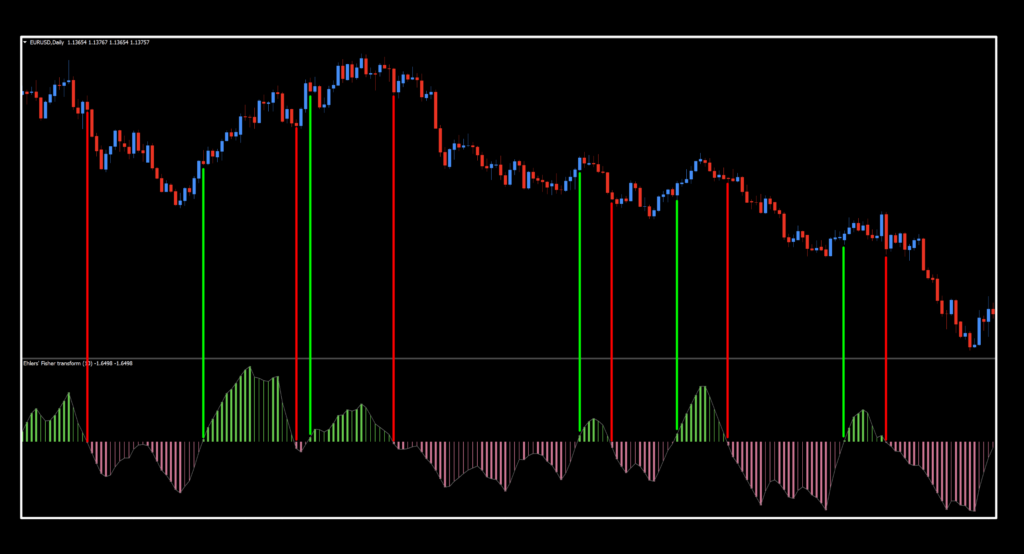
At first glance, the default settings did fine with the usual issues when the market ranged and that’s expected. Knowing that you’ll never use just one indicator to trade, many of those false starts would have been avoided.
Testing Particulars
Before we get into the testing metrics, we wanted to explain which buffer you’re going to use for testing. Looking at the data window for this indicator you’ll notice a few things.
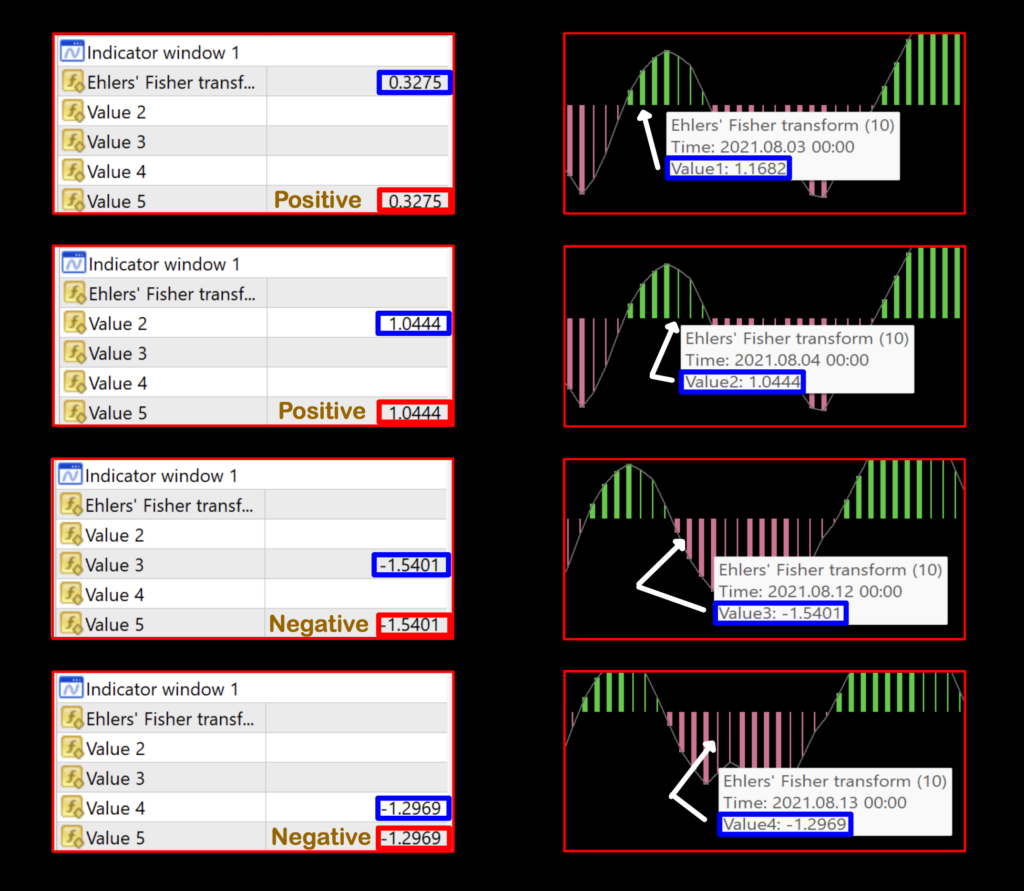
There are 5 buffer values;
- Value 1 (Ehlers’ Fisher transform) – Thick green line.
- Value 2 – Thin green line.
- Value 3 – Thick red line.
- Value 4 – Thin red line.
- Value 5 – Repeats values 1, 2, 3, or 4.
You’ll notice that the first two (green) are positive values. The second two (red) are negative values. This corresponds to their relation to the zero line. Positive if it’s above (green/long) and negative if it’s below (red/short). You only have to consider value #5 as the testing value necessary to generate your buy/sell signal data. So that testing string would be;
10,0;Ehlers Fisher transform;5;0
The Good Stuff
As we’ve not explained where we made our signal decisions, let’s take a gander at the results.




Wrap It Up
Except for SPX500 (which has always been a thing), the other three all started in the positive range on the default settings. That’s usually a good sign. Numbers were pretty solid overall, but we wanted to address the low signal numbers on the SPX500 by showing you a snippet of the chart.
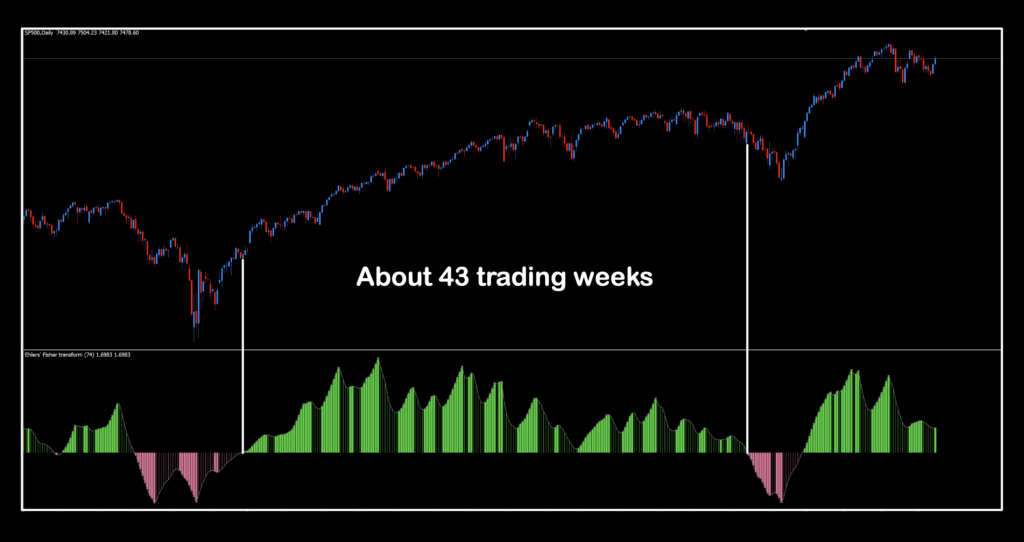
The big take away from this image is that there will be periods where the market will move and remain in a specific “state” for an extended period. Depending on your own algorithm, you could have been making money (or not) from this one trade for a long time – hence, reducing the number of individual trades. Food for thought.
Resources
This colorful indicator can be found in our indicator library for free, and it’ll be marked with “NEW” in red to help you locate it quickly. Be sure you’re subscribed to the Stonehill Forex YouTube channel, where we’ll show this pointy tool working over the last year’s data.
Don’t neglect the Advanced NNFX Course to help fast-track your trading education so you can shorten your learning curve to a fraction of what most traders must live through.
Our only goal is to make you a better trader.
*Our published testing results are based on the money management strategies employed by the NNFX system and depend on a variety of external factors that may differ between individuals and their specific broker conditions. No guarantees, trading recommendations, or other market suggestions are implied. Your results and subsequent trading activities remain solely your own responsibility.
BTW — Any information communicated by Stonehill Forex Limited is provided solely for educational purposes. The information contained in our courses, blogs, and on our website does not constitute investment advice or a general recommendation to invest. It is not intended to be, and should not be interpreted as, investment advice or a recommendation regarding any investment or trading activity. Any person who places trades, enters orders, or engages in any other form of trading or investment is solely responsible for their own investment decisions and does so at their own risk. Individuals should consult an independent financial adviser before making any investment decisions. Stonehill Forex Limited’s training courses, blogs, and other educational materials are provided for educational purposes only. Stonehill Forex Limited is not a financial advisory service and does not provide financial advice or make general investment recommendations.