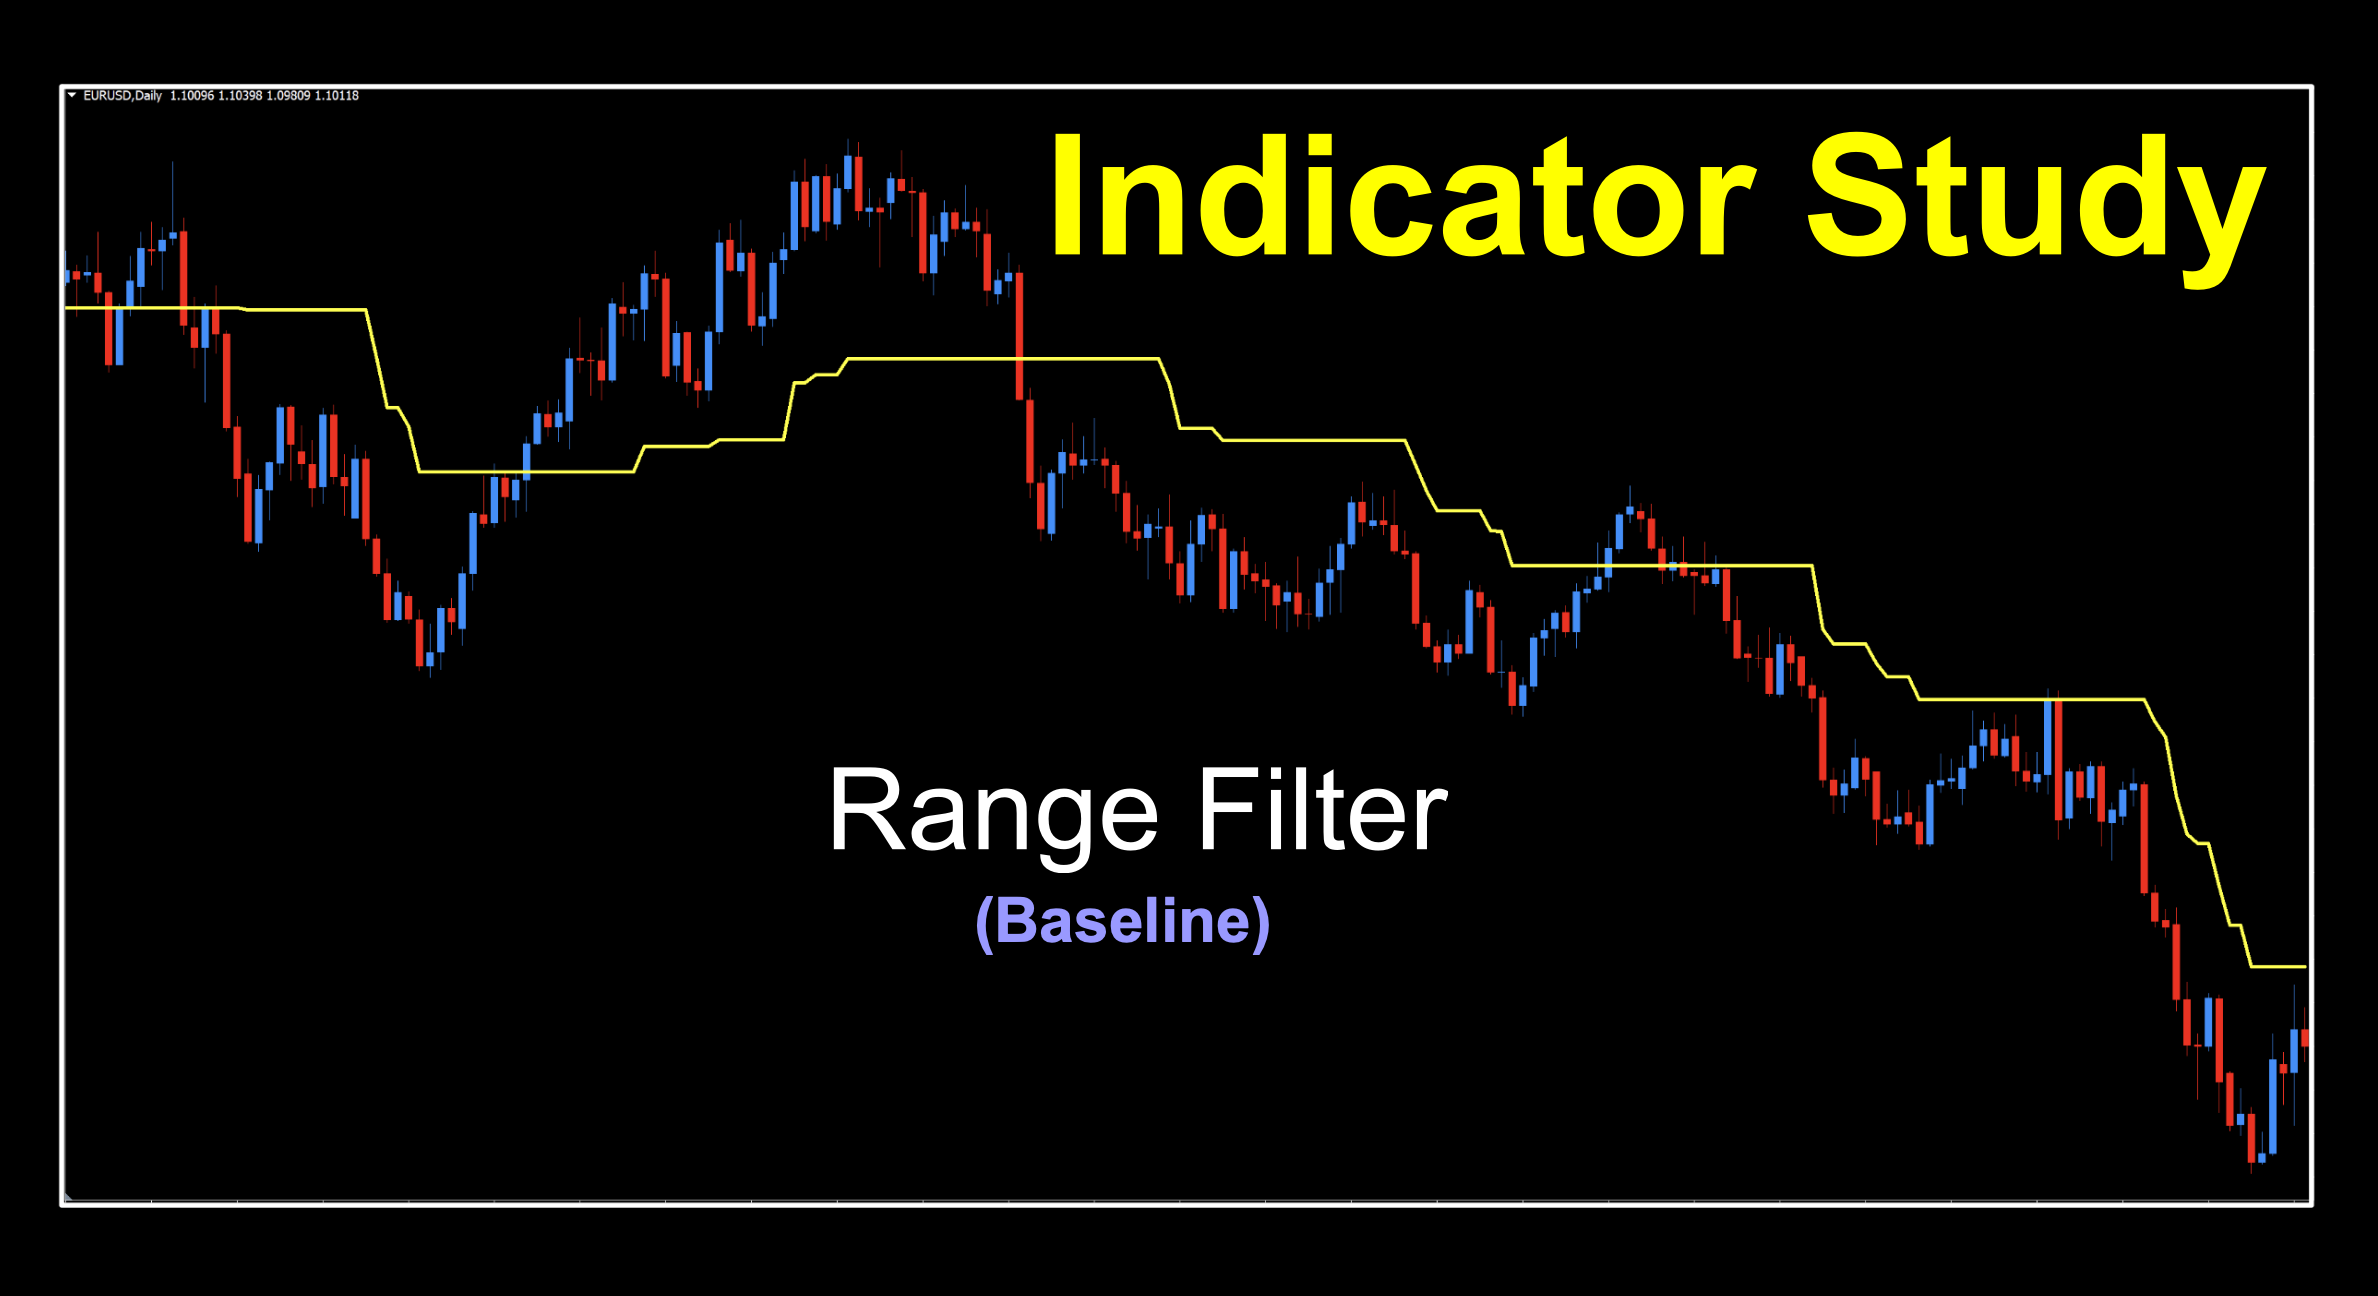
Range Filter
If you’d like to follow along with the e-book version of the blog, click on the play button in the audio player below (at the bottom of the page).
Home on the Range
Many of us would appreciate something to keep us in range of our goals. Fortunately, we’ve got such an animal this week. The interesting part is that it’s been modified to work better in markets other than Forex. We’ll explain what we mean further down. As a baseline, there’s not much to discuss, but it’s still fascinating that different baseline indicators provide alternate suggestions of when a trend appears to be forming. Let’s take a quick look into this week’s indicator, and you be the judge of it.
Pretty Awesome
There’s not a lot to the historical side of this indicator. It was developed by a guy named Mario Jemic and the indicator coded in 2023 by a prolific coder who can be found on various sites under the name of “Gehtsoft”. But the bonus part is that we had one of our own make some modifications to it, as it printed out a bit strange on non-Forex charts. We’ll get into what the indicator does and what the changes were before we get into the nuts and bolts.
Origins
The original coding displays multiple bands, similar to Bollinger Bands. However, the math is definitely not the same, so it looks different. We don’t use the upper and lower bands as they are suggestive of reversals, trailing stops and take profit levels; things we’ve already established via the NNFX way of trading.
Nuts, Washers & Bolts
Essentially, the signal line (center line) is calculated by adding and subtracting the pip range value multiplied by a multiplier. If the close of that period is within that range, it doesn’t affect it, otherwise it “updates” the signal line’s value to the high or low range. Now, we mentioned that it looked strange on non-forex pairs because of values, so our friend Niels went into the code and changed the pip values to an ATR based offset. The results are the same; however, it looks “correct” on XAU, BTC, and other pairs. Thanks, Niels!
The Vid on the Telly
We’ll plot this baseline indicator on our usual chart on the default settings, but we made a some small adjustments that we’ll discuss further down in the indicator’s mug shot. While we get that lined up, chill for a few minutes and watch the analysis video.
Wrap a Yellow Ribbon
As mentioned, default settings with just a few adjustments. The original indicator had two settings and printed three lines, as noted below. We changed the background to gray so you could see all three lines. Candles are blue/red per the norm with baselines so we can check our entry signals.
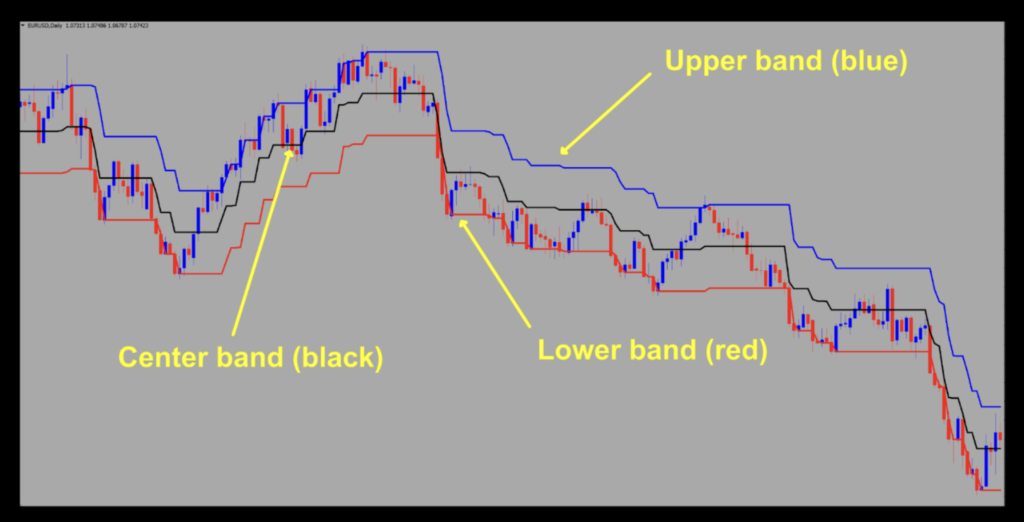
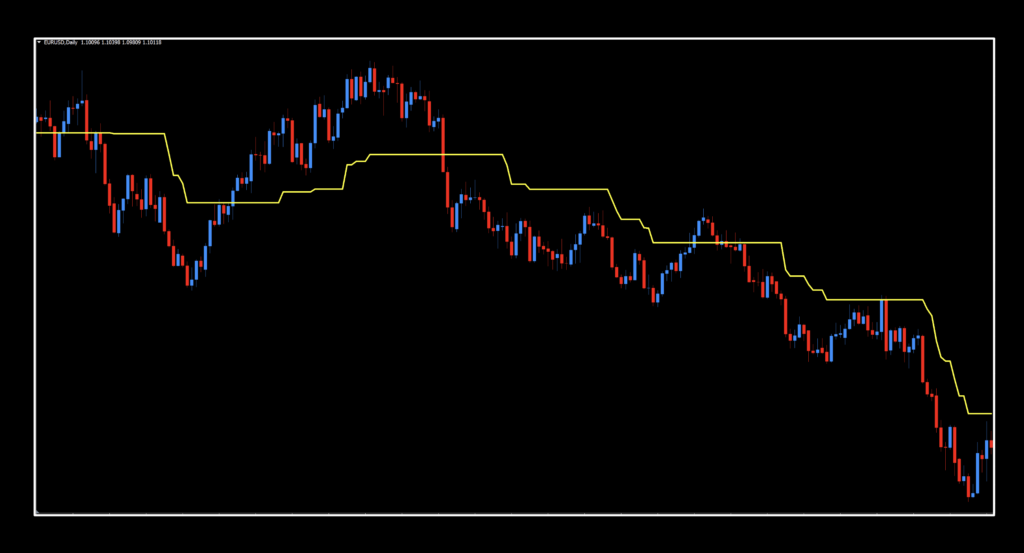
We’re only interested in the middle line, which is black – which we’ll change to yellow once we revert to the black background. The modified version, available in the on-line library, already has the upper and lower bands toggled to “false”, so you’ll be good to go…from the get go. The default Multiplier value is 1.3, but we’re going to change that to 3.0 for our signal identification purposes.
Settings
Below is the settings menu. As noted, there is only one setting we really need to concern ourselves with after making that minor signal line adjustment.
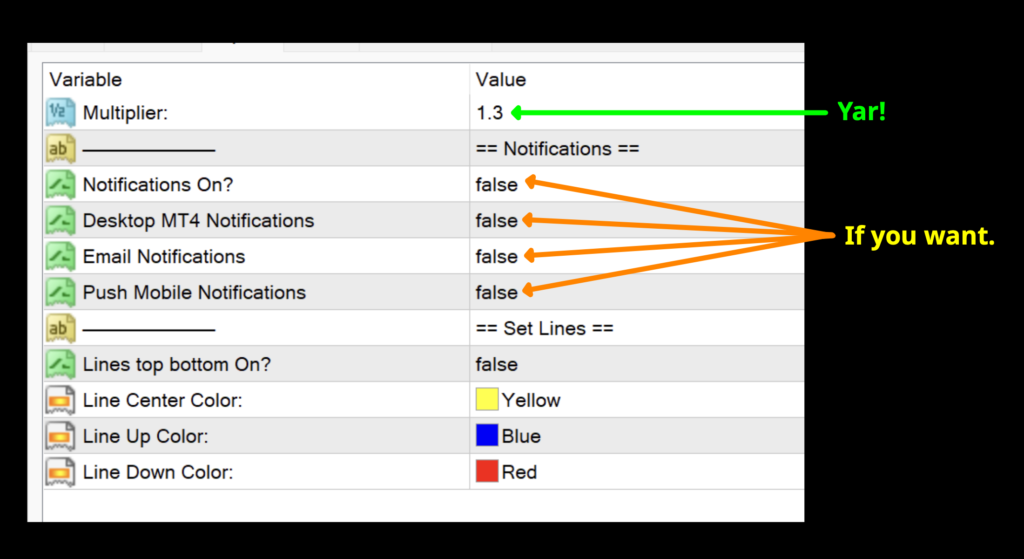
Multiplier: The main variable for the indicator. It has a fairly narrow effective range, so don’t get crazy with the Cheez Whiz. The default setting is 1.3.
Advantages
* Calls to ATR and volume.
* Simple to use and adjust.
* Signals are very clear.
How we use it.
One of three actions needs to happen in the last 30 minutes prior to the close of the trading day. They are; opening, maintaining, or closing a position. This is when you make your trading decisions, and not actually wait for the close at 1700 EST, because we trade on the daily time frame.
Long: When price crosses above the signal line. Entry is in the last 30 minutes of the trading day.
Short: When price crosses below the signal line. Entry is in the last 30 minutes of the trading day.
Simple Simon
Check out the clear signals on the alternative setting.
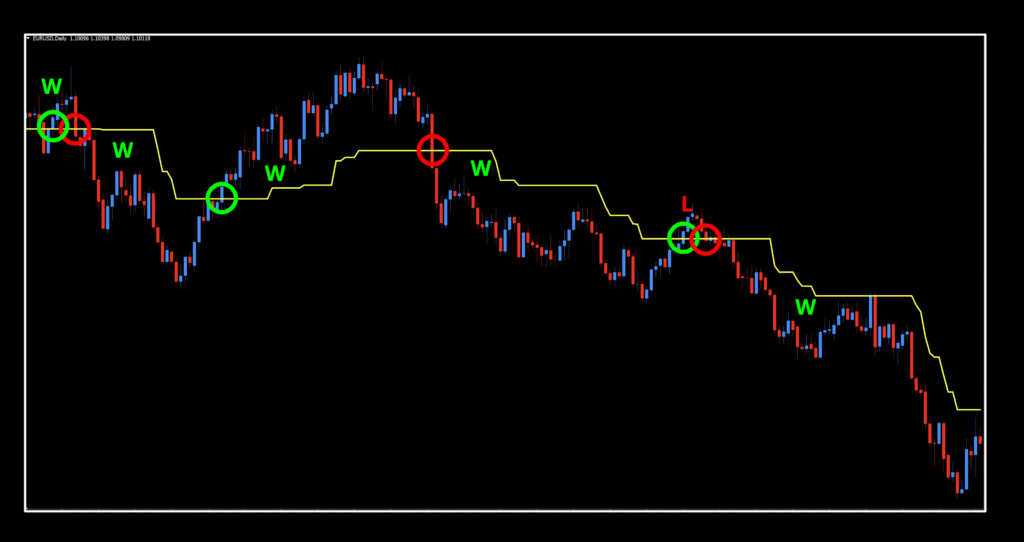
Pretty straight forward here. Don’t forget, we changed the multiplier to 3.0 for our illustrations, but of course we’re going to test it through a variety of settings, using 1.3 as the default value. There was a quick run up for a small win before that long move down. Naturally, you’re not using your baseline as an exit because you’d have given back some of those hard-earned profits and there are so many better indicators to use to close a trade. Then we’ve got the nice move up and followed with a good move to the south side before a small loser, although your algo probably would have kept you out. That last short trade would have been a nice way to round out profits for the beach trip you know you want to plan.
Working for Pipage
If you’re new to these studies, we recommend looking at some of the older blogs to understand how we conduct our testing. We’re going to be using our default numbers to start.
Numbers for the Masses
Below is the data from our testing.
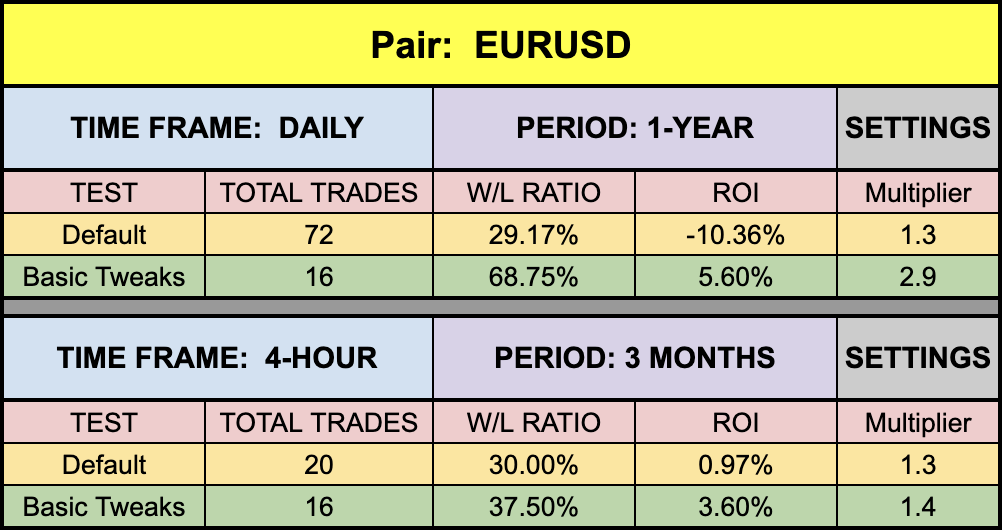
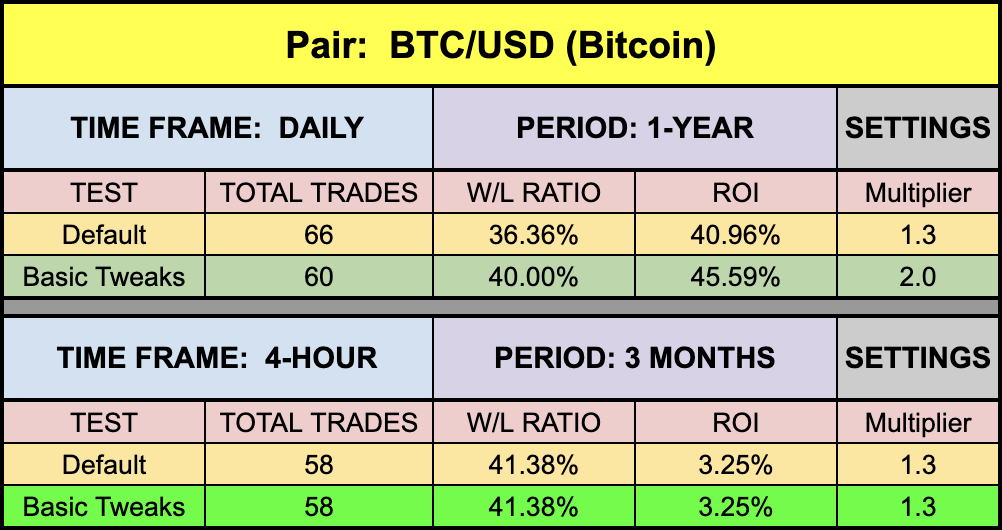
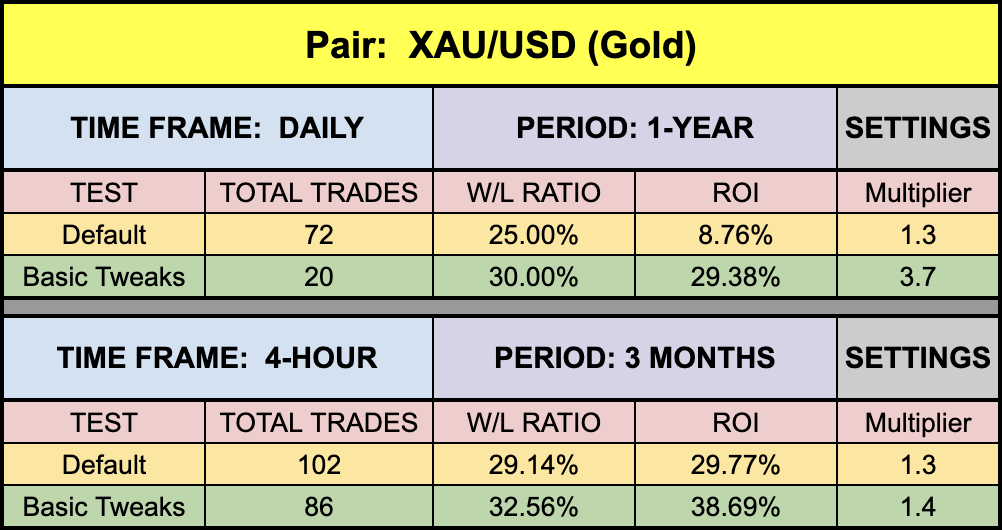
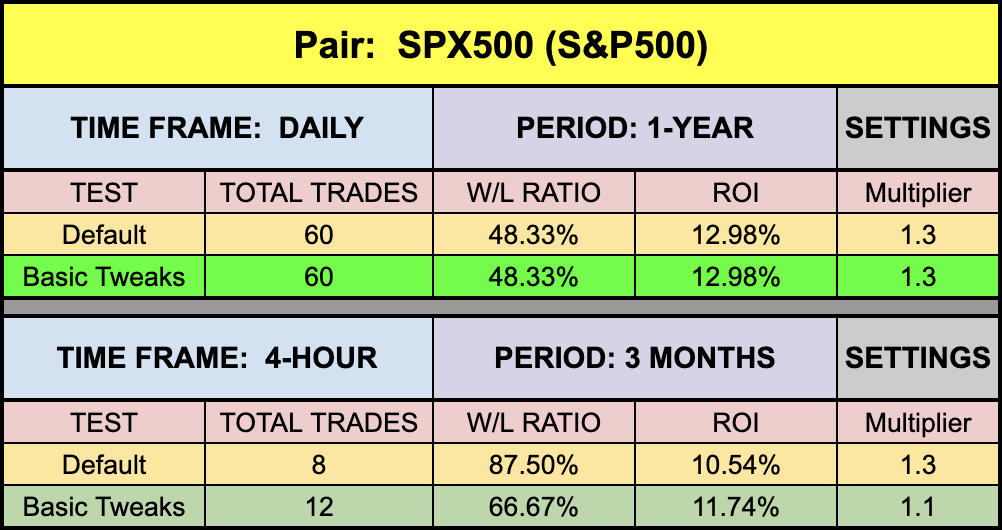
While the effective testing range of this indicator on its one setting made for quick analysis, the results are intriguing. The EUR was a bit soft; however, SPX came storming right out of the gate. In fact, on the daily chart, the default value returned the best numbers for the period we tested. XAU also had a strong start and came up with some really nice numbers, but the shining star of this week without a doubt was BTC on the daily. I mean, who doesn’t love those numbers on the default values. The 4-hour was much softer and, ironically, the default was the best we could find for that specific time span. Definitely one to consider for your trader’s toolbox.
Resources
We’ve made this indicator available for download on our site from the indicator library, for free! When you’re ready to get it, click HERE. For the advanced course, click HERE.
Our only goal is to make you a better trader.
BTW – Any information communicated by Stonehill Forex Limited is solely for educational purposes. The information contained within the courses and on the website neither constitutes investment advice nor a general recommendation on investments. It is not intended to be and should not be interpreted as investment advice or a general recommendation on investment. Any person who places trades, orders or makes other types of trades and investments etc. is responsible for their own investment decisions and does so at their own risk. It is recommended that any person taking investment decisions consults with an independent financial advisor. Stonehill Forex Limited training courses and blogs are for educational purposes only, not a financial advisory service, and does not give financial advice or make general recommendations on investment.