If you’d like to follow along with the e-book version of the blog, click on the play button in the audio player below (at the bottom of the page).
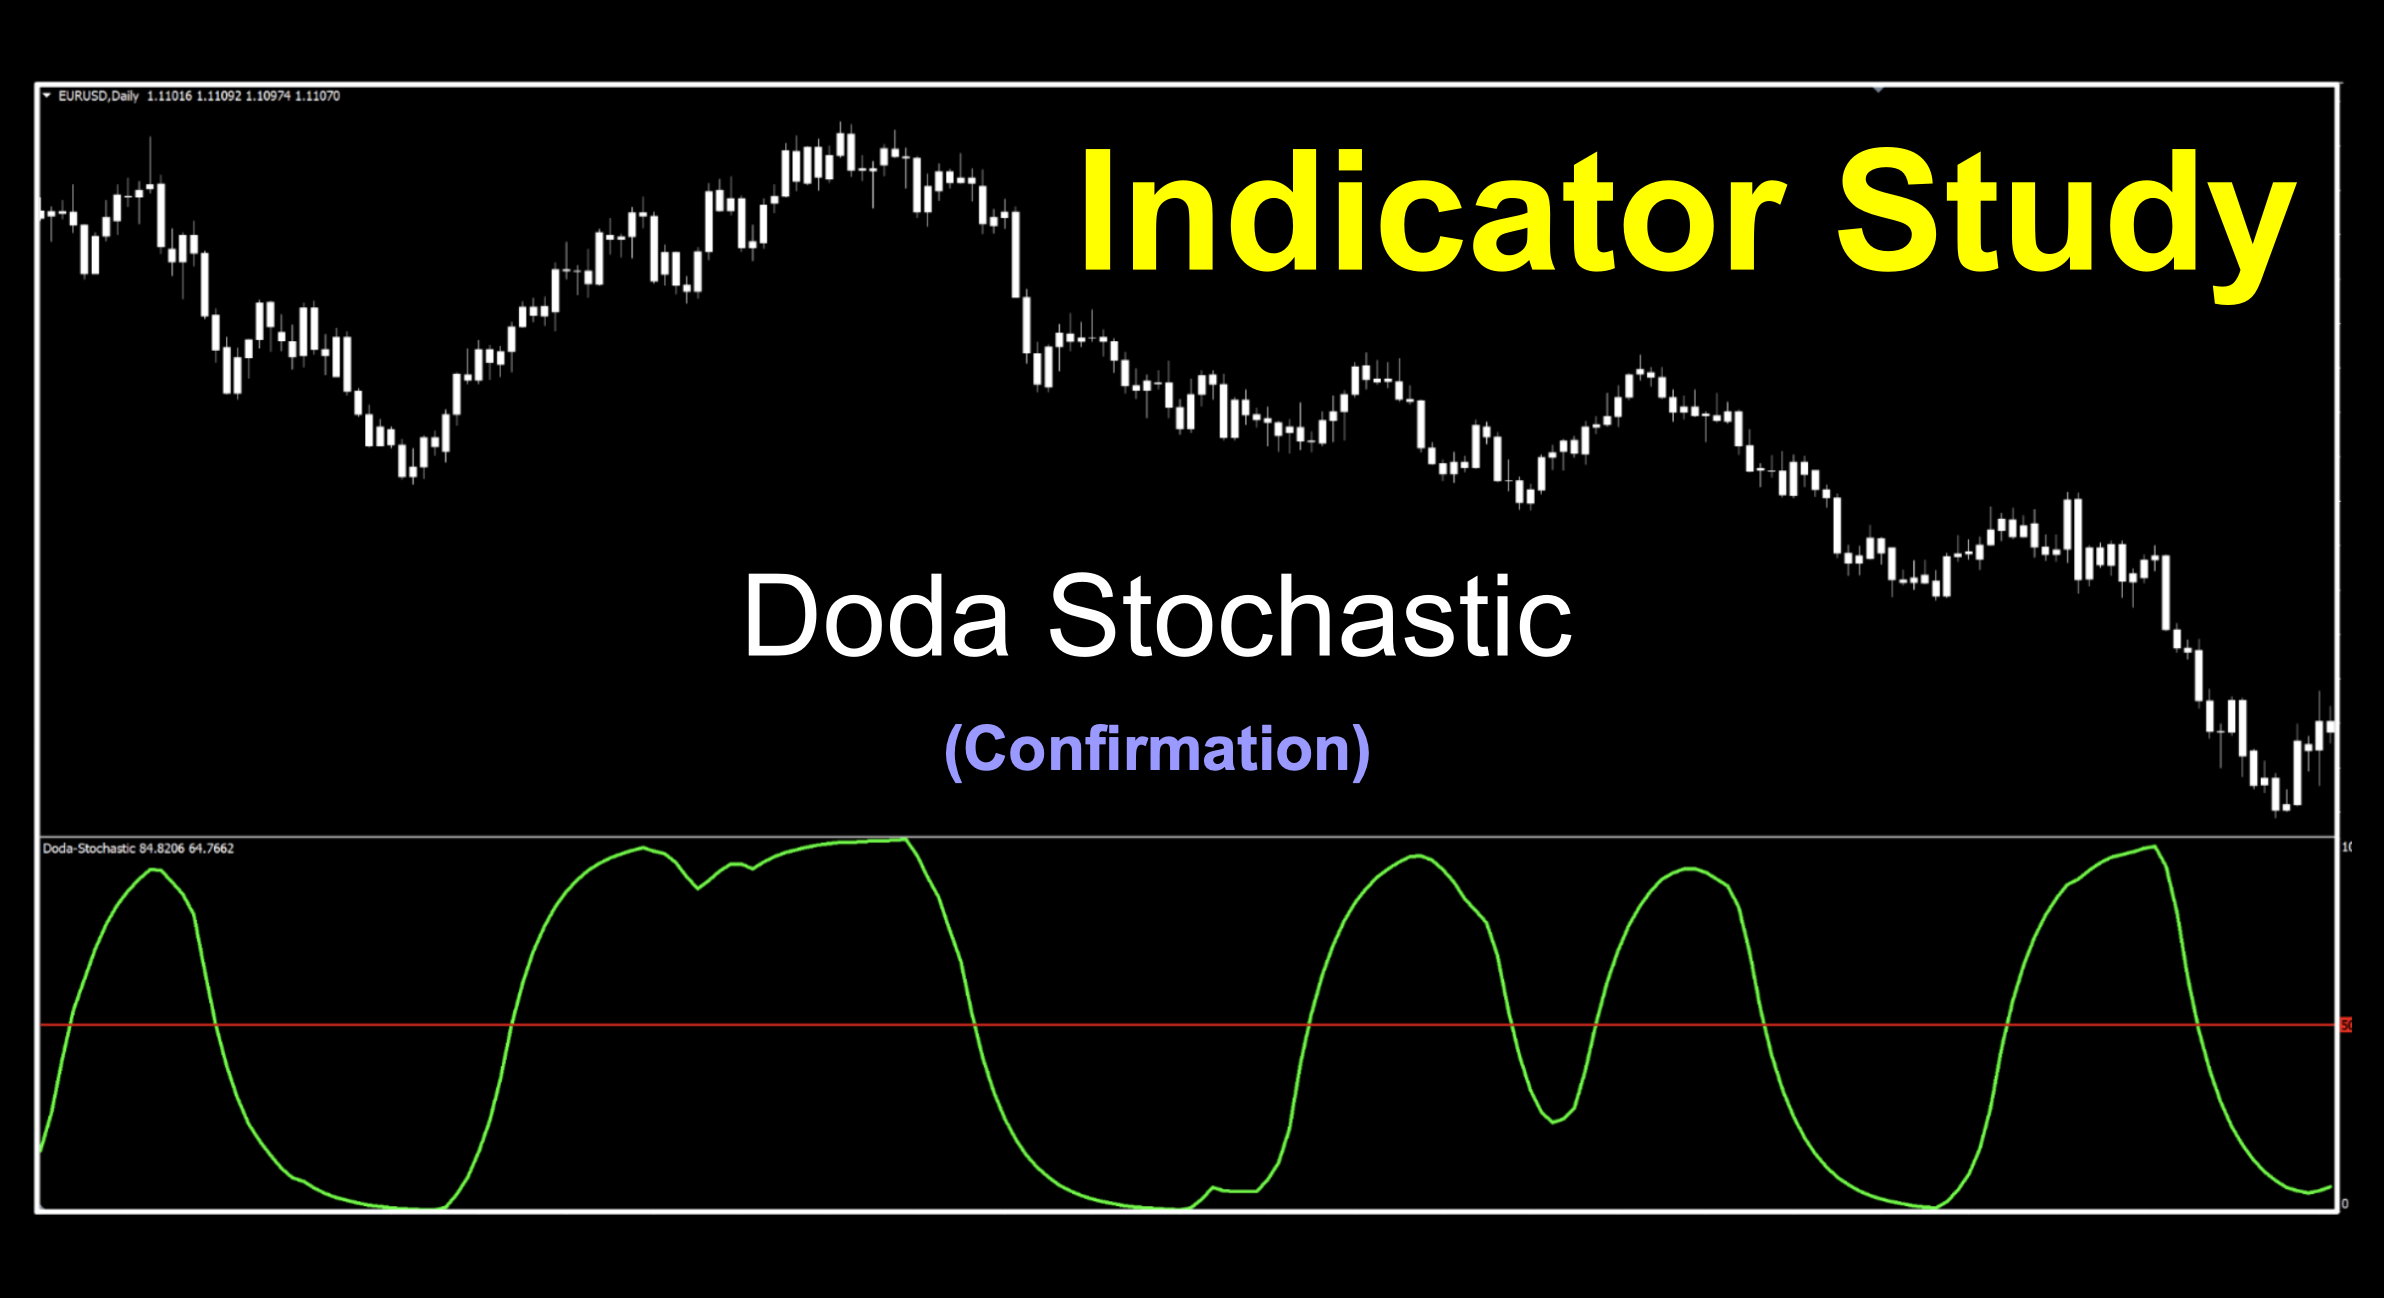
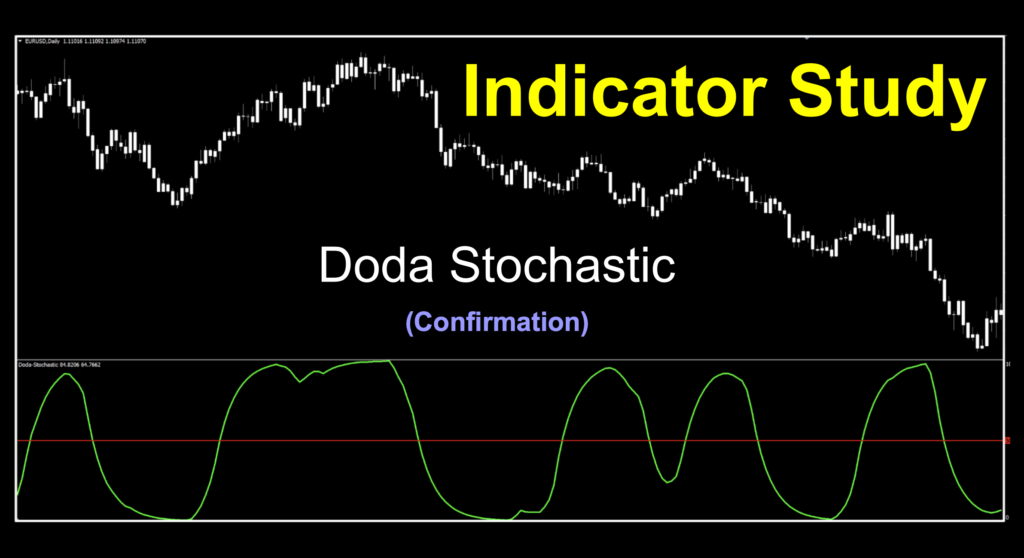
Doda Stochastic
What’s in a Name?
Branding, or name recognition, is of utmost importance. Think of a product or service name, and you’ll naturally assign a degree of value to it. Rolls-Royce, Cartier, Wagyu, or perhaps a 2002 bottle of George T. Stagg Bourbon. It also goes the other way as well. Crystal Pepsi, Clairol Touch of Yogurt Shampoo (not kidding), MD 20/20…you get the idea. When we first came across this indicator, we thought, “Meh, same old thing.” When we actually looked at it, we then thought, “Hmm, maybe not.” Intrigued?
Not Your Father’s Indicator
Okay, so we’ll dive right in. Recall that there was a well known indicator developed nearly seven (that’s 7) decades ago called the “Stochastic Oscillator.” It’s on our list. The dirty dozen list, so you know it’s not something that we advocate using. But, we came across a modern version – a much smoother version, we thought might make for a good indicator to profile. We’re not going to use it the way the author suggested, but that’s par for the course, knowing us.
Smile For The Camera
Okay then, we’ll be using the stock settings, albeit with the small changes we made to the signal lines and adding that mid-line for our signals. So, if you’re fortunate enough to have a spare bottle of that George T Stagg hanging around, pour yourself a finger or two, sit back and take it all in. We’ll be right here when you come back.
Not Your Grandfathers Indicator Either
We looked up the meaning of the word “doda” and came up with a couple of definitions. It means “well-loved,” possibly derived from the Polish word “dodek,” meaning “grandfather.” Anyway, this indicator is called the Doda Stochastic and was coded in 2020. We’ll put up a comparative chart of the original version because visuals always make for quicker comprehension. Naturally, we won’t be using it as a two-lines cross, an overbought/oversold indicator, or even a reversal indicator. We won’t even consider using it as a divergence indicator, so just roll with us. We just trade what we see. Right?
Do You Compute?
Cool story, bro. How does it work? It just happens that we can tell you, but we’re pretty sure you’ll appreciate your handy, dandy computer crunching all those numbers rather than old school with paper. And then, having to pencil plot the signal lines by hand as they did in the 1950s. There are three main steps in the calculation of the signal lines:
1. Close value is filtered with an EMA (Exponential Moving Average).
2. Then, it takes the filtered close value and applies the Stochastic calculation with all the relevant historical values.
3. And finally, the final value is filtered for one signal line, while another EMA is used for the second signal line.
Mr. Fixit
We also felt it was important to mention that while this indicator printed correctly on the charts, we had some difficulty testing it due to internal code kicking back a “divide by zero” error. So bummed. That being the case, we contacted our go-to guy, Niels, and he got things straightened out, so the version you’ll find in the library is a modified version, unlike any of the less functional versions found elsewhere. Our collective hats are tipped in your direction, sir!
Polished
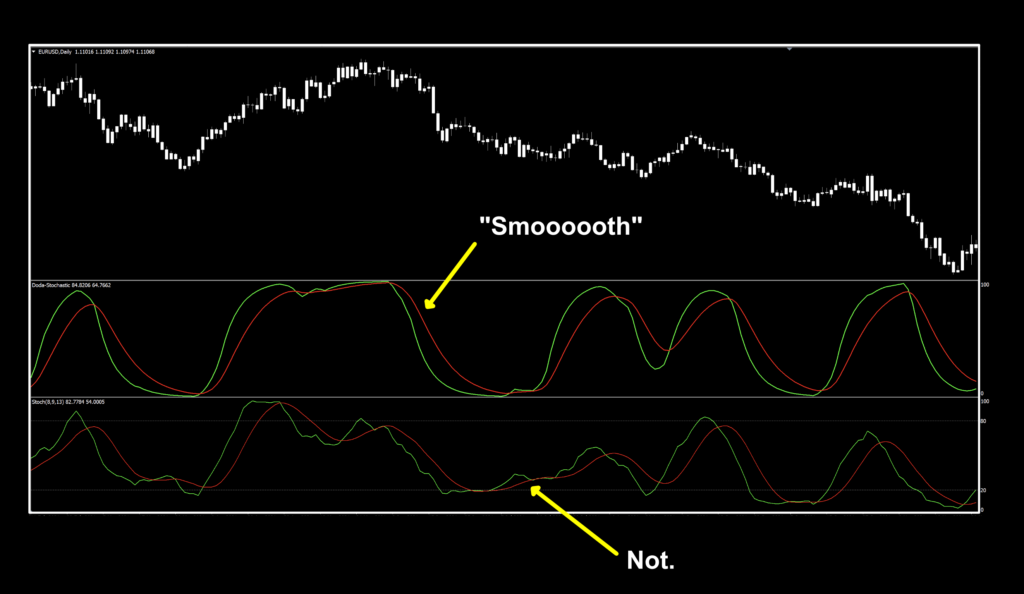
Not to be confused by those from Poland (🇵🇱), but rather high luster, smooth, and trouble-free. We’ll show you this indicator compared to a standard Stochastic oscillator, so you’ll see for yourself. Then we’ll also demonstrate why we’re using it as a mid-line cross and nothing else. We changed the default colors from blue/tomato (yes, that’s a color choice) to lime/red and thickened them up a bit. We left the default settings as well.
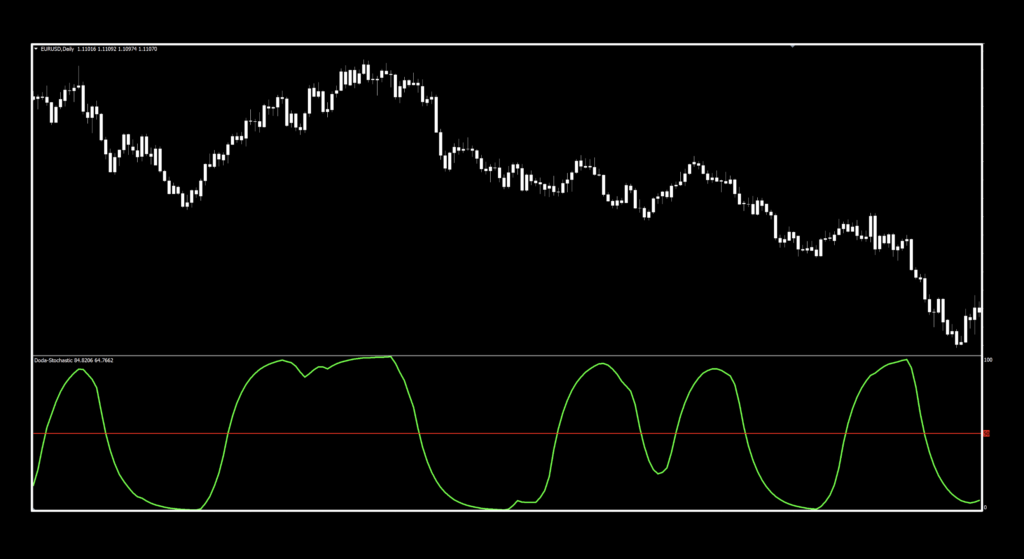
Now, a couple of small changes are in order. We’re only going to use the green line and add a mid-line to make it more NNFX friendly. Here’s what the finished product looks like.
Now, isn’t this just much easier to use? Yep, we think so too. Now, we’ll take a quick peek at the settings before dipping our toes into the testing pool.
Settings
There are four settings, of which we use three. The last one is the number of bars (periods) the indicator “looks back” for calculating and plotting purposes, and 2000 is more than adequate. That equates to just under eight years on the daily chart. Plenty of history for the history buff.
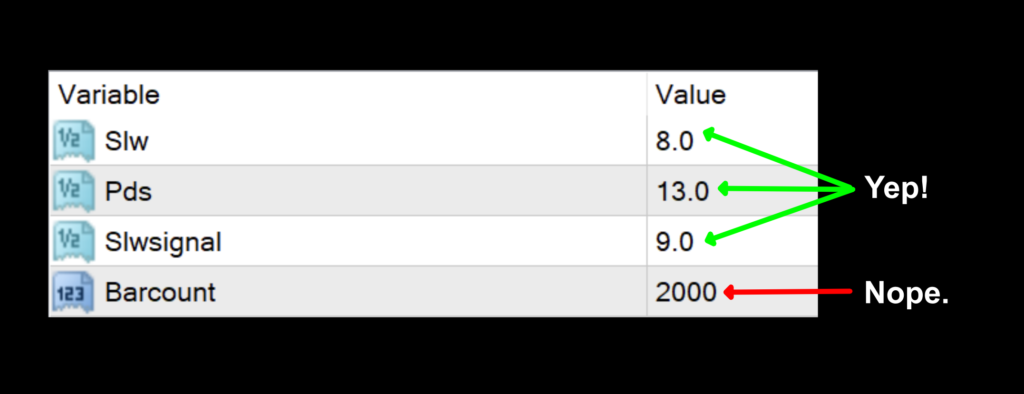
Slw: The first comparative value. The default value is 8.0
Pds: Number of periods for internal calculations. The default value is 13.0.
Slwsignal: The second comparative value. The default value is 9.0.
Advantages
* Based on an indicator with a lot of history.
* Much smoother.
* Signals are easier to decipher.
How we use it.
One of three actions need to happen in the last 30 minutes prior to the close of the trading day. They are; opening, maintaining, or closing, a position. This is when you make your trading decisions, and not actually wait for the close at 1700 EST, because we trade on the daily time frame.
Long: When price crosses above the mid-line. Entry is in the last 30 minutes of the trading day.
Short: When price crosses below the mid-line. Entry is in the last 30 minutes of the trading day.
Pips, Oh My!
Below is the chart with just a single smooth (and friendly) signal line.
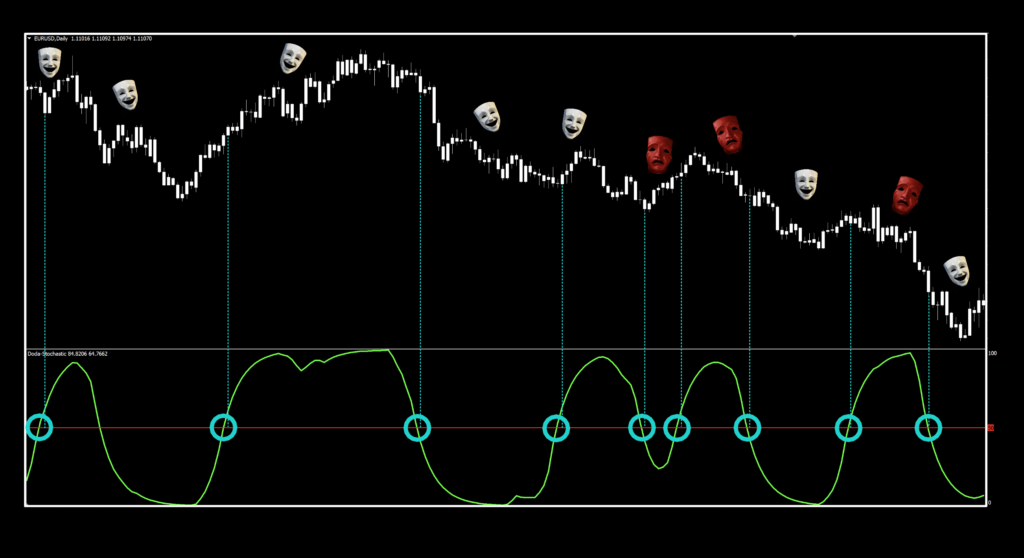
Overall, not too bad. And that’s on the default settings. There were a couple of areas where the indicator was a bit slow with regard to price reaction, but hey, we can usually expect that. It might make for a good C2 as part of your award-winning algorithm. I’d buy that for a dollar. But, you don’t have to.
Pips on the Range
If you’re new to these studies, we recommend looking at some older blogs to understand how we conduct our testing. We’re going to be using our alternative numbers.
Data For Thee
Below is the data from our testing.
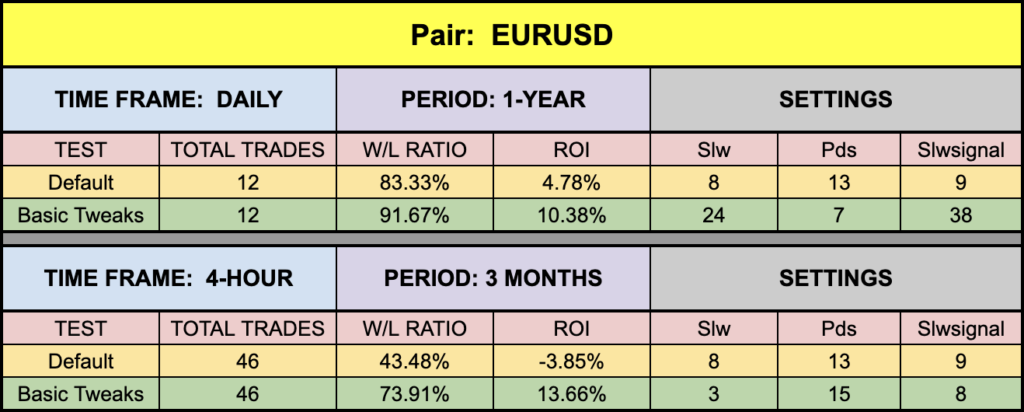
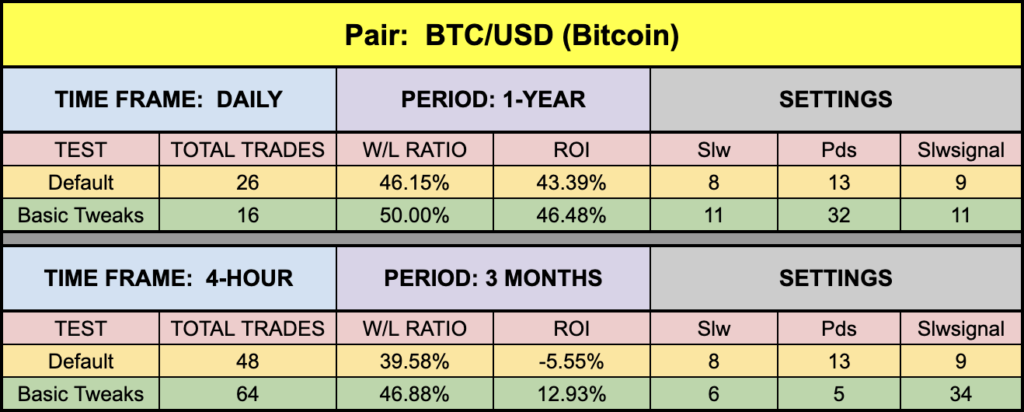
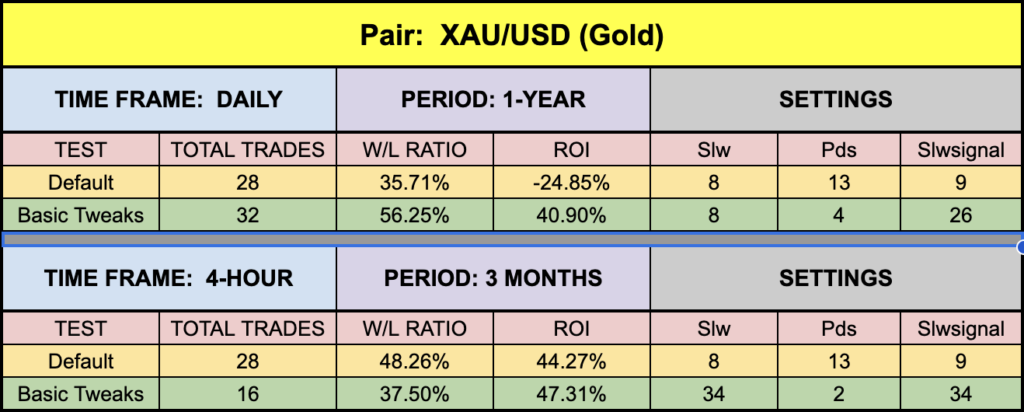
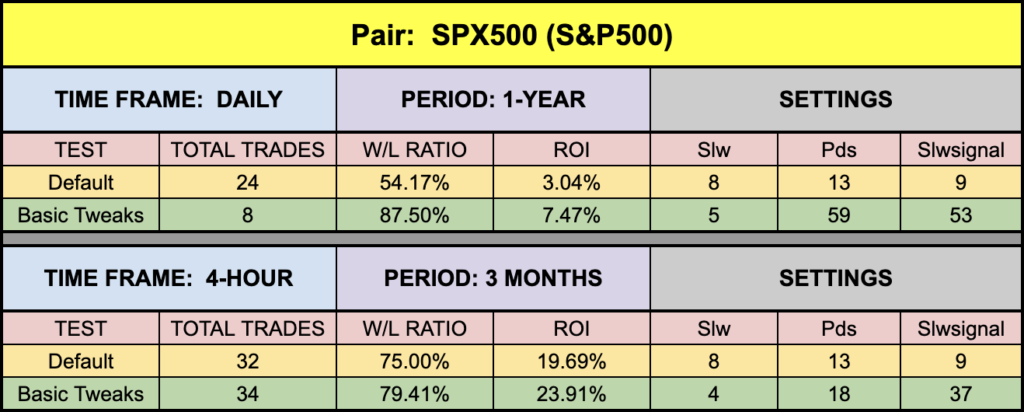
This was solid all the way through. We even had some fantastic default numbers. The EUR tuned up nicely, although the SPX was still a little soft, but not altogether awful. If you’re a 4-hour swing trader, then SPX is certainly a darling for you. BTC and XAU were off the hook, as they currently are due to the recent price action, so while they are not surprising, it does give you the warm & fuzzies. Who says you can’t dust off the old and breathe a little life into it? Grab it, test it, and make some pips from it!
Resources
We’ve made this indicator available for download on our site from the indicator library, for free! When you’re ready to get it, click HERE. For the advanced course, click HERE.
Our only goal is to make you a better trader.
BTW – Any information communicated by Stonehill Forex Limited is solely for educational purposes. The information contained within the courses and on the website neither constitutes investment advice nor a general recommendation on investments. It is not intended to be and should not be interpreted as investment advice or a general recommendation on investment. Any person who places trades, orders or makes other types of trades and investments etc. is responsible for their own investment decisions and does so at their own risk. It is recommended that any person taking investment decisions consults with an independent financial advisor. Stonehill Forex Limited training courses and blogs are for educational purposes only, not a financial advisory service, and does not give financial advice or make general recommendations on investment.