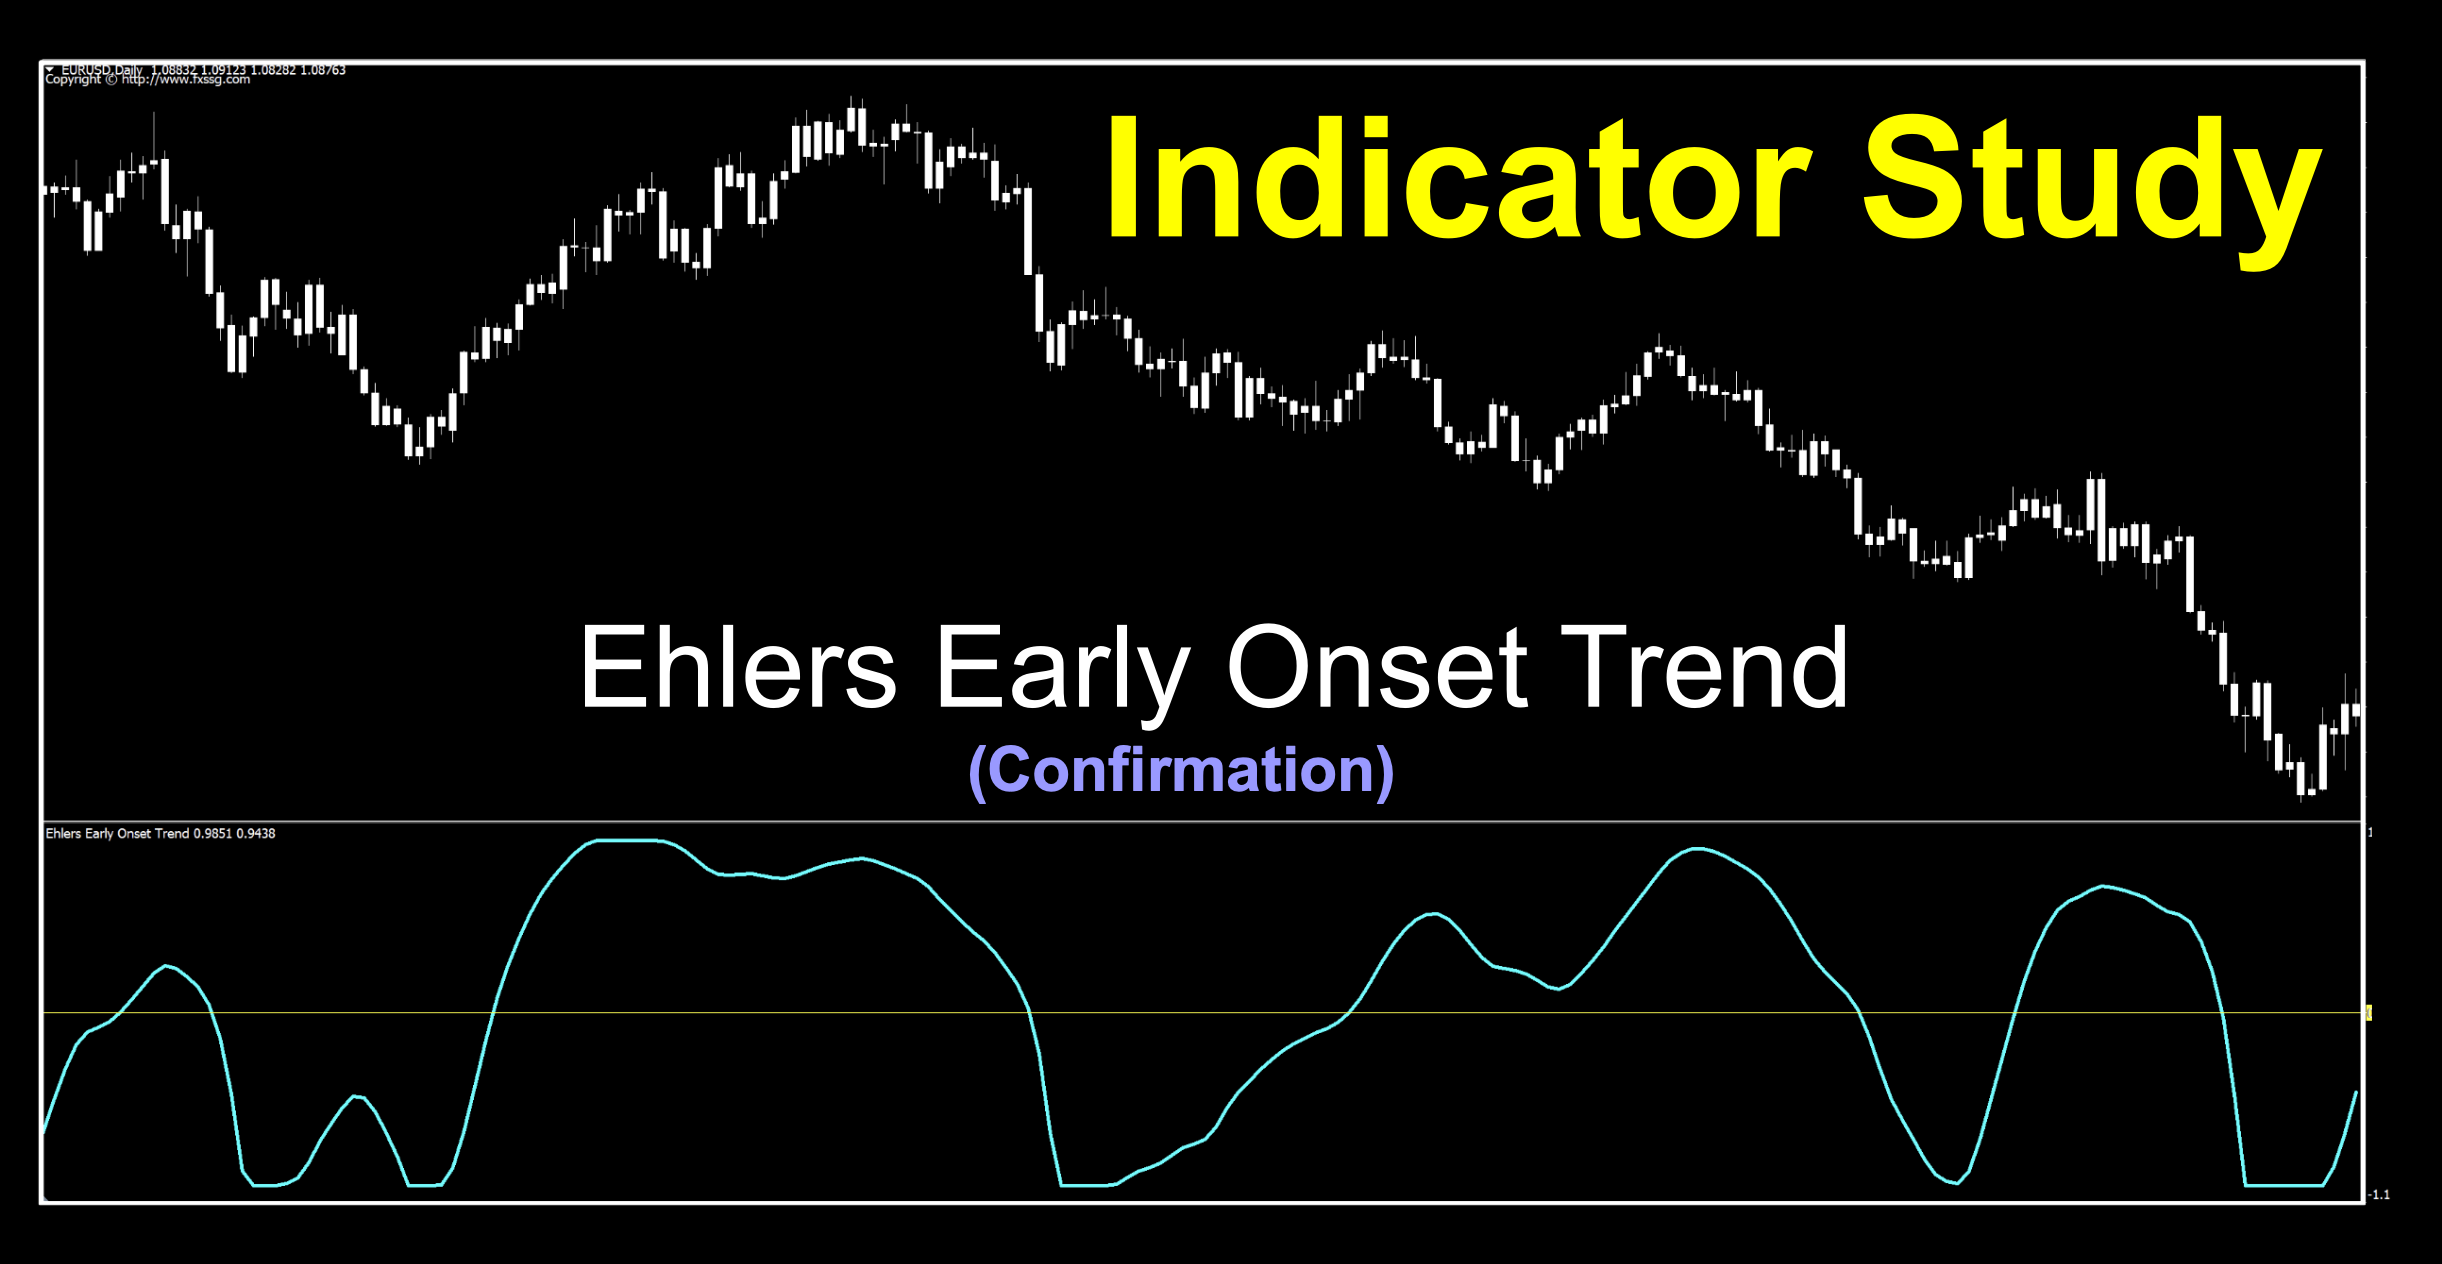
Ehlers Early Onset Trend
If you’d like to follow along with the e-book version of the blog, click on the play button in the audio player below (at the bottom of the page).

Early Helps
Being early to anything is generally a good thing. “Early bird gets the worm”, “early to bed, early to rise, makes a man healthy, wealthy, and wise”. You get the drift. Granted, early isn’t the end all be all. Ever show up to a party early? Awkward, right? But in trading early is helpful. Indicators try and give us early warning when a trend has started. Some do it better than others. Some totally suck at it. Those are the ones we either steer clear of, or try to see about making them better. We found one with early in the title, and that got us interested. Let’s go find out how early.
Simplification Can Be Better
When we first looked at this indicator, we read on more than one way to use it. Some of it was a bit confusing. If you’re a purist, you can certainly try using it that way, but we aim for simple. That gave rise to how we were going to discuss this indicator. We’ll go through the motions, but we’ll keep it on the simple side, a departure from what you may read elsewhere.
Our Hero Strikes Again
As you probably know, we tend to lean into indicators from those we know who came up with the ideas. They’re usually dedicated to the craft and generally pretty smart cookies. This one is no different. Our named hero is none other than John Ehlers, and he came up with something called the Ehlers Early Onset Trend indicator in 2014 in an article called “The Quotient Transform” which was coded for us MT4 people in 2020.
What’s It All About
This indicator was all about reducing lag by creating something that would hopefully detect the onset of a trend earlier. The components include his Super Smoother Filter and Roofing Filter – but expanded further for this indicator. The premise was to eliminate cyclic components of periods longer than a specified amount, as he considered those “spectral dilation”…meaning that longer periods have proportionally larger amplitude swings (higher waves). Then, data is further filtered to reduce market noise.
Nice Wavy Line
Let’s see what Mr. Ehlers has for us by way of watching it in action. We made some changes to the indicator’s appearance for our purposes, which is pretty much status quo around here. So settle back and let’s watch it trace a pretty line on the chart.
We’re Making Changes
When we looked at the original version, we decided to make some changes. We’ll post the original version just so you see how it looks, then the changes we made. It’s nothing major. We removed a line, changed a color, and added a zero line. You can do less. As we always do with below chart zero line confirmation indicators, we’ll just keep those candles an unobtrusive white.
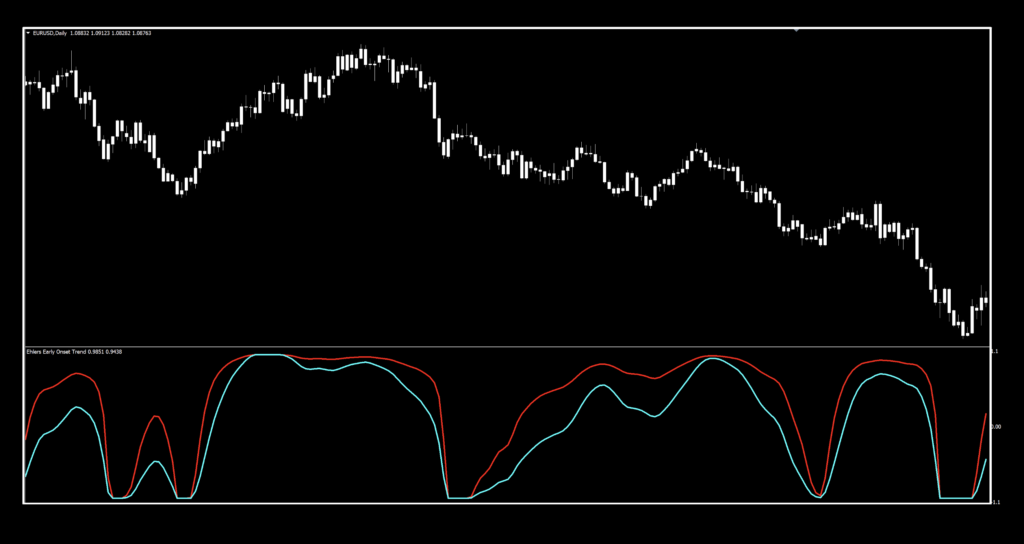
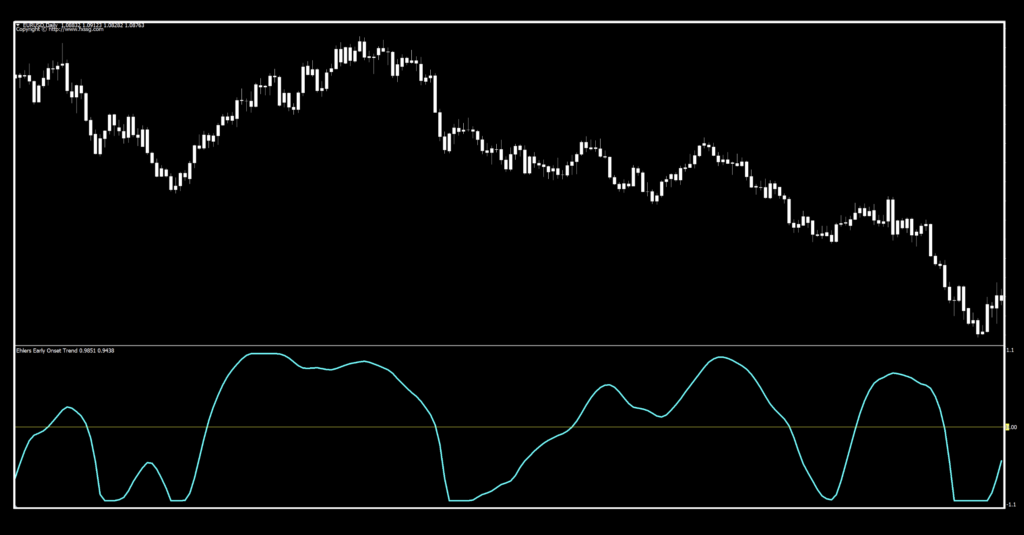
We’re not going to get into the different ways to use this indicator. You can look that up yourselves. What we’re going to do is remove the red signal line and use only the blue signal line for trade signals. We’re also going to add that zero line because it provides a definitive place to take the trade. Alternative methodologies use other ways, which we found to be somewhat subjective. Now our chart looks like this.
Settings
There are three settings, but we’re going to ignore one of them.
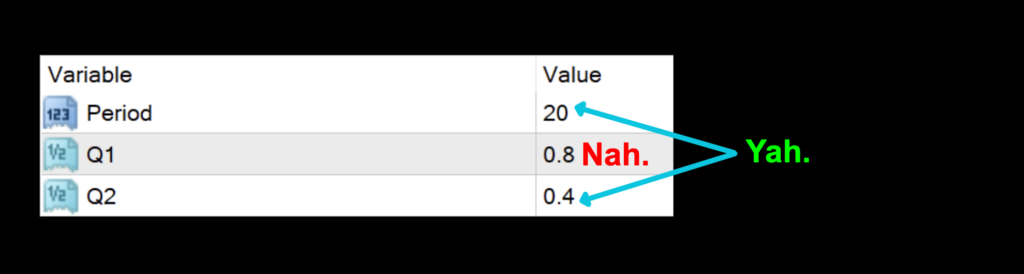
Period: Specifies the number of periods used for all the necessary calculations. The default value is 20.
Q2: The filtering value for the signal line. The default value is 0.4.
Advantages
* Another gift from one of our heroes.
* Relatively easy to test.
* Signals are definitive.
How we use it.
To clarify specific concepts relating to the NNFX system. There are three possible trade actions;
OPENING A TRADE
CLOSING A TRADE
MAINTAINING A TRADE
One of these three actions needs to happen in the last 30 minutes prior to the close. This is when you make your trading decisions, and not actually wait for the close at 1700 EST, because we trade on the daily time frame.
Long signal: When the signal line crosses above the zero line. Entry is in the last 30 minutes of the trading day.
Short signal: When the signal line crosses below the zero line. Entry is in the last 30 minutes of the trading day.
Easy On The Eyes
Once we made the changes, it became much easier to discern the signals. We’re using the default values as a starting point for our investigative work.
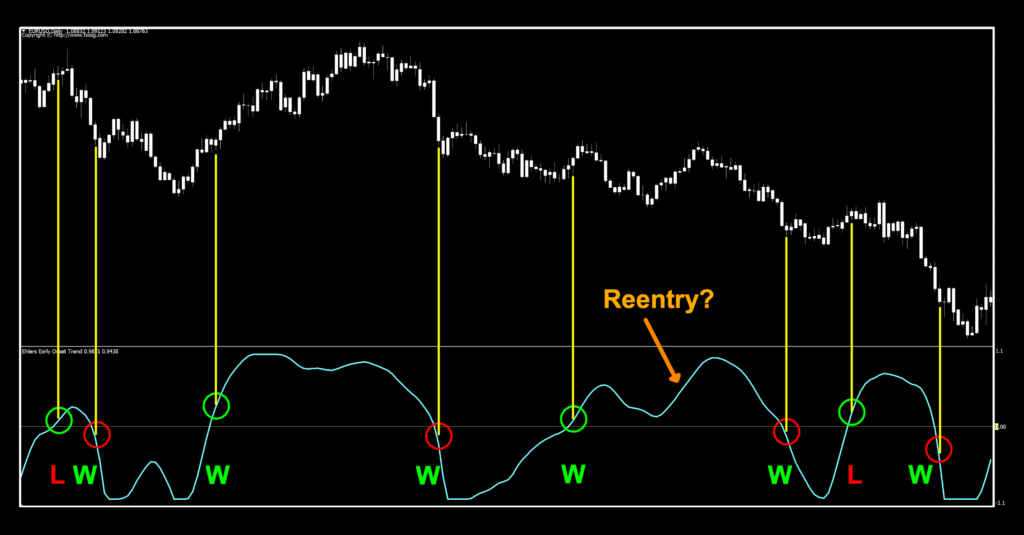
Alrighty, let’s see what we have. Overall, not too bad on the entries. It has possibilities. Signals are a bit late on the default settings, but we’ll work on that. There was one area where we wrote “Reentry?”. That would indicate a possible continuation trade based on the rest of your algorithm, as the indicator did remain above the zero line. Naturally, we won’t consider that a win or loss because we’re just looking at this indicator on its own. As a final note, when we tested both of the signal lines independently, the one we chose did do better overall, but hey, you do you, boo.
Testing Mania
If you’re new to these studies, we recommend looking at some of the older blogs to understand how we conduct our testing.
Results To Think On
Below is the data from our testing.
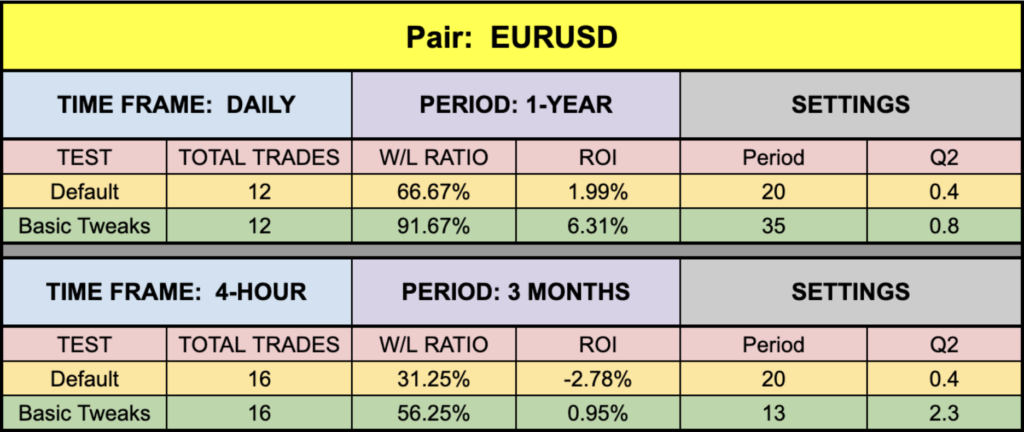
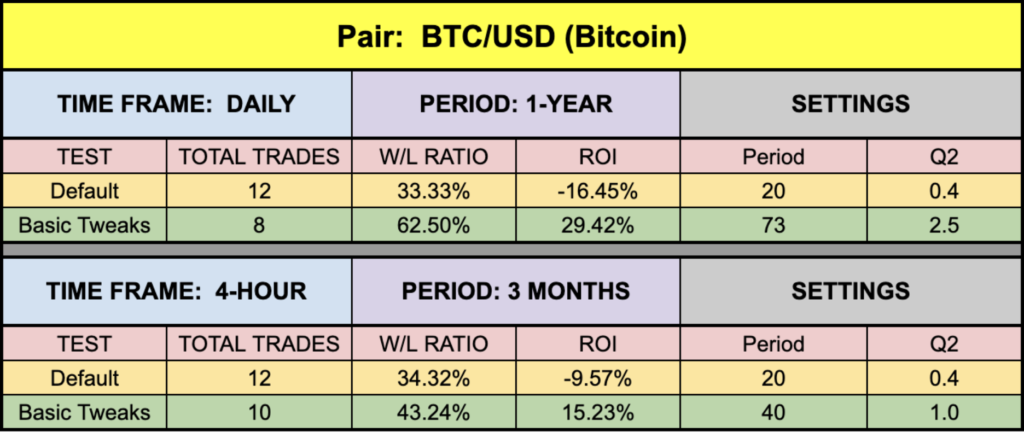

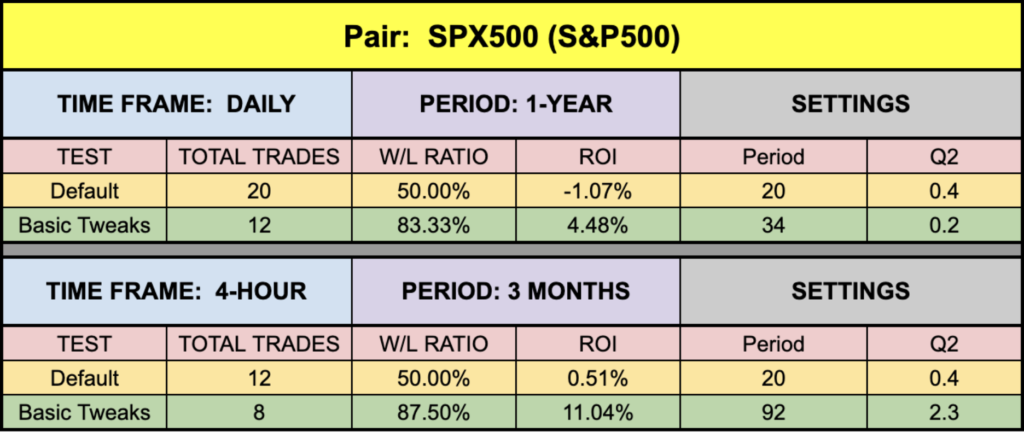
Once again, the default ROI values aren’t too terrible, as we’ve seen in the past. 4-hour gold posted an impressive start using the default values, if that’s your market and time frame for trading. Numbers have been better on the EUR and SPX500, but not everybody trades that market, so don’t base your decisions strictly on that. Remember, we’re just demonstrating that it can be made better. BTC was hot to trot, as was daily gold, but that’s no surprise at the moment. Go get this one and have some fun with it. Who knows, it might find a place in your trader’s toolbox.
Do It
Don’t forget the survey on the Stonehill Forex home page. We published the current data in the digest a few days ago. We’d like additional data for the next digest. It takes less than 5 minutes.
Resources
We’ve made the Ehlers Early Onset Trend indicator available for download on our site from the indicator library, for free! When you’re ready to get it, click HERE.
Our only goal is to make you a better trader.
BTW – Any information communicated by Stonehill Forex Limited is solely for educational purposes. The information contained within the courses and on the website neither constitutes investment advice nor a general recommendation on investments. It is not intended to be and should not be interpreted as investment advice or a general recommendation on investment. Any person who places trades, orders or makes other types of trades and investments etc. is responsible for their own investment decisions and does so at their own risk. It is recommended that any person taking investment decisions consults with an independent financial advisor. Stonehill Forex Limited training courses and blogs are for educational purposes only, not a financial advisory service, and does not give financial advice or make general recommendations on investment.