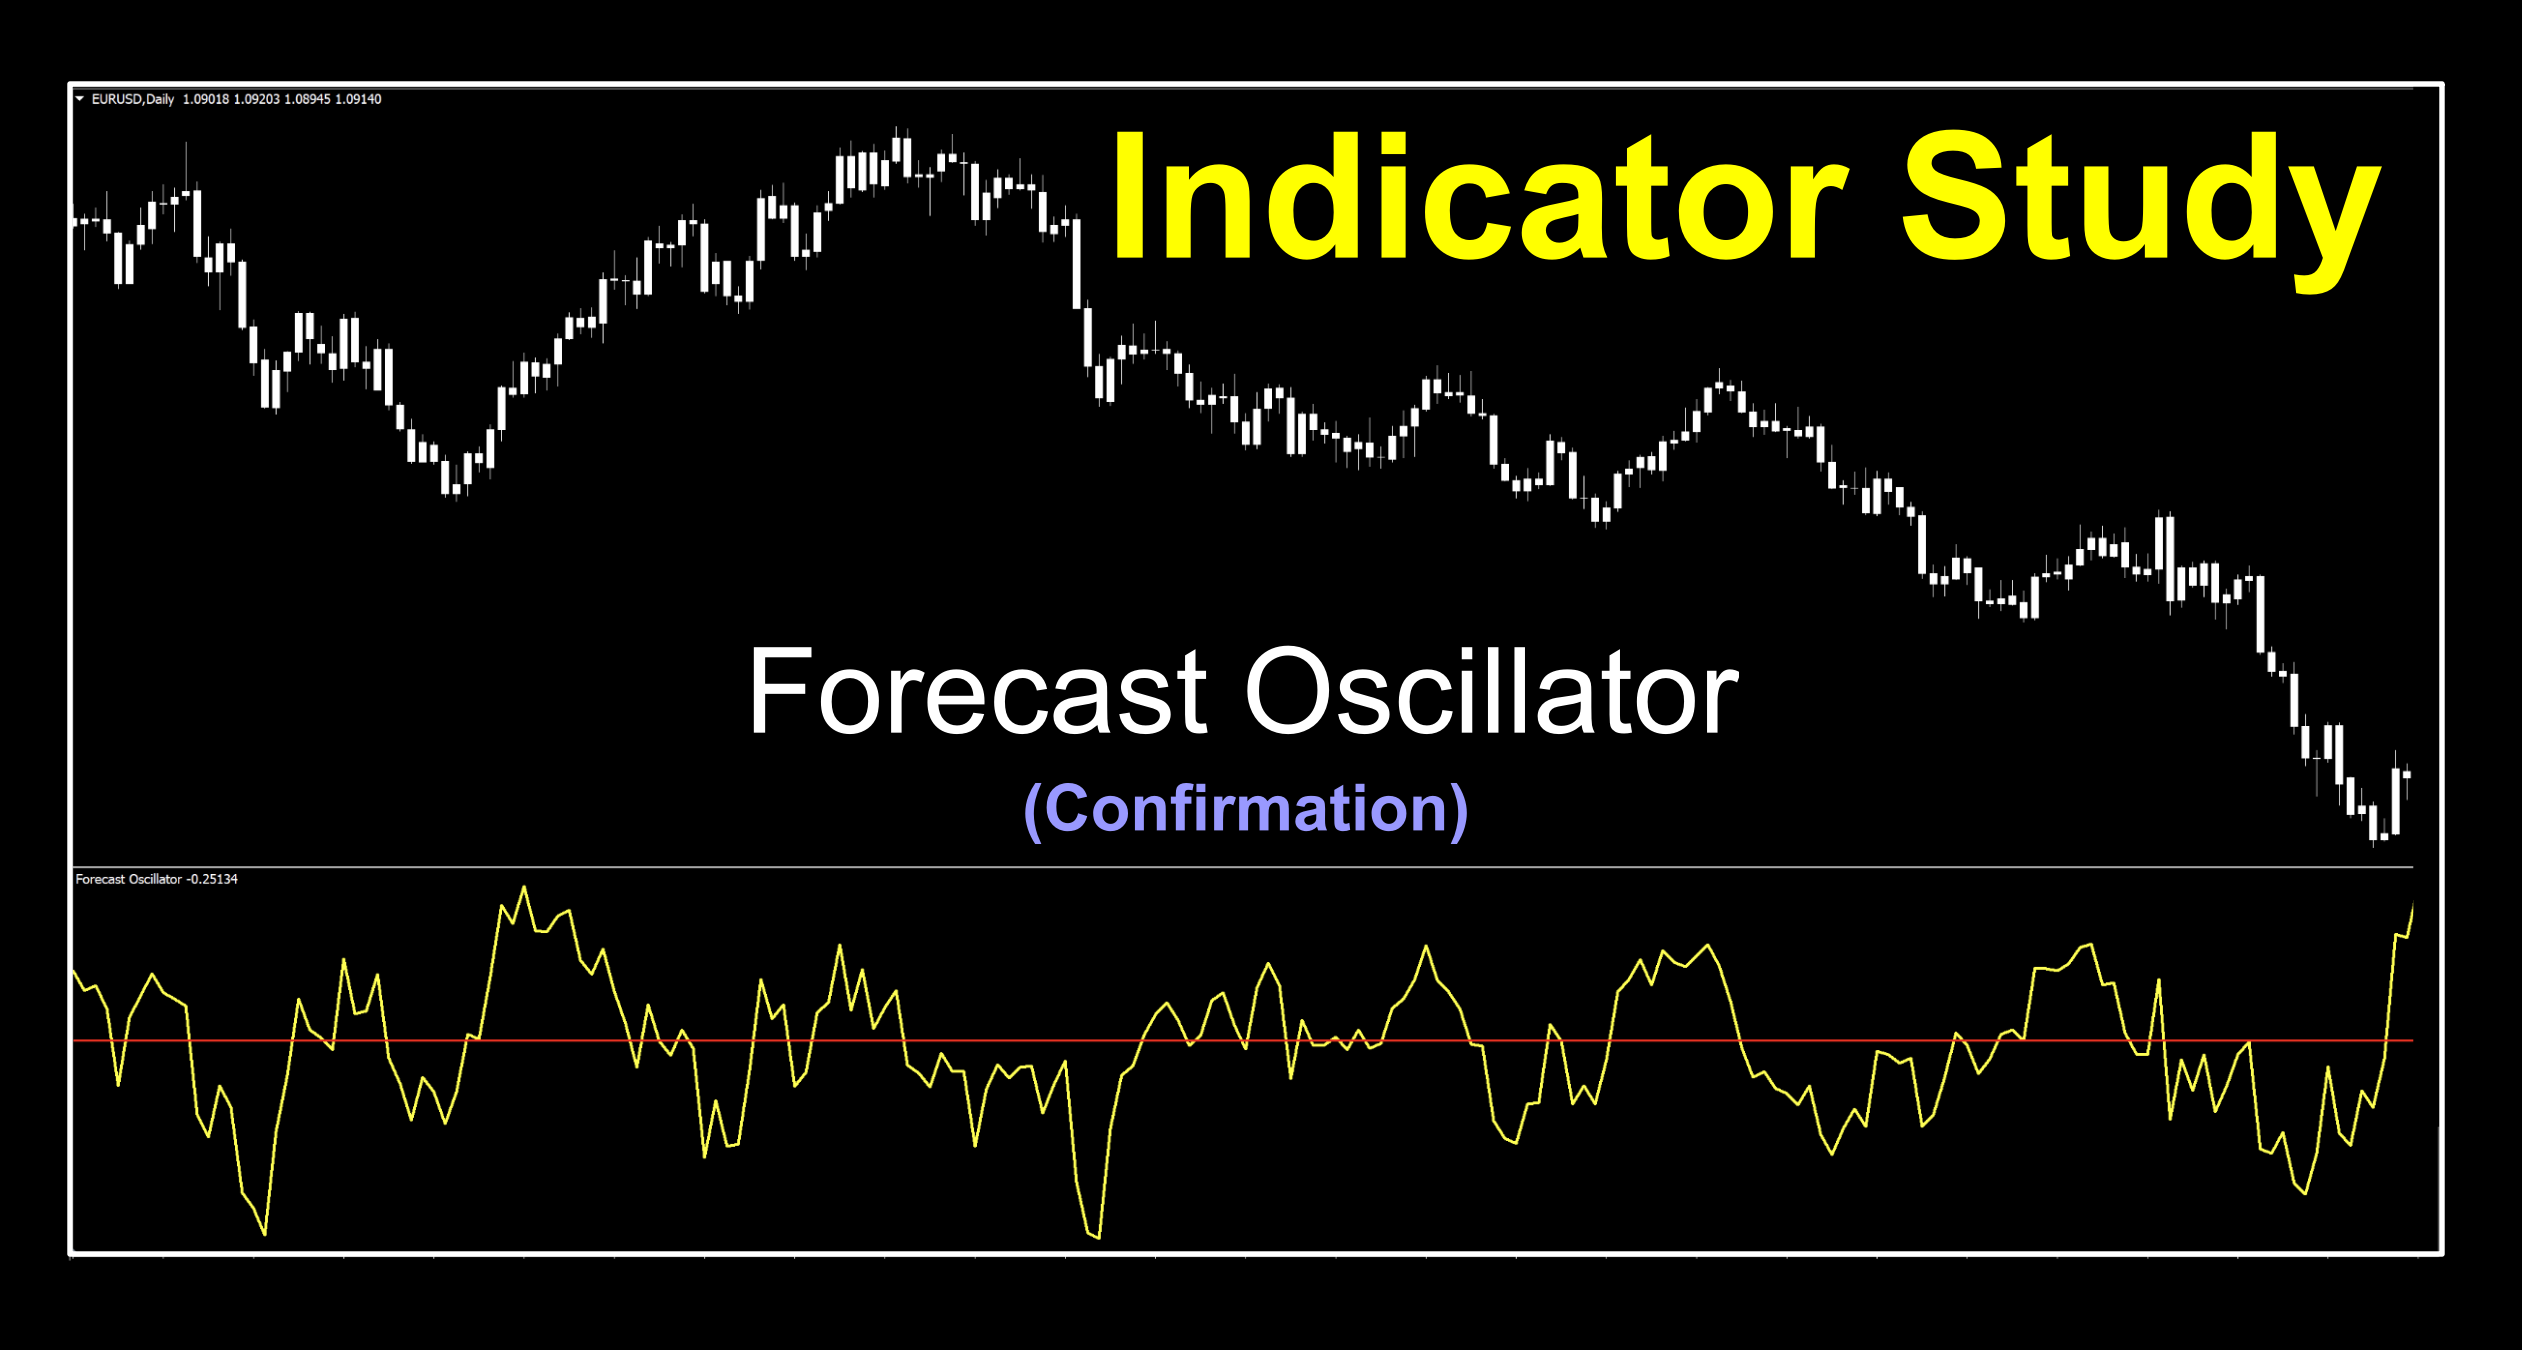
Forecast Oscillator
If you’d like to follow along with the e-book version of the blog, click on the play button in the audio player below (at the bottom of the page).

Cloudy with a Chance of Whatever
Anything that has the term “forecast” in it generally gives rise to some suspicions. Weather is a perfect example. Having resided in Florida for a few years (don’t hate me), we always went with anything over “30% chance for rain” generally meant we were gonna get wet sometime that day which may appear as sprinkles, rain, or what we use to call, “frog stranglers”…but sometimes not. Sometimes, nothing. But seriously, how can you bank on making a decision with 70% uncertainty and the balance was really just an educated guess. We (that’s you, myself, and all of us in the game) don’t play that. Trading should be unprejudiced as possible. Quantitative, that’s us…because;
quantitative
/ˈkwɒntɪtətɪv,ˈkwɒntɪteɪtɪv/
Adjective: relating to, measuring, or measured by the quantity of something.
“Quantitative analysis” – numbers-based, countable, or measurable. Qualitative data can help us to understand why, how, or what happened behind certain behaviors.
We Just Don’t Care
Wow…that introduction sure came across with some attitude, right? Sorry (not sorry) about that…but, you need to be crystal clear on why. We just DON’T CARE about why price does what it does, news announcements acting/not acting on price, fundamental trading, big bank pranksters, divergence, reversals…whatever. Where was I going with this?
Oh, right…now I remember.
Got The Jitters
We’ve strayed from profiling a below chart zero cross oscillating confirmation indicator for a few minutes. Time to take a look at one that at first appearance seems pretty simple and somewhat jagged, but looking deeper, has some good bones. This one is called the Forecast Oscillator and was coded for MT4 in 2014. We’ll break it down for you. Coincidently, it’s got a cousin in another indicator we’ve already profiled, but looks completely different. We’ll get into that shortly.
What’s the Forecast
So, why the claim to “forecast”? Let’s first discuss what the indicator is. Simply put, the actual price of whatever you’re looking at compared with the value returned by something called the “Time Series Forecast”. The “TSF” is calculated as a percentage ratio of the difference between the close price and the prior period’s “TSF” value to the Close Price.
Time Series Forecast
Let’s back it up for a moment. What exactly is the “TSF”? It’s a technical indicator which finds the statistical trend based on linear regression analysis using the least squares method. We profiled an indicator called “Trigger Lines” which also relies on least square a few months ago. An informative read. Okay, fine. But…
“This indicator (TSF) can be used for predicting future price movements. Note that this type of prediction is purely mathematical, as all calculations are based on least squares averaging of previous values.”
Hmm…so that means it’s based on prior values. History. An educated guess for future price action. Do you think price is going to “obey” that? Maybe…maybe not. Whipsaws, volatility (or lack thereof), unforeseen forces which we cannot “foresee”. I’m going to recycle that image I made last week for the technical analysis video to remind you of something.
“Crystal Ball Fortune Cookie Trading”
![]()
Are we clear? No forecasting. No foretelling. No wizards. Just trade what you see and react accordingly. If only there was a way to do that…oh wait. What if I used a system of quantitative indicators to increase my odds of a profitable trade based strictly on numerical values and boolean functions. An algorithm, perhaps? Yah…
Get Popcorn…With Butter!
Okay, now that we’ve got all that out of the way, let’s just take a break and relax a little. How about a video? Sounds about right. Don’t forget to come back and see how this indicator did. We’ll keep the lights on for you.
Twitchy as a Caffeinated Cat
Now then, because this indicator has the whole linear regression and least squares going on, it makes it very reactive to price and removes a degree of lag normally associated with other indicators. This results in somewhat of a jagged signal line, as you’ll soon see. That’s totally fine. That’s the reason why we make tweaks. So, we’ll put up the default settings and thicken up the signal line, add a zero line, and see what we’re up against. Candles are just plain old tee-shirt white because, well…you know why.
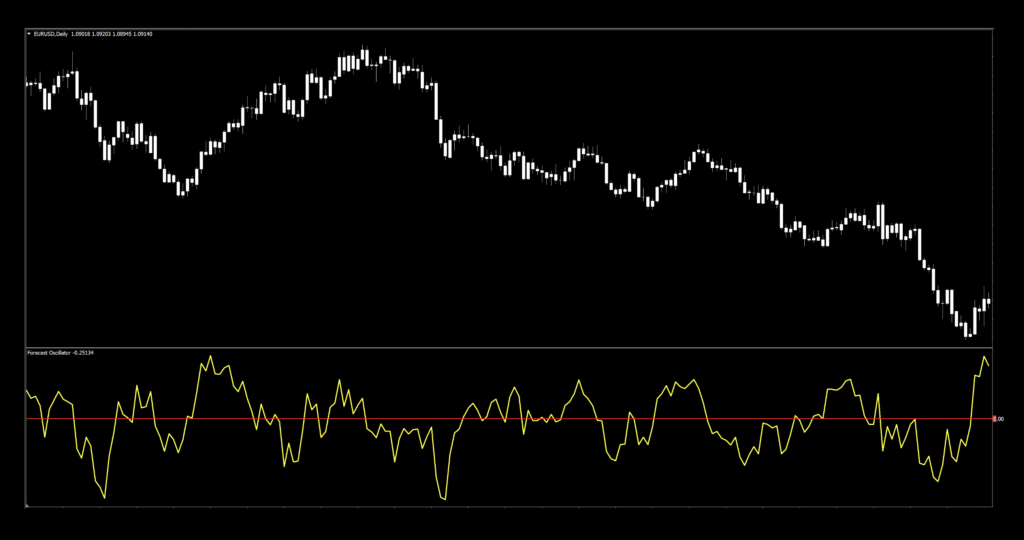
Definitely reactive to price. But what’s nice is that we have a some recourse with the two settings available to us.
Settings
Of the two settings, we use both. And here they are…
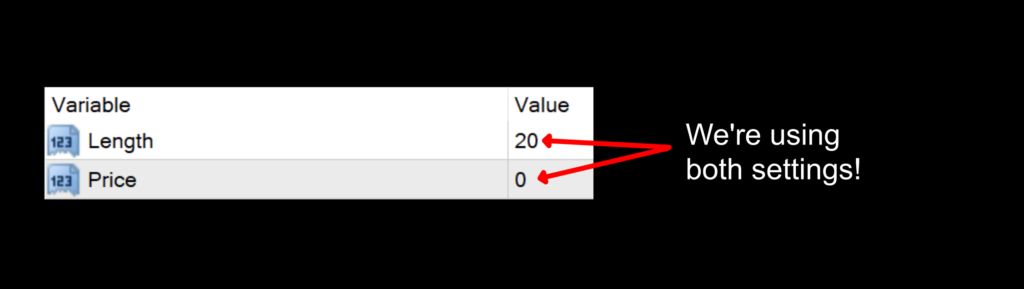
Length: Specifies the number of periods used for all the necessary calculations. The default value is 20.
Price: The data set used for the calculations where 0 – close, 1 – open, 2 – high, 3 – low, 4 – median, 5 – typical, 6 – weighted. The default value is 0 – close.
Advantages
* Very reactive to changes in price action.
* Simple to test.
* Signals are easy to see.
How we use it.
To clarify specific concepts relating to the NNFX system. There are three possible trade actions;
OPENING A TRADE
CLOSING A TRADE
MAINTAINING A TRADE
One of these three actions need to happen in the last 30 minutes prior to the close. This is when you make your trading decisions, and not actually wait for the close at 1700 EST, because we trade on the daily time frame.
Long signal: When the signal line crosses above the zero line. Entry is in the last 30 minutes of the trading day.
Short signal: When the signal line crosses below the zero line. Entry is in the last 30 minutes of the trading day.
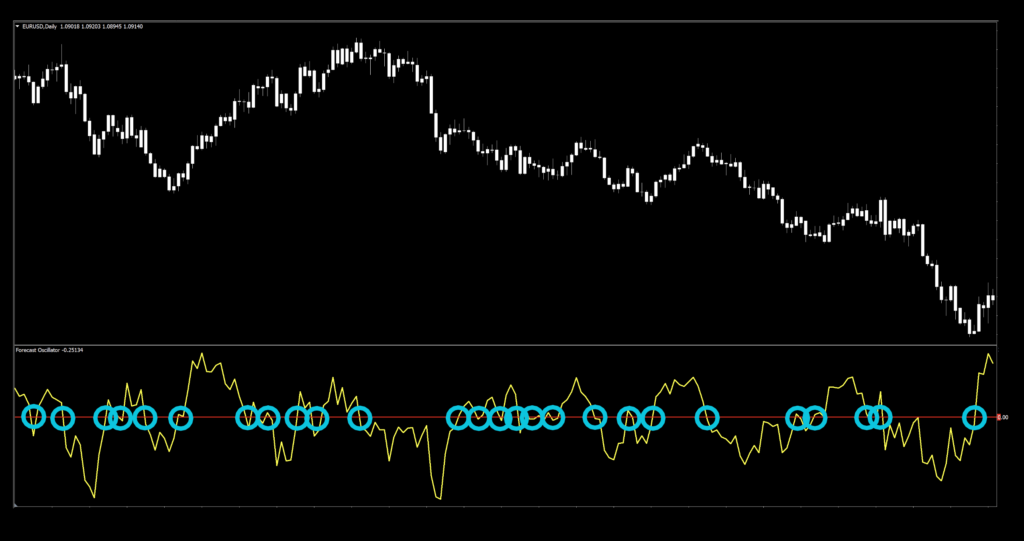
It’s Raining Signals
As mentioned, the default settings give a lot of signals. We’ll post the default chart just to see how it looks. Then, we’ll see if we can find something a little easier on the eyeballs.
Yeah, that’ll keep you busy. Now, we’ll just change those default settings to something at random. I’m throwing a dart and for triple value, and we’ve got “trip 18”, so 54. We’ll also go with 4 – median prices, because…why not.
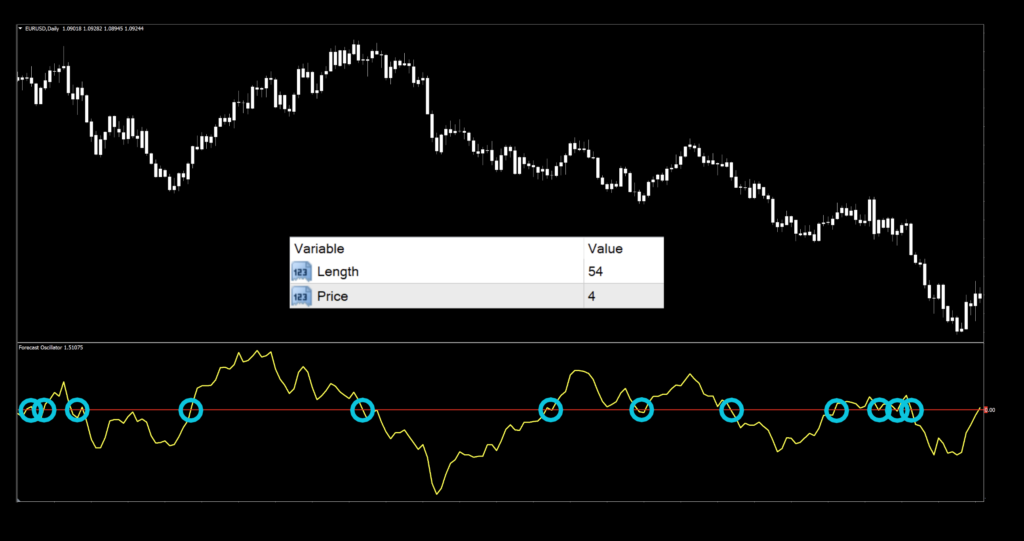
Much easier to find better signals, and I spent literally five seconds changing the numbers. No excuses for anybody to complain that this indicator can’t be made better or that you can’t do it.
One More Thing
I want to point out something that might be somewhat obvious to the more experienced, but not to the newly indoctrinated. We’ll zoom in on a particular section of the modified chart to focus on something.
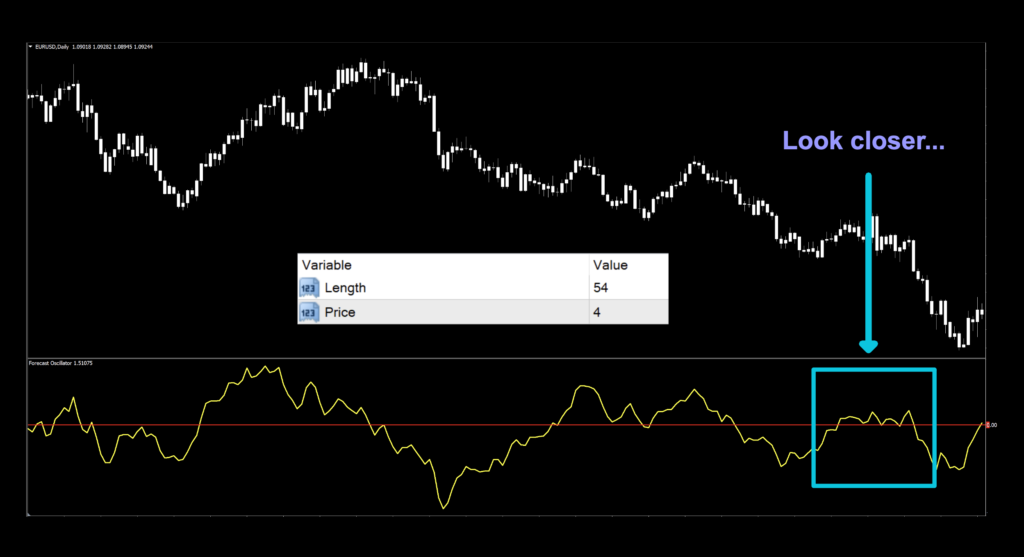
Look Closer
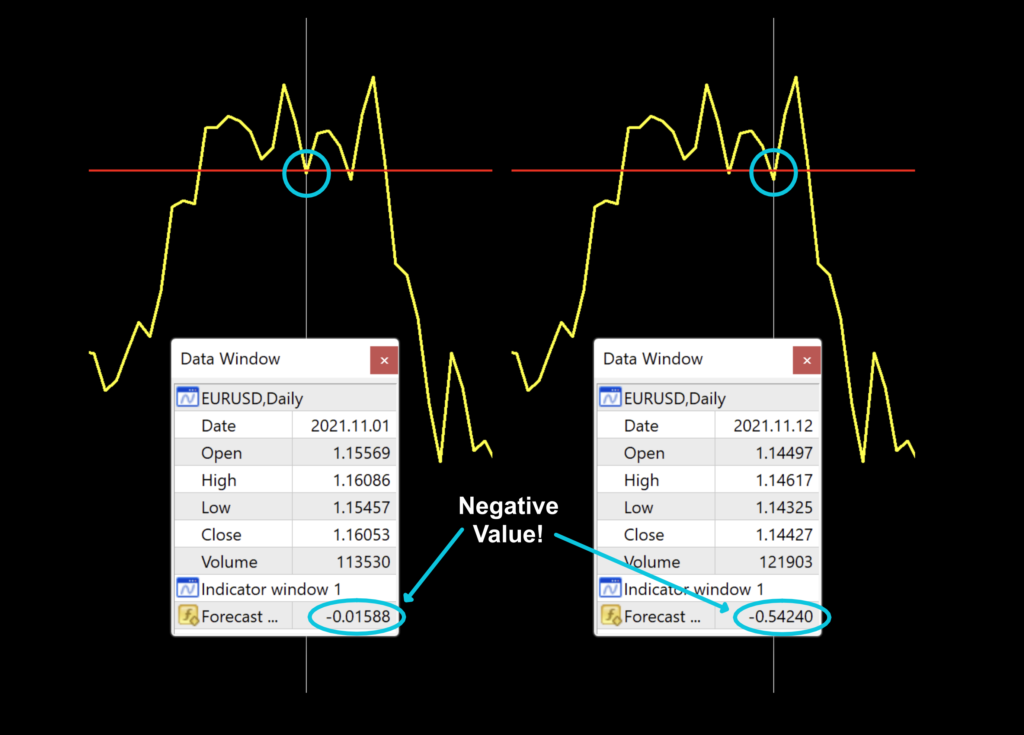
We zoomed in on the area of interest for a purpose. There were two signals which may have been “overlooked”. When you’ve got a chart with a bunch of indicators, colors and perhaps a few notations, things can get missed. Quantitative, that’s us, remember? It’s it the details. There were two points on the chart where the signal line crossed and closed below the zero line before moving north of it again. Stay focused. Now, onto the fun stuff!
Testing For The Win
If you’re new to these studies, we recommend looking at some of the older blogs to understand how we conduct our testing.
The six pairs we recommend testing are…
EUR/USD
AUD/NZD
EUR/GBP
AUD/CAD
CHF/JPY
CAD/SGD
The markets we test our indicators are the:
EUR/USD (Euro/US Dollar)
BTC/USD (Bitcoin/US Dollar)
XAU/USD (Gold/US Dollar)
SPX500 (S&P500 Index)
Timeframes and Results
We’ll run the Forecast Oscillator indicator on the EUR/USD, BTC/USD, XAU/USD, and the SPX500 using the default and tweaked settings across the daily and 4-hour timeframes on the MT4 strategy tester.
We focus on three metrics;
Total trades
Win/Loss ratio
ROI (return on investment)
Results For The Offering
Below is the data from our testing.
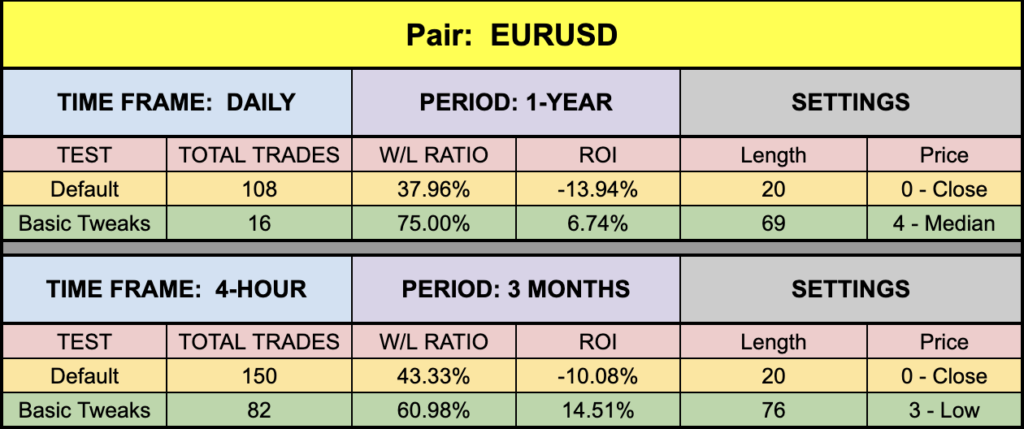
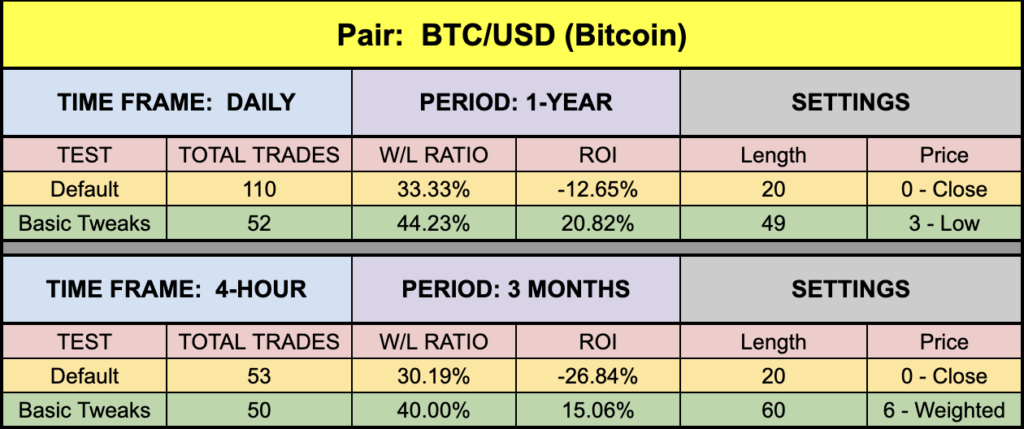
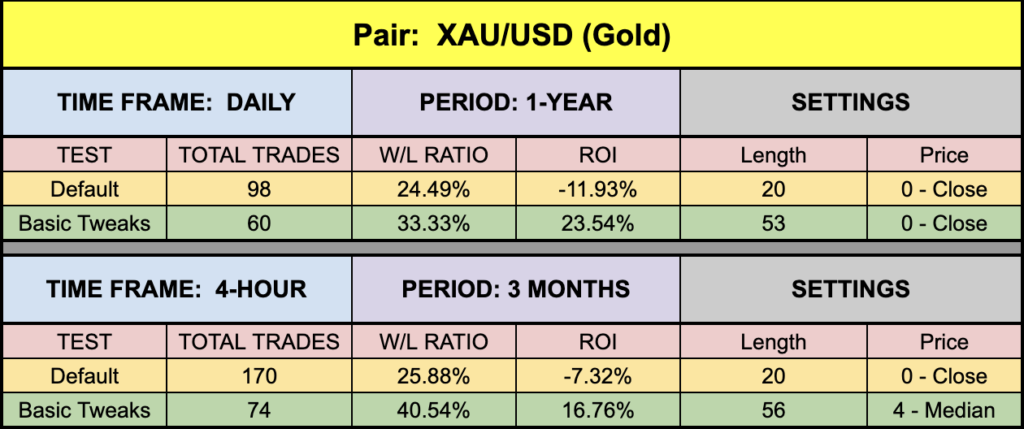
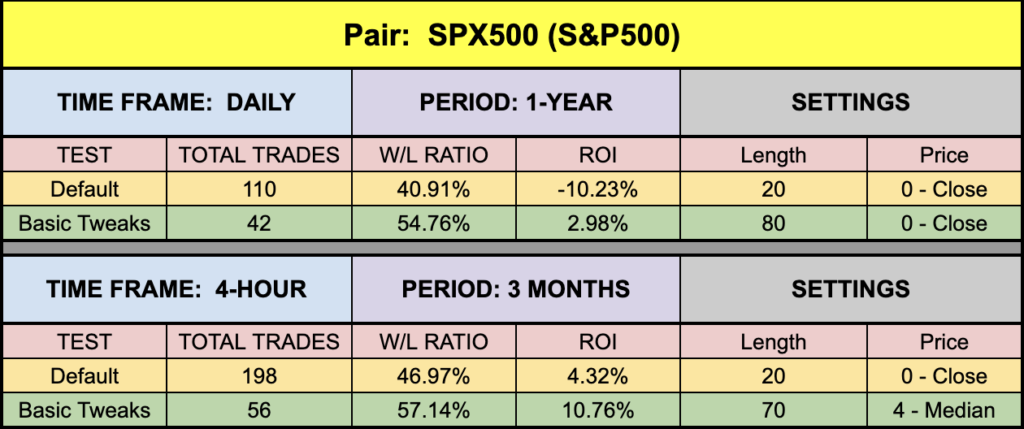
Interesting patterns here. The default settings returned a ridiculous number of trades in almost all instances. Not surprising though. We expected that. The default ROI numbers were actually not as terrible as we’ve seen in the past. That can be attributed to the reduced lagging effect of this indicator. We like that. All that being the case, EUR and SPX500 were a little soft, which is nothing new at the moment and of course BTC and XAU continue to be…golden. Go get it, tune it up, and see if you can’t find some good numbers for yourself.
Do The Thing
Don’t forget the survey on the Stonehill Forex home page. We’ll be publishing the data we received over the last month, and the more data we have, the merrier. It takes less than 5 minutes.
Gimme a Brush
We’re also working on the next repainting video. It’s a sneaky little goober. It’ll be coming out soon. Watch for it!
Money Management
Money management is based on the NNFX risk profile. That information can be learned in the Advanced Course.
Resources
We’ve made the Forecast Oscillator indicator available for download on our site from the indicator library, for free. When you’re ready to get it, click HERE.
We’re Here For You
Don’t forget to sign up for the latest digests. If you’d like a copy of the last one, email dan@stonehillforex.com with the title “Latest Digest Please” and we’ll send it off to you within 24 hours. We’ve got the next one coming out soon.
Other Resources
Be sure to subscribe to the Stonehill Forex YouTube channel for the technical analysis videos which pair well with these blogs…like kings and queens. Don’t forget Facebook and Quora, where we answer questions relating to Forex.
Our only goal is to make you a better trader.
BTW – Any information communicated by Stonehill Forex Limited is solely for educational purposes. The information contained within the courses and on the website neither constitutes investment advice nor a general recommendation on investments. It is not intended to be and should not be interpreted as investment advice or a general recommendation on investment. Any person who places trades, orders or makes other types of trades and investments etc. is responsible for their own investment decisions and does so at their own risk. It is recommended that any person taking investment decisions consults with an independent financial advisor. Stonehill Forex Limited training courses and blogs are for educational purposes only, not a financial advisory service, and does not give financial advice or make general recommendations on investment.