Are You Stiff Enough?
Stiff upper lip. Stoic in the face of adversity. Facing the market full on while leaning into your trades. You’ve got to have backbone. We don’t back away from our trades. Don’t be like those wishy-washy traders who open, and close positions based on gut feeling, fear, or some other subjective notion. You want indicators that work well independently, and together with others, and we aim to profile those. This week, we’ve got one to help maintain that stiffness. Let’s lean into it.
Pleased to Meet You
We’re profiling, for the first time, an indicator by Markos Katsanos. Who’s that, you ask? Mr. Katsanos began his career as an engineer and moved into trading, developing custom indicators for the rest of us. I was fortunate to have an email dialogue with him a few months ago and discovered the man is both a gentleman and a scholar. We were looking at one of his volume indicators initially but found this one and decided to profile it first. We will be looking at some of his other work in the future. If you’d like to check him out, his website is; https://mkatsanos.com
Video Proof of Life
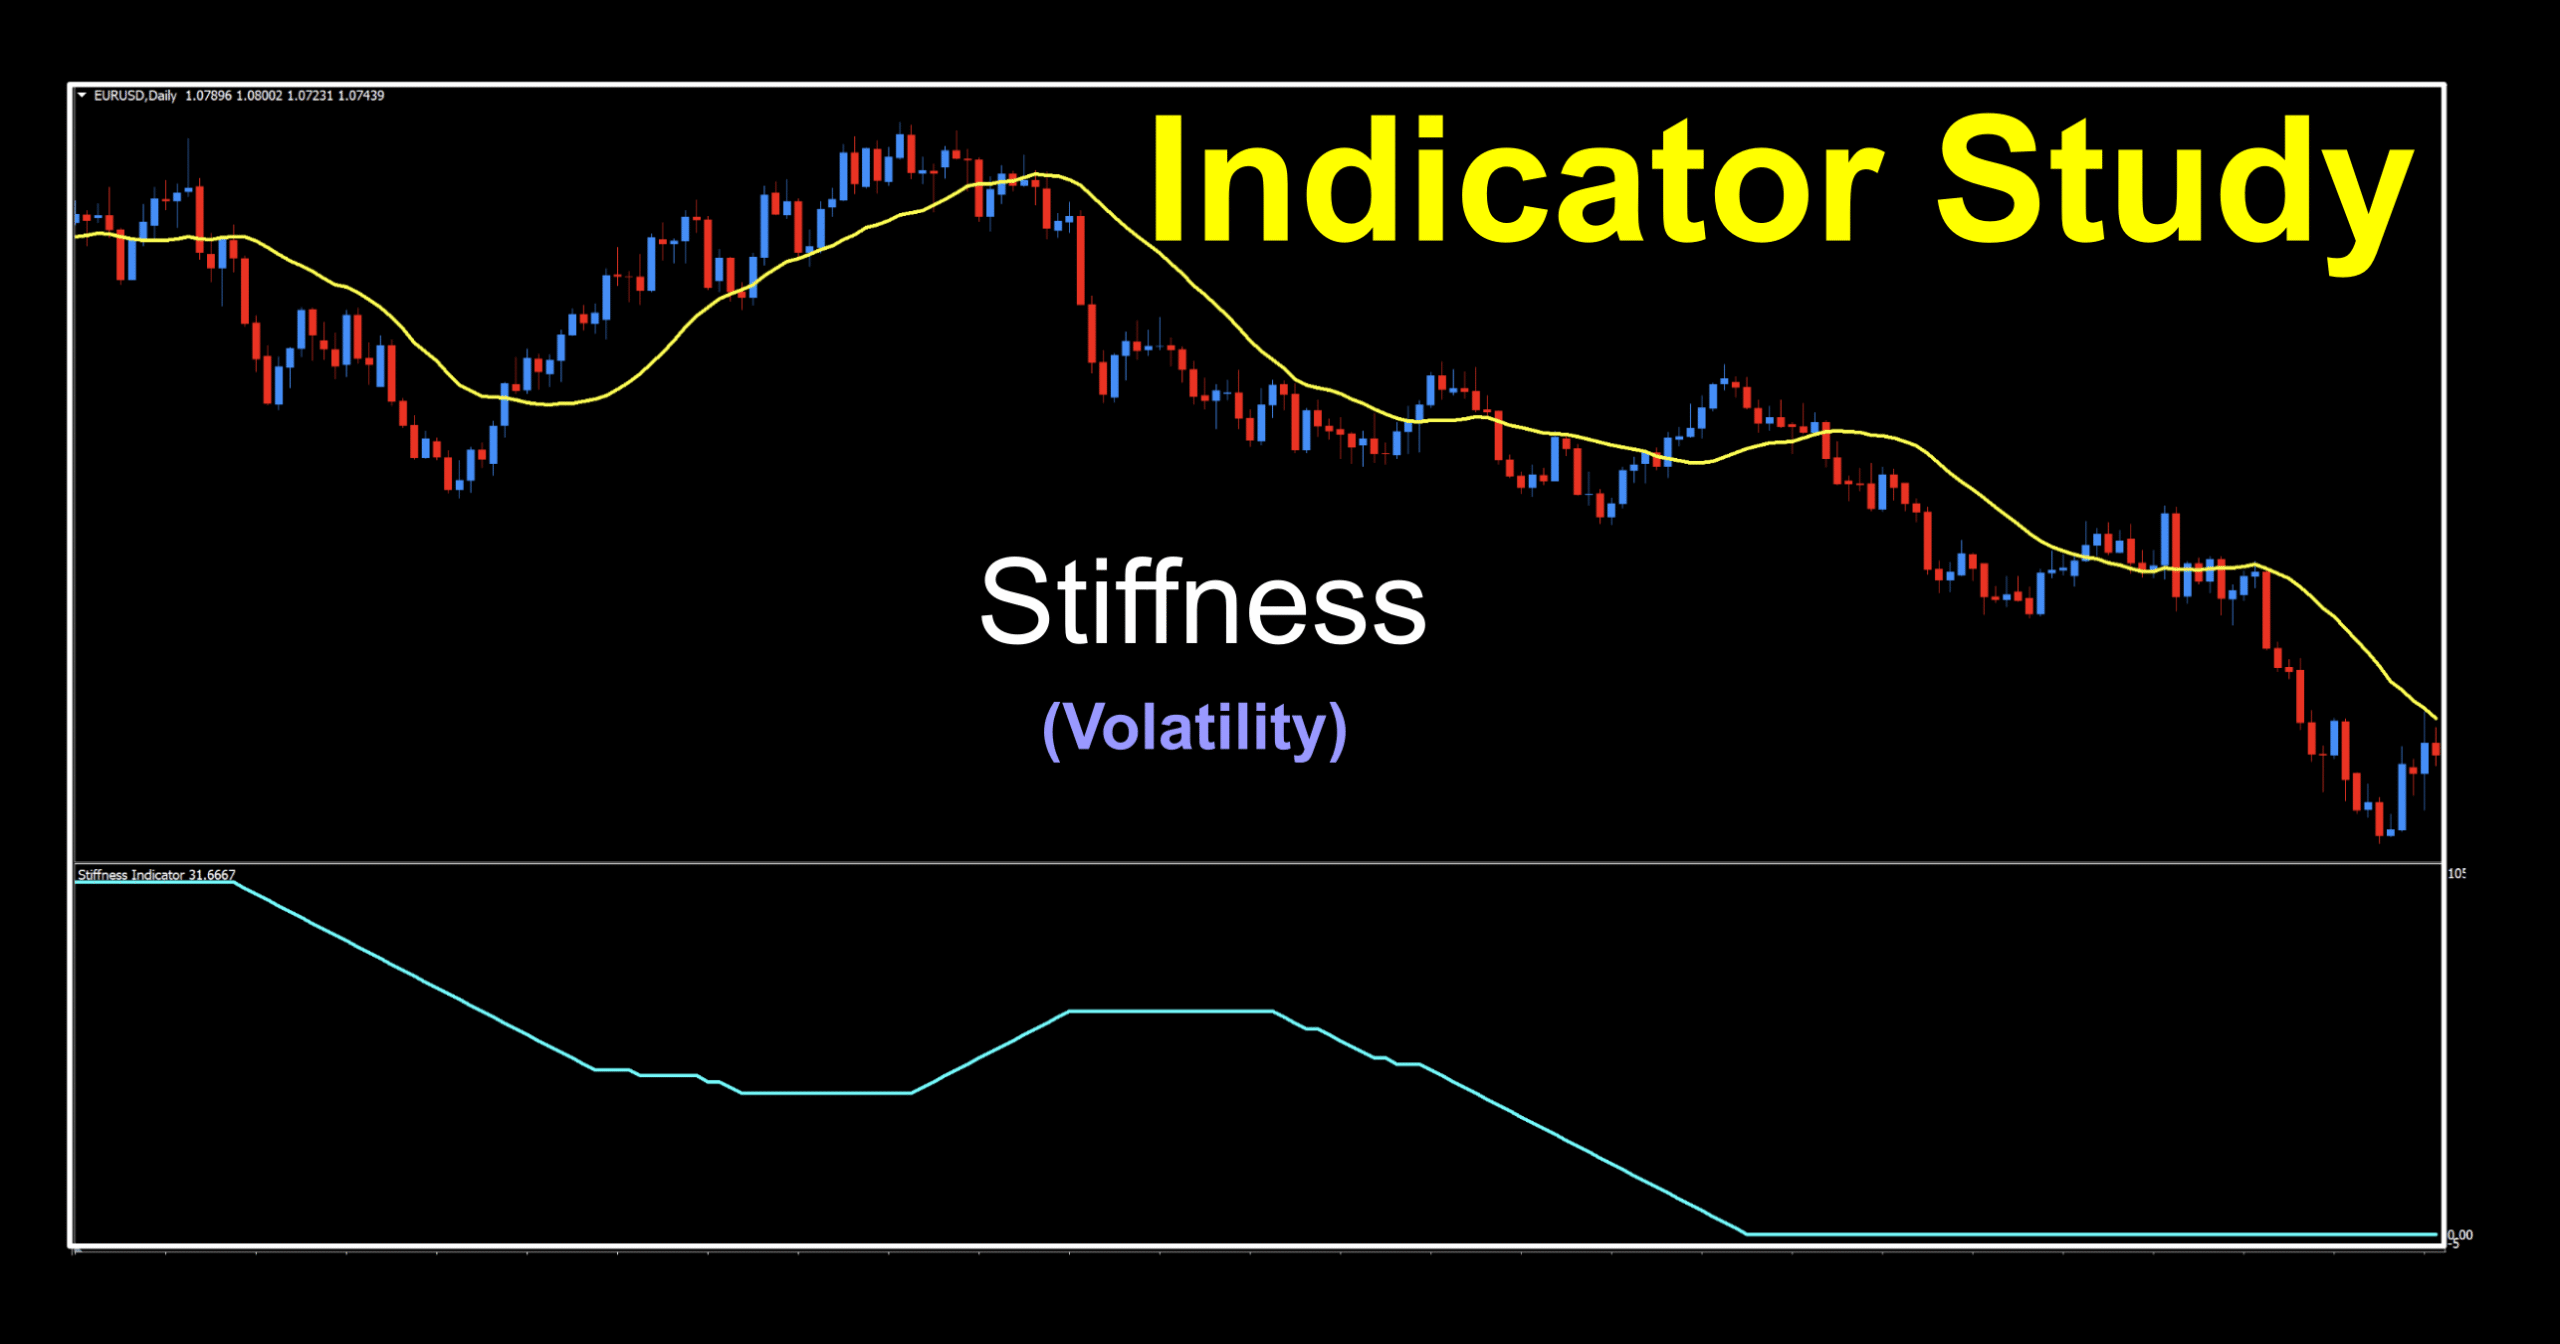
The indicator from Mr. Katsanos we’ll be looking at this week is called the Stiffness indicator. It was introduced in the November 2018 in the Stocks and Commodities Magazine under the article name, “Are Your Stocks Stiff Enough?”. Coincidentally, it was coded for MT4 the same year. Before we get into the nitty-gritty of it, let’s plug in the technical analysis video to see how it does its stuff before continuing on.
Well Hello There
When we first looked at this indicator, we realized that this would fit nicely into our volume/volatility collection and thought, “we’ve gotta do this one”. The bones of this indicator are that it attempts to discern trends by taking account of the number of occurrences that price was above a specified moving average during a specified period of time. The fewer occurrences of this condition, the stronger the trend. Additionally, a volatility threshold is included to reject minimal penetrations above the moving average threshold of less than 0.2 standard deviations. There’s more to this, and we’ll get into it with chart illustrations and mark-ups. And, there you go.
Original Case
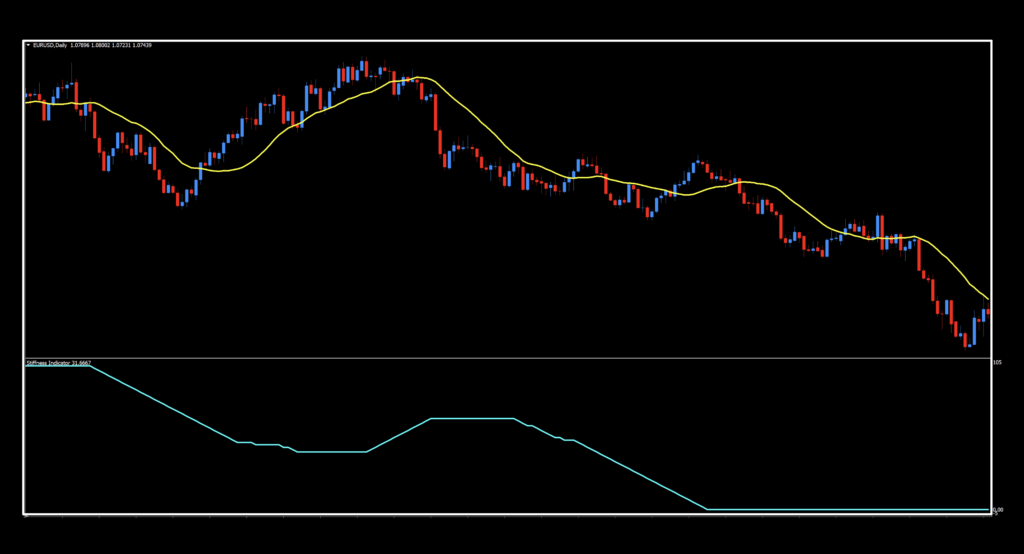
We don’t stray far from the default view, but we had to make a minor change to better illustrate what features to look for and how to use it. We’ll post the original view with a brightened up aqua colored signal line instead of red before we jump in with both feet. Furthermore, we’ll be using our blue/red candles for this one instead of vanilla white for reasons you’ll soon see.
Firstly
Before we get into how to use this indicator, we need to point out a few things. First off, this indicator is not a LONG/SHORT indicator; i.e., it’s not a confirmation indicator dictating the direction of a trade. Like a volume indicator, we’re looking for YES/NO before considering opening a position.
Secondly
Second, as most of you know, we must have an additional indicator to create the LONG/SHORT conditions. Here, we chose our trusty SMA(20) which presents as that cheerful yellow line over price. Now that you understand those two things, let’s press on.
Additionally
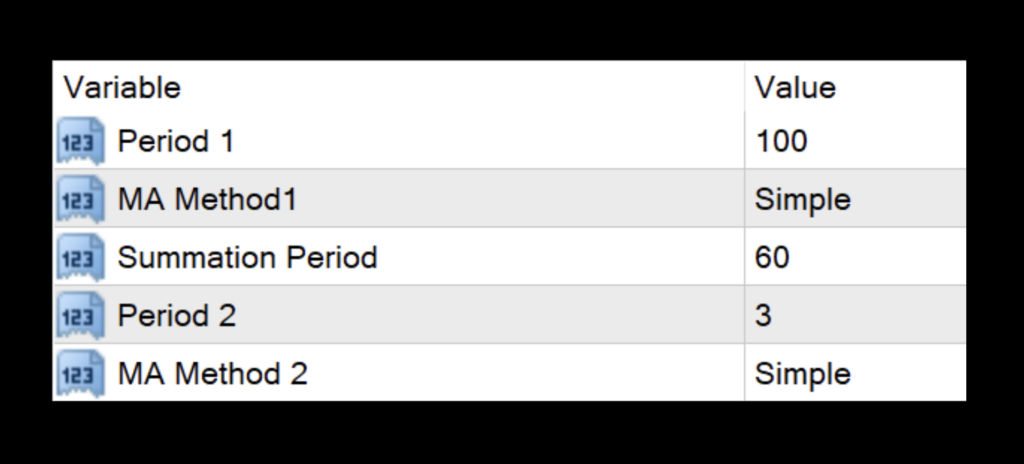
We’ve got the basic understanding out of the way, and need to establish a threshold of what constitutes a tradable condition. That level is described as 75 in the original use of the indicator; however, we’re going to make a few changes to that a little later. The original settings look like this;
So what that means is that on the default view, our chart would give us the following;
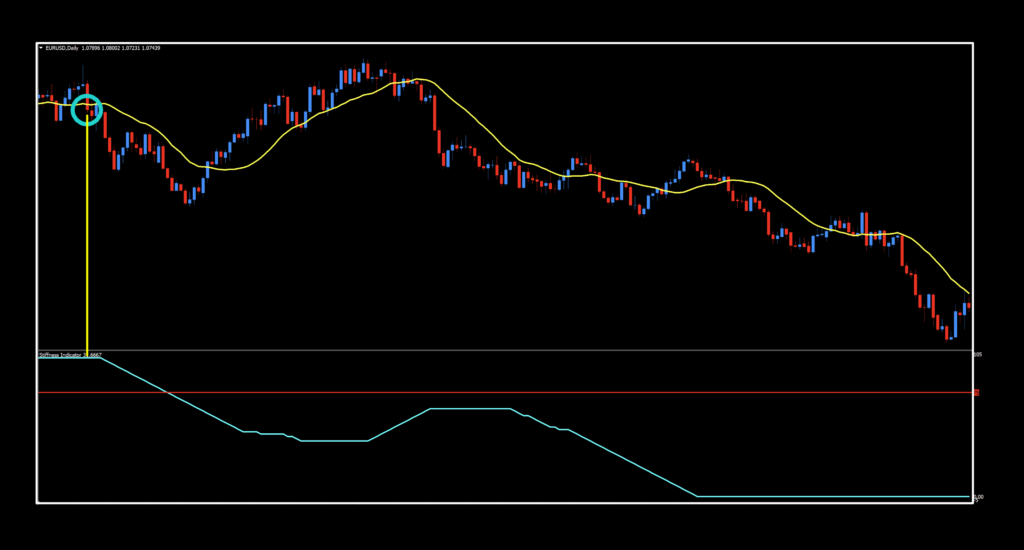
Yep, only one trade. Price crossed below the baseline, and then we looked down to see that the Stiffness Indicator is above the 75 threshold to confirm the short trade. Naturally, we’re not using it as an exit indicator because it only helps us with entries, so don’t consider the cross below the 75 line as an exit signal. In fact, once you open the trade, you’ll want to take the indicator off your chart for a cleaner view. We want more.
Gimme Fuel, Gimme Fire

We’re going to make some changes to the settings and change the threshold level to provide a more exciting view and give us a chance to look at additional signals. But, before we go there, let’s look at those numbers which make it more fun.
Settings
We’ll put up the settings menu with some random values we pulled out of the proverbial hat. After discussing them, we’ll look at our revised mark up.
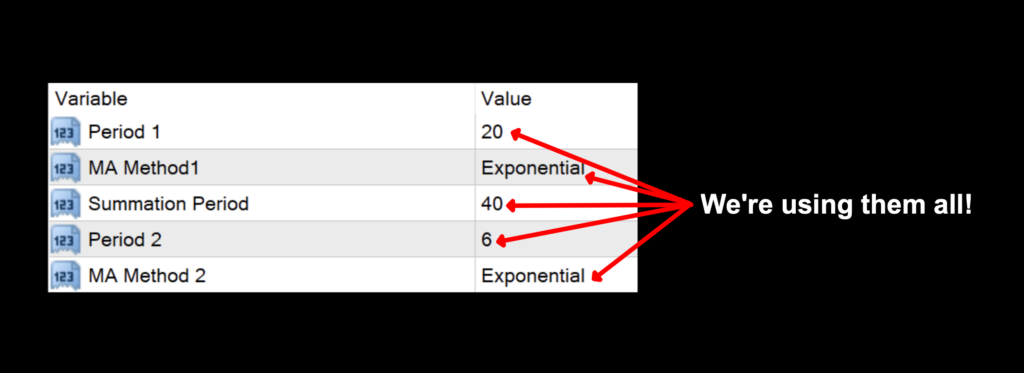
Period 1: The moving average number used as the “Stiffness” period. The default value is 100.
MA Method1: Moving Average type for the Stiffness period; Simple, Exponential, Smoothed, Linear Weighted. The default value is Simple.
Summation Period: This is the indicator period. The default value is 60.
Period 2: The moving average for the indicator period. The default value is 3.
MA Method 2: The moving average for the indicator period; Simple, Exponential, Smoothed, Linear Weighted. The default value is Simple.
How we use it.
One of three actions need to happen in the last 30 minutes prior to the close of the trading day. They are; opening, maintaining, or closing a position. This is when you make your trading decisions, and not actually wait for the close at 1700 EST, because we trade on the daily time frame.
YES Trade Condition: When baseline and confirmation signals are in agreement, the signal line is above the threshold level. Entry is in the last 30 minutes of the trading day.
NO Trade Condition: Any time the signal line is below the threshold level.
Take a Powder
Once you’re ready to perform daily maintenance on your trades during the last 20–30 minutes of the trading day (1700 New York time), you’ll be presented with one of four options.
- Opening a trade.
- Closing a trade
- Maintaining a trade; i.e.
- Moving a stop loss level.
- Exiting a trade.
- Taking a pass (nothing to do).
Gateway to Glitter
Now that we’ve made it to the mark-up, we’ll be using those alternate settings and a threshold of 6. The baseline is still SMA(20).
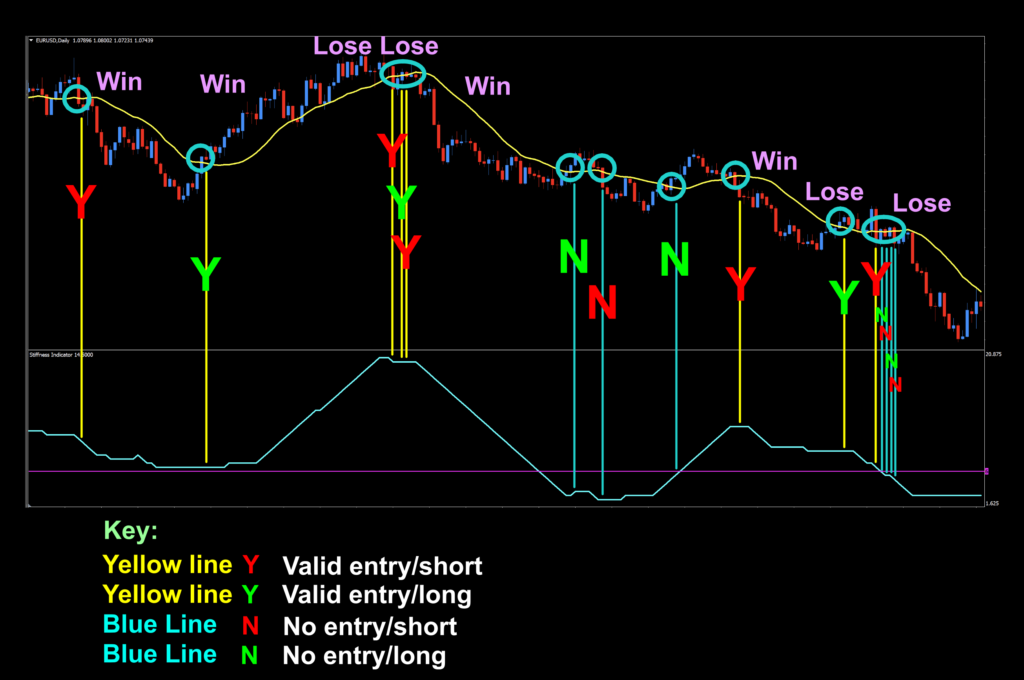
It looks a little busy here, but we’ll go through this quickly. The first thing we look for is the baseline signal to determine a long or short trade condition. Once that is confirmed, look down at the Stiffness Indicator. Is it above the threshold line? Trade on. If it’s not, then sit on your hands. There were trades that qualified, but would have resulted in losses if only using the baseline. But we have other components in our algorithm (confirmation) which would have kept us out of those trades. Remember, this indicator only confirms a trade condition or indicates that the market is stiff enough to support the trade.
Picking a Threshold
You’ll need to decide on a threshold level. You may wonder what is a good level. Like many things, that’s up to you. Pick one too low, you’ll get significantly more “green lights”, but failed trades. Too high, too few trades, and you may miss opportunities. Each market will have a sweet spot. Your mission, should you choose to accept it, is to find the sweet spot which can exclude losing trades but not so tight that you miss those nice trendy moves.
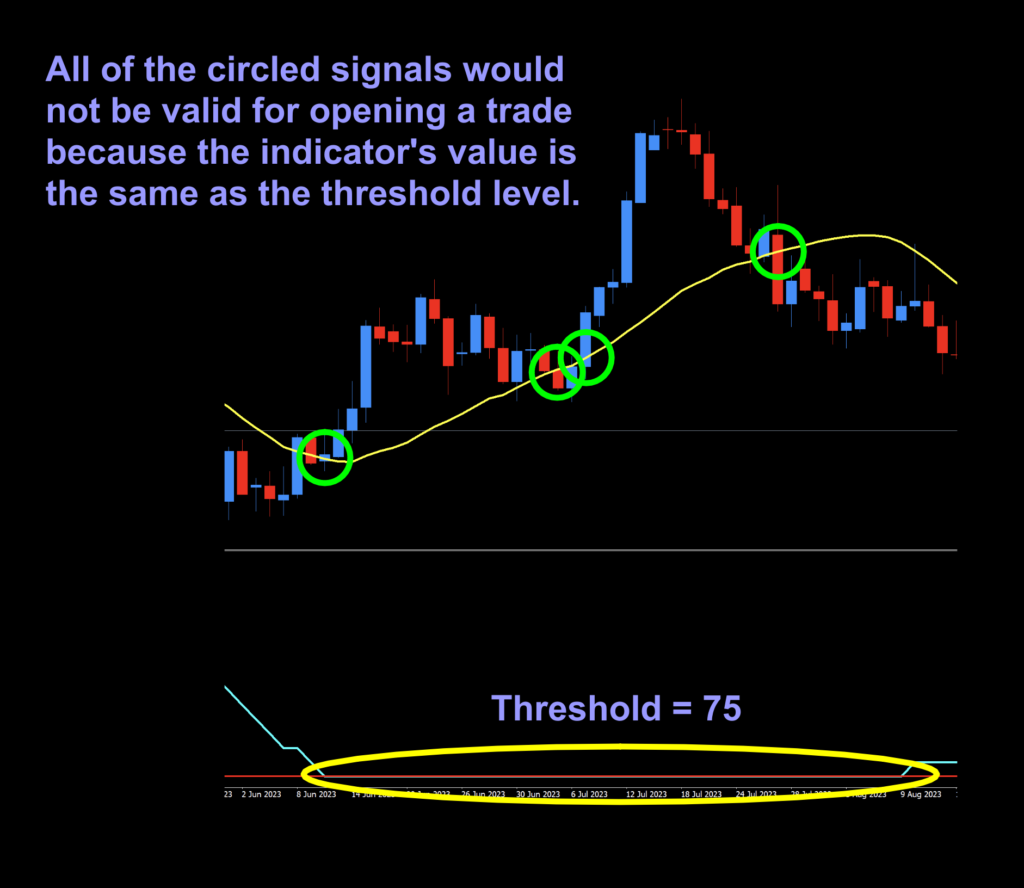
Additional Threshold Notes
When we started our testing, we noticed there were periods when the signal line and the threshold line were the same value. For the record, it cannot be the same value. It must be (in this instance) higher than the threshold line. We’ve included a screenshot where the indicator is “on top” of the threshold at a value of 75. While you may want to bend the rules {just a little bit} and take the trade, you can’t. Once you begin bending/breaking rules, why bother trading at all. At some point, you’ll guess wrong too many times and that will be the end of it all. To summarize, the value of the indicator must be above 75.0000.
Testing For Pips
If you’re new to these studies, we recommend looking at some of the older blogs to understand how we conduct our testing. We’re going to be using our alternative numbers.
These are the Numbers You’re Looking For
Below is the data from our testing.
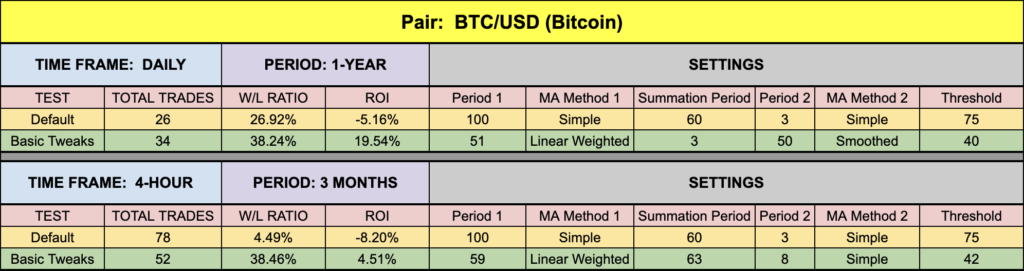
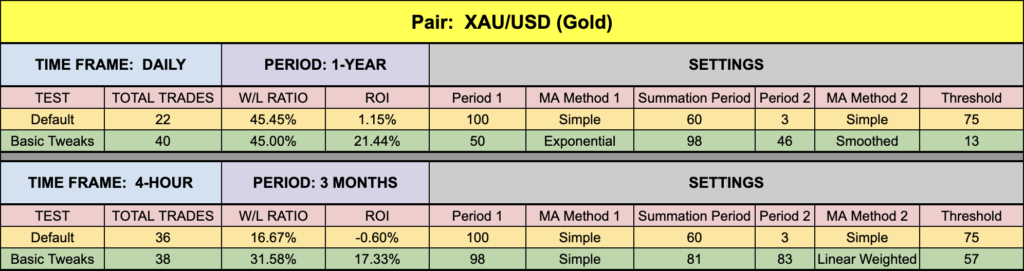
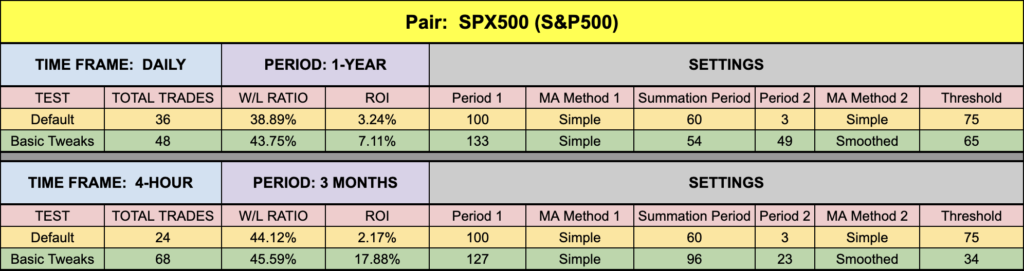
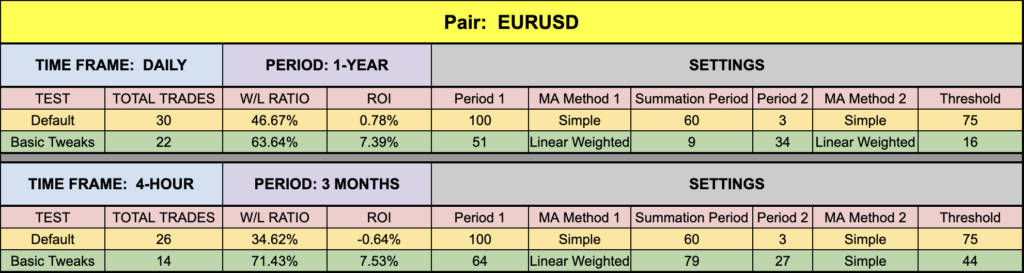
Testing took a bit longer on this one because we had a few more settings to contend with, but overall…not too bad. Default ROI values were pretty close to break even, with some even posting positive results – that’s something to cheer about. XAU and BTC were still capable of stellar results, although EUR and SPX markets held their own. We believe this would make a decent volatility gatekeeper in your algorithm. Go forth, experiment, and hopefully you’ll make some well deserved pips. After all, there’s a warm beach, clear waters, and cold drinks somewhere that needs visiting…
Resources
We’ve made the indicator available for download on our site from the indicator library, for free! When you’re ready to get it, click HERE. For the advanced course, click HERE. Be sure you’re signed up to get notification on our YouTube channel where you’ll be notified of new videos as we publish them.
Our only goal is to make you a better trader.
BTW – Any information communicated by Stonehill Forex Limited is solely for educational purposes. The information contained within the courses and on the website neither constitutes investment advice nor a general recommendation on investments. It is not intended to be and should not be interpreted as investment advice or a general recommendation on investment. Any person who places trades, orders or makes other types of trades and investments etc. is responsible for their own investment decisions and does so at their own risk. It is recommended that any person taking investment decisions consults with an independent financial advisor. Stonehill Forex Limited training courses and blogs are for educational purposes only, not a financial advisory service, and does not give financial advice or make general recommendations on investment.
*Our published testing results are based on money management strategies employed by the NNFX system and depend on varying external factors, which may be different between individuals and their specific broker conditions. No guarantee, trading recommendations, or other market suggestions are implied. Your results and subsequent trading activities are solely your own responsibility.