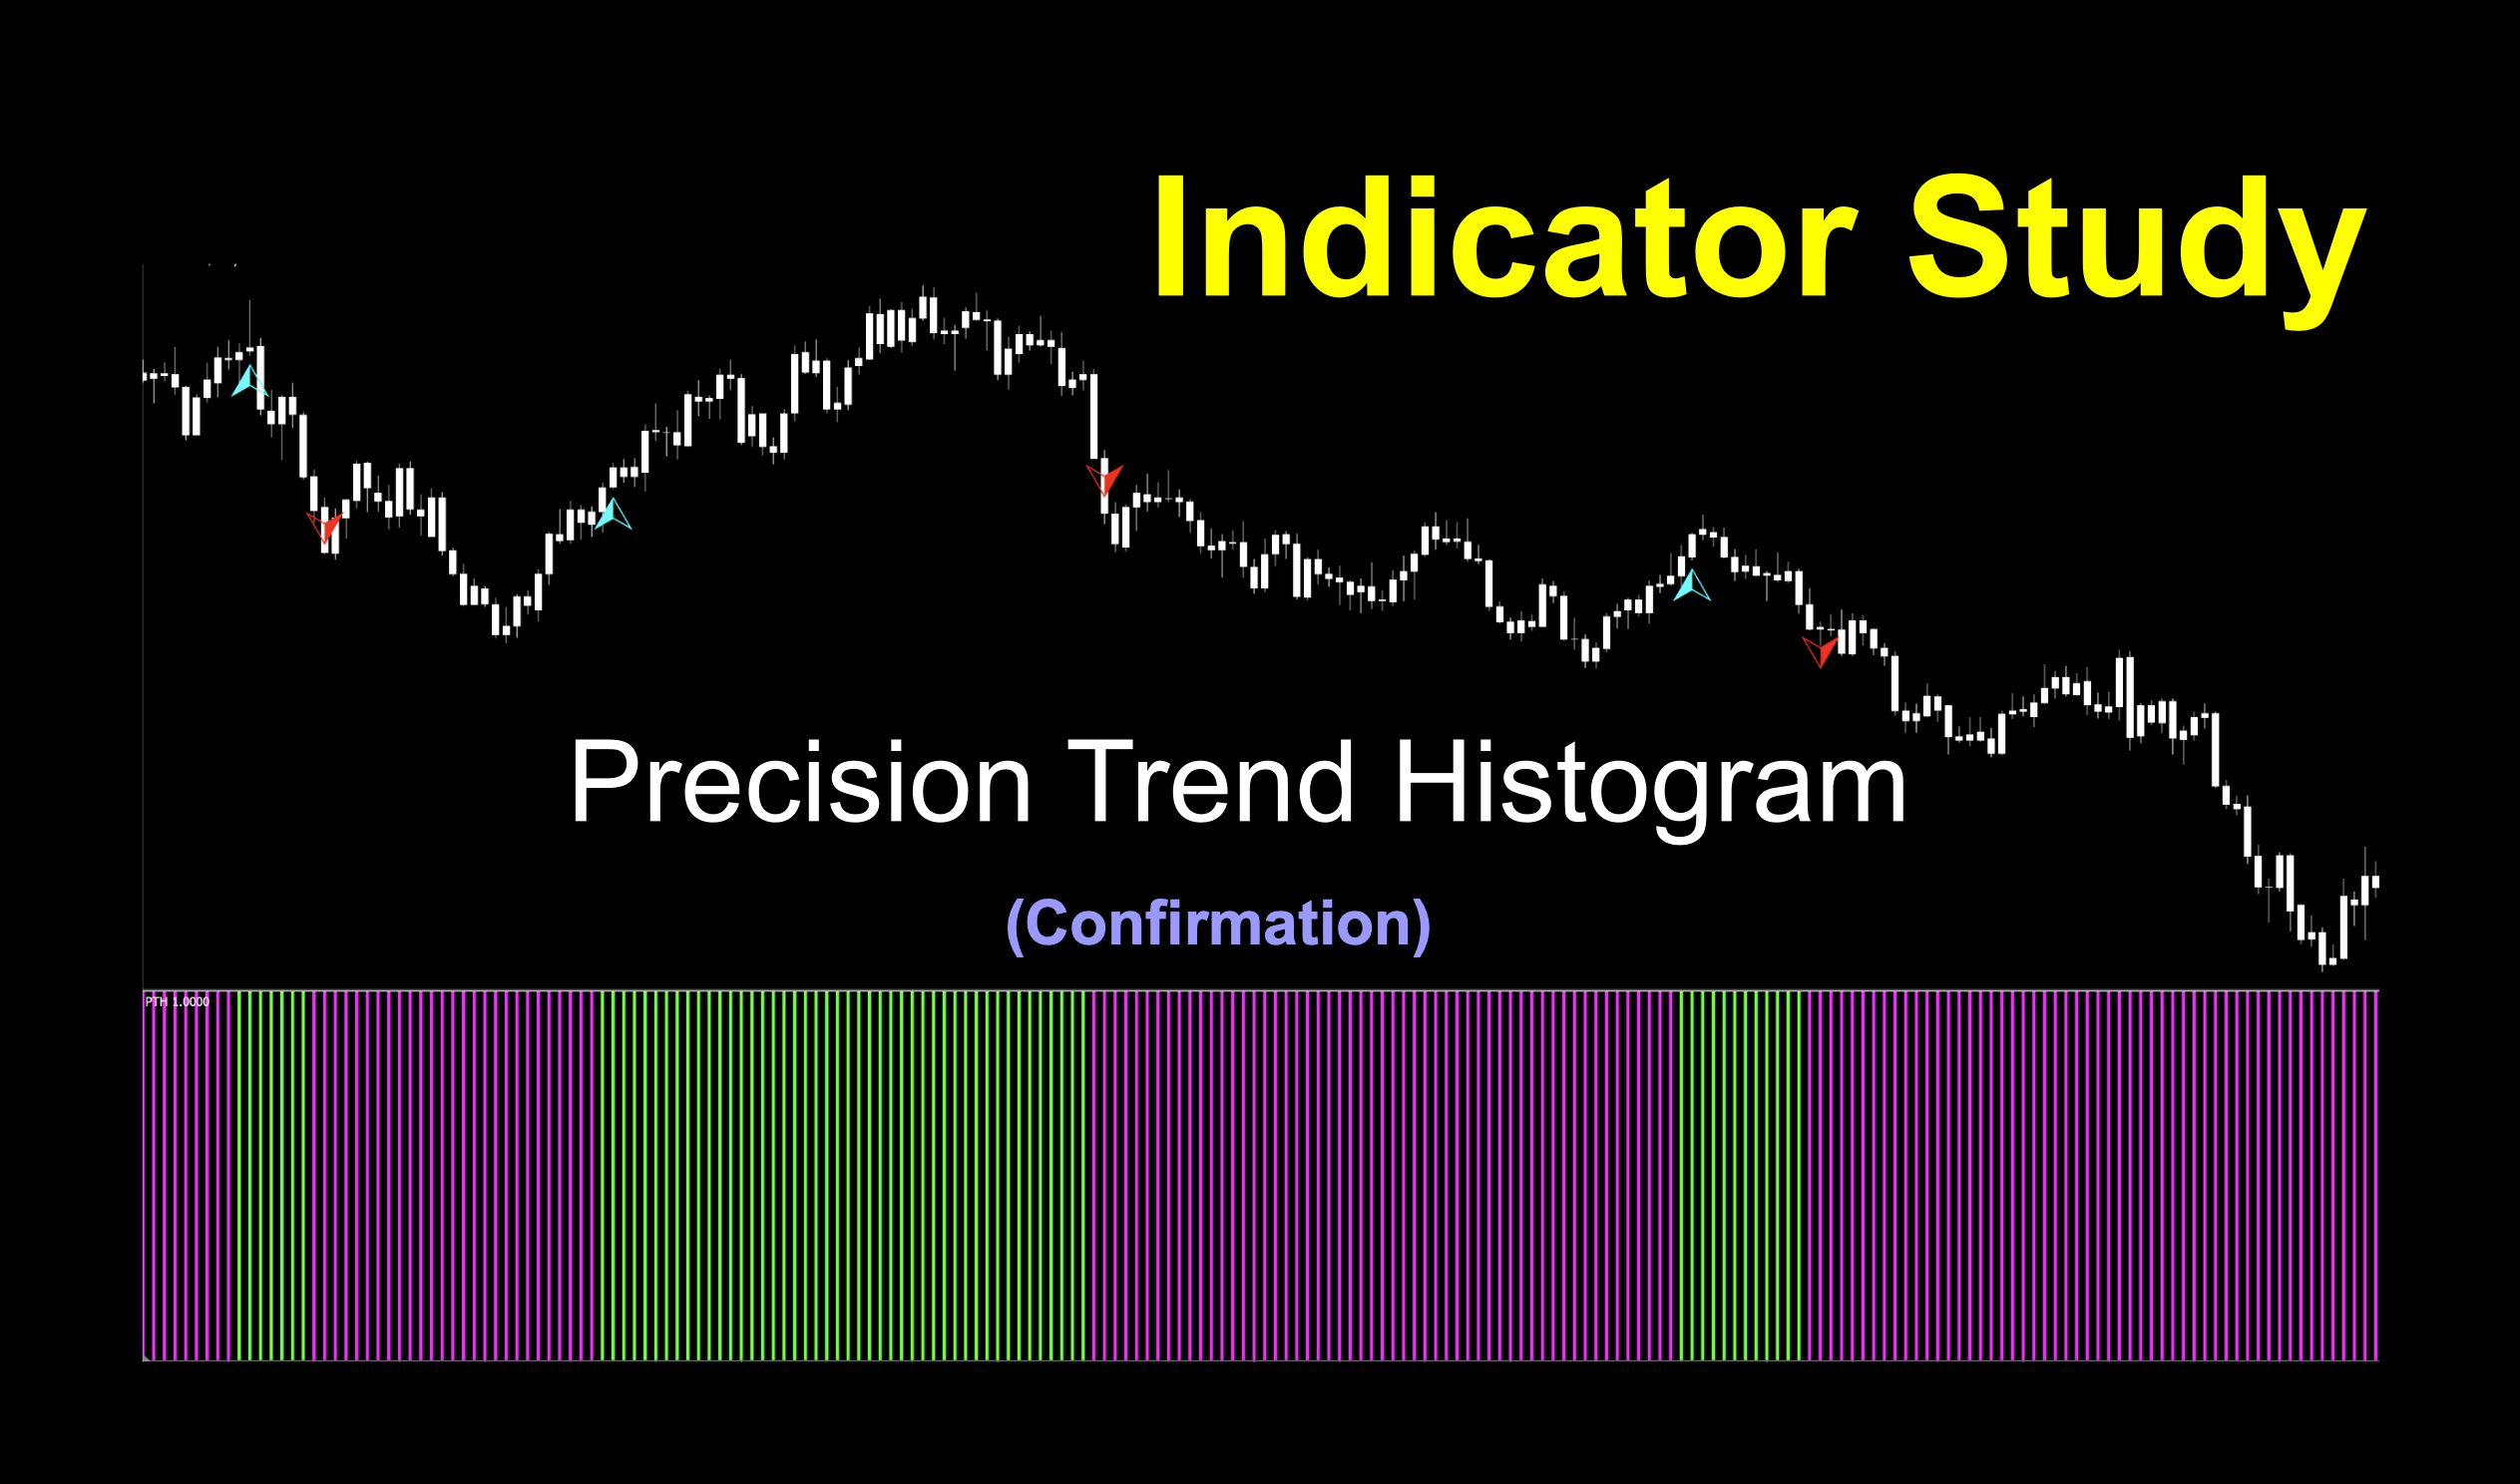
Precision Trend Histogram
If you’d like to follow along with the e-book version of the blog, click on the play button in the audio player below (at the bottom of the page).

Rolls Off The Tongue
This week’s indicator has a name that does just that…rolls off your tongue smooth as silk. Sounds great, looks great…let’s hope it does great as well. After all, what’s the point of a sexy indicator that is difficult and confusing to use, performs poorly and worst of all, has an appalling name? Shall we peek behind the curtain? Yes. Let’s.
Stumble and Bumble
We didn’t get this indicator through the new email address. This was found the old fashion way. Looking through site after site, page after page, until we kind of found each other. VP and I discussed it, looked at the results, and felt that it would qualify as one that our trading community may benefit from.
Keep ‘em Coming
But please, don’t let that stop you from sending something in. If you’re on the cusp of deciding, just throw your hat (indicator) into the ring. We look at EVERYTHING. After all, there are many eyes in our community that can collectively spot extraordinary things. Then send them over to us at stonehillindicator@gmail.com.
Histographic
It’s a word, but not really used. We should adopt this for our use. This sweet sounding histographic indicator is called the Precision Trend Histogram and was developed by an MT4 coder in 2018. There were a few updates, changes, and modifications made over the last few years, so the version we’re using was identified as a 2021 version.
Time to Couch Potato
Before going on, take a few minutes to watch the technical analysis video of the indicator in use. When you’ve finished watching, come on back to complete the blog. If you haven’t subscribed to the Stonehill Forex YouTube channel, be sure you click on the subscribe button, so you don’t miss new material.
Neon Knights
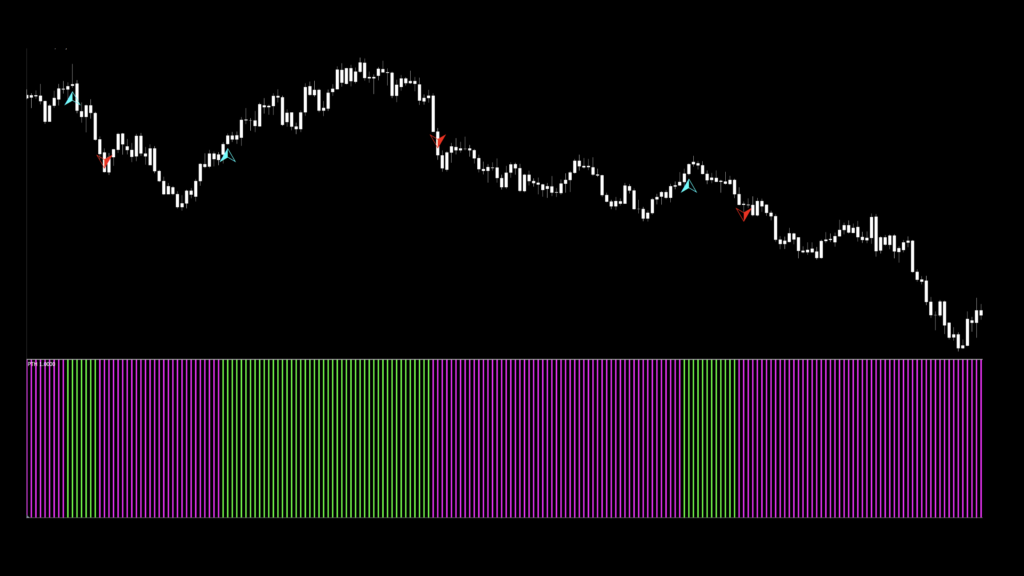
We’ve got an image of the default chart below. In addition to the histogram below the price window, there are arrows which coincide with the color change. They’re a little difficult to see, but in the marked up image, we’ve circled them for your viewing pleasure. We changed the colors from standard red/green to something brighter for ease of exhibition. Naturally, we left price white on white, so those of you who are easily distracted by all those extra colors will stay focused on what’s important.
The marked up chart will be coming up shortly, but first, let’s take a moment to look at the settings.
Settings
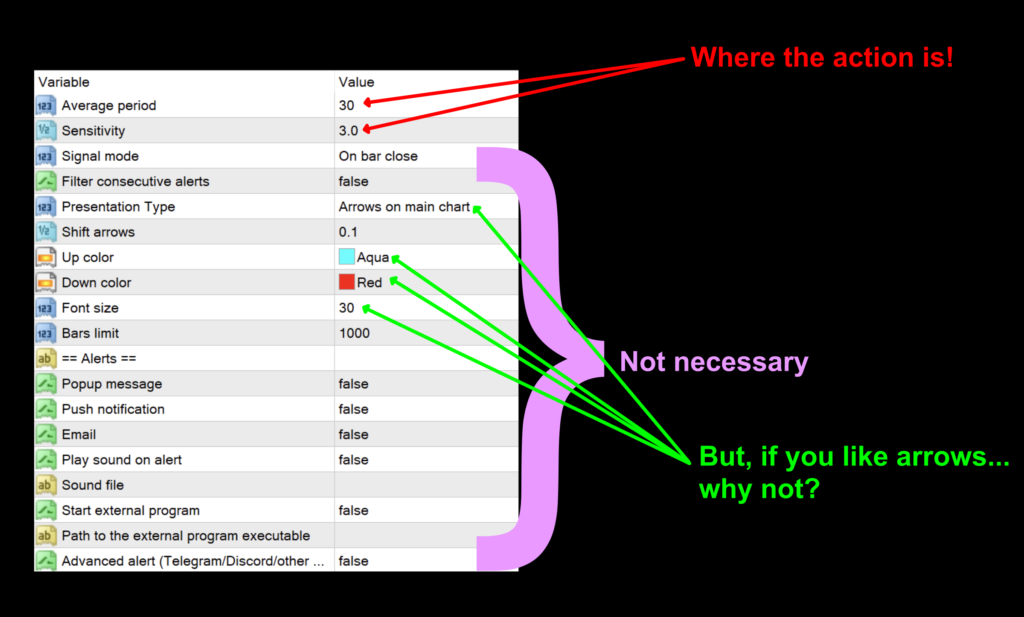
There are essentially three groups of settings; indicator parameters, visual choices, and alarms. If you find the arrows distracting, you can easily toggle them off, otherwise use them if they help. With regard to indicator parameters, we’ve got two, which are the meat and potatoes.
Average period: The number of periods used in calculating the histogram. The default setting is 30.
Sensitivity: This is the degree of “reactivity” the indicator responds to change in price. Too low a value, and it may give you too many signals. The default setting is 3.0.
Advantages
* Bold color changes make signal identification easy.
* Has potential as an exit indicator.
* Easy to use, and test.
Twin Signals
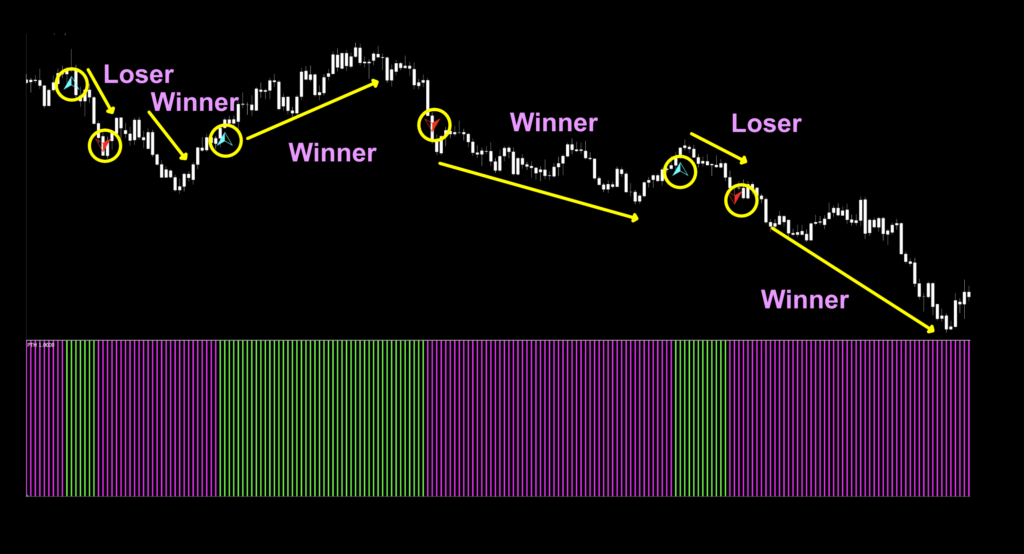
How We Use It
Long signal: When the histogram lines change from red to green (and/or a blue arrow appears), the entry occurs on the open of the next period.
Short signal: When the histogram lines change from green to red (and/or a red arrow appears), the entry occurs on the open of the next period.
Testing and Results
If you’re new to these studies, we recommend looking at some of the older blogs to understand how we conduct our testing.
The six pairs we recommend testing are…
EUR/USD
AUD/NZD
EUR/GBP
AUD/CAD
CHF/JPY
CAD/SGD
The markets we test our indicators are the:
EUR/USD (Euro/US Dollar)
BTC/USD (Bitcoin/US Dollar)
XAU/USD (Gold/US Dollar)
SPX500 (S&P500 Index)
Timeframes and Results
We’ll run the Precision Trend Histogram indicator on the EUR/USD, BTC/USD, XAU/USD, and the SPX500 using the default and tweaked settings across the daily and 4-hour timeframes on the MT4 strategy tester.
We focus on three metrics;
Total trades
Win/Loss ratio
ROI (return on investment)
Testing Outcomes
Below is the data from our testing.
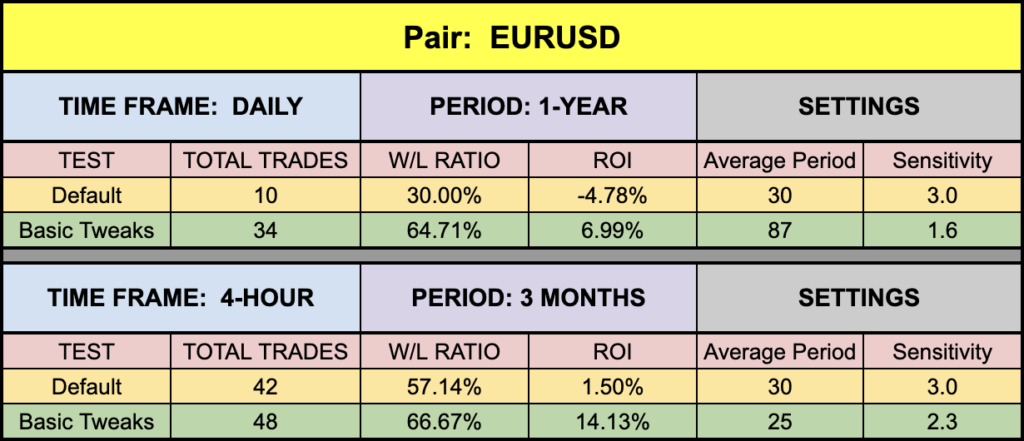
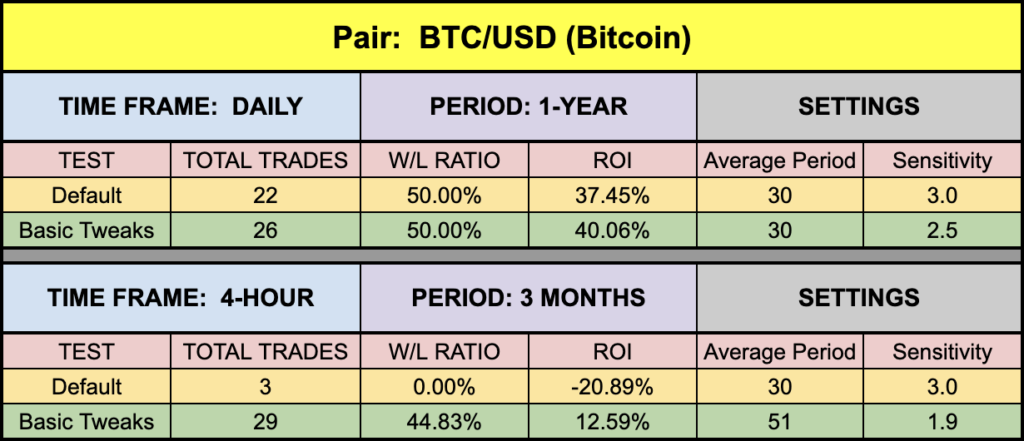
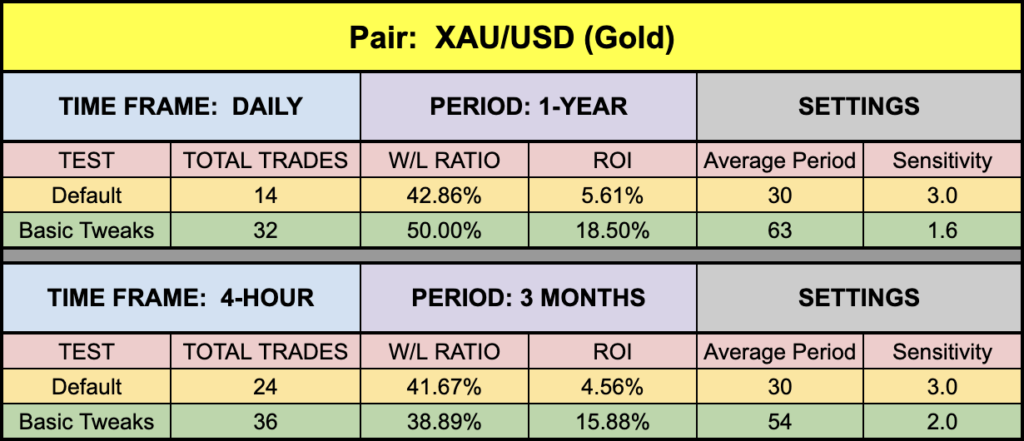
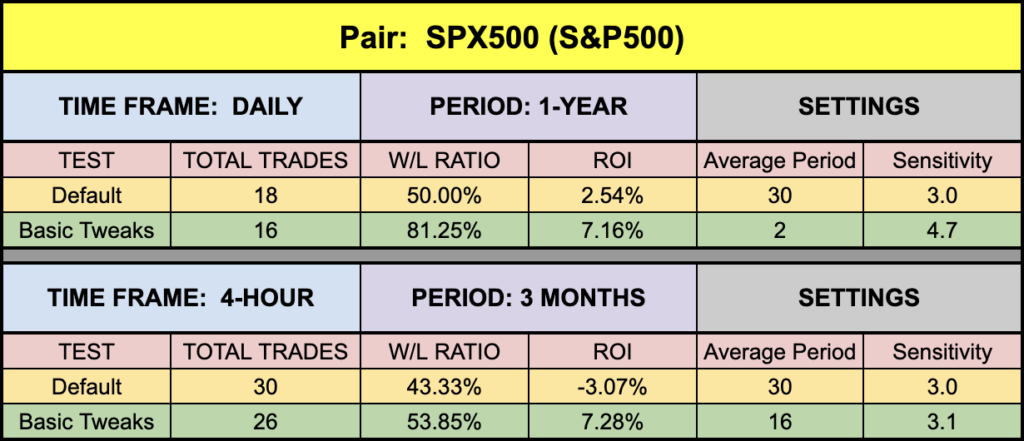
Optimized, Data Not Found
The green highlighted rows are tweaked values we used, which returned better results. There would be no point in posting fully optimized values as they change each day. What we’re doing is demonstrating that the indicators we find can be made better. This isn’t an absolute for every indicator, but for most cases, it is.
Money Management
Money management is based on the NNFX risk profile. That information can be learned in the Advanced Course.
Resources
We’ve made the Precision Trend Histogram indicator available for download on our site from the indicator library. When you’re ready to get it, click HERE.
We’re Here For You
Sign up on our contacts page on the website for the latest digests. Subscribe to our YouTube channel and Facebook page. We also answer questions on Quora related to Forex. Visit Trustpilot to see what others are saying about us as well. Consider giving us a 5-star review if we’ve helped you. Your contribution helps others find us for a safe place to learn.
Our only goal is to make you a better trader.
BTW – Any information communicated by Stonehill Forex Limited is solely for educational purposes. The information contained within the courses and on the website neither constitutes investment advice nor a general recommendation on investments. It is not intended to be and should not be interpreted as investment advice or a general recommendation on investment. Any person who places trades, orders or makes other types of trades and investments etc. is responsible for their own investment decisions and does so at their own risk. It is recommended that any person taking investment decisions consults with an independent financial advisor. Stonehill Forex Limited training courses and blogs are for educational purposes only, not a financial advisory service, and does not give financial advice or make general recommendations on investment.