
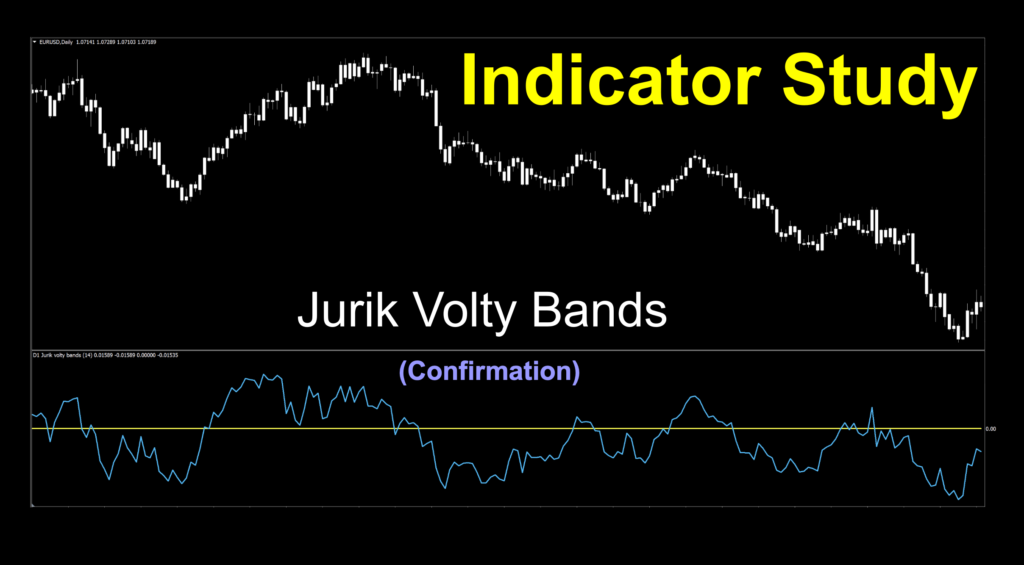
Jurik Volty Bands
If you’d like to follow along with the e-book version of the blog, click on the play button in the audio player below (at the bottom of the page).
Nail Salon, Tire Change, And Bait Shop
Who doesn’t love an all-in-one store where one can get all of their needs met? But, is it the best thing for an indicator? This week’s study revolves around one which claims to be great for trending, counter trending, scalping, range bound, and gauging market movements. That’s a lot of shoes to fill. As trend traders, we’re really only interested in one well fitting pair of shoes.
Thank You!
This blog comes courtesy of a user suggestion via the indicator email; stonhillindicator@gmail.com. Let’s show a little love to Emmanuel K. for the indicator submission, and the forethought to include the indicator file, so we didn’t have to go searching for it. Thank you, sir!
Sounds Electric
This week, we’ll be taking a look at a confirmation indicator called the Jurik Volty Bands. By the way, “volty” is just short for volatility, in case you weren’t aware. Jurik is actually the name of the developer; Mark Jurik…who became a prolific writer on such topics as neural networks, algorithms, indicators and other financial tools. He began publishing his works in 1988 through 1999 and retooled many indicators we use today. This particular indicator is based on work from the 90s and coded for multiple charting platforms. The earliest occurrence we could find for MT4 was in 2018.
Play, Replay
Below is the technical analysis video. Give it a watch and then come back to read the rest of the blog. We’ll be here waiting for you. If you haven’t subscribed to the Stonehill Forex YouTube channel, be sure you click on the subscribe button, so you don’t miss new material.
What’s In a Name
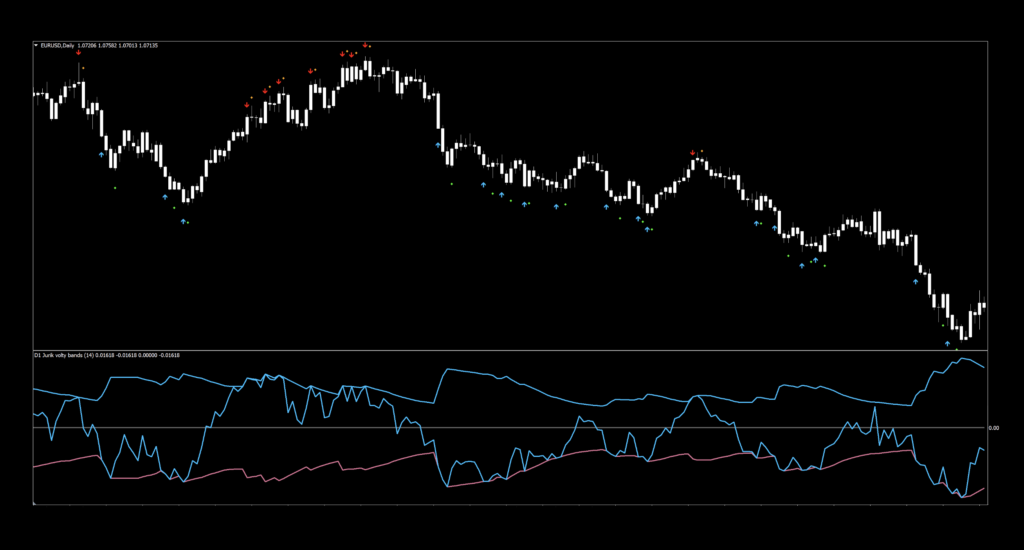
The name “bands” implies that a channel is formed by bands which constrain price, limiting its movement. This provides the graphic representation which appears on the default view (shown below). When price moves away from the band, it creates a signal for entry (reversal), as indicated by an arrow and a dot, suggesting an exit.
Crystal Ball Syndrome
The issue with all of this is that it is based on what might happen, not what has happened. And, as we know, trading on what might happen can be risky – think Cosmik Debris. So, we simplified this indicator into one which can be easier to use; a zero line cross.
Lots of Widgets
Below is the default view of the chart, with indicator below. Dots, arrows, and bands…oh my!
Clean Up Your Act
Below is a simpler version of the chart without the “distractions”. You’ll find that instead of trying to interpolate entries and exits as indicated by all those extra marks, we’ll just focus on the zero line.
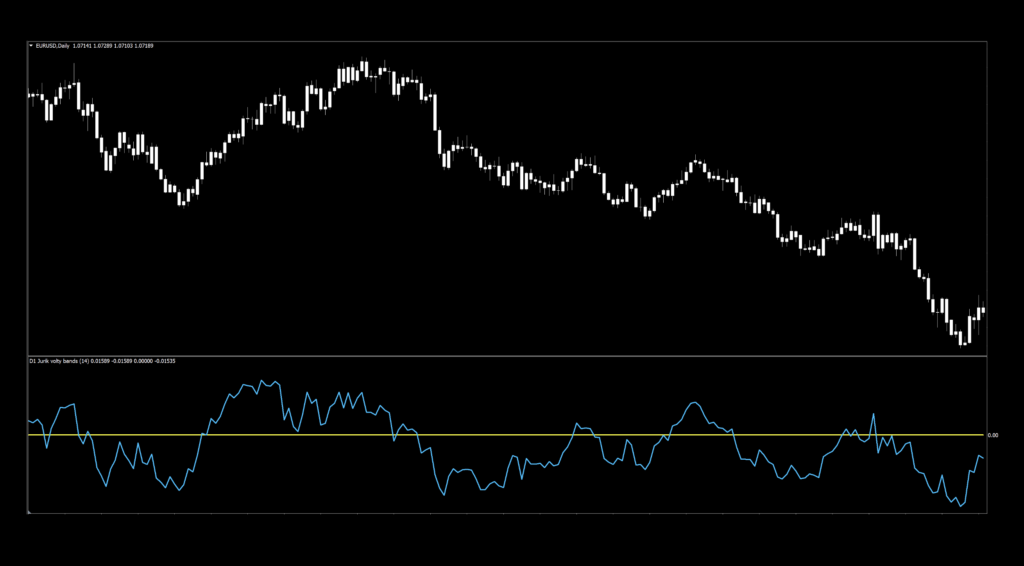
We’ll take a look at the mark-up of this chart, but before that, we’ll examine the settings.
Settings
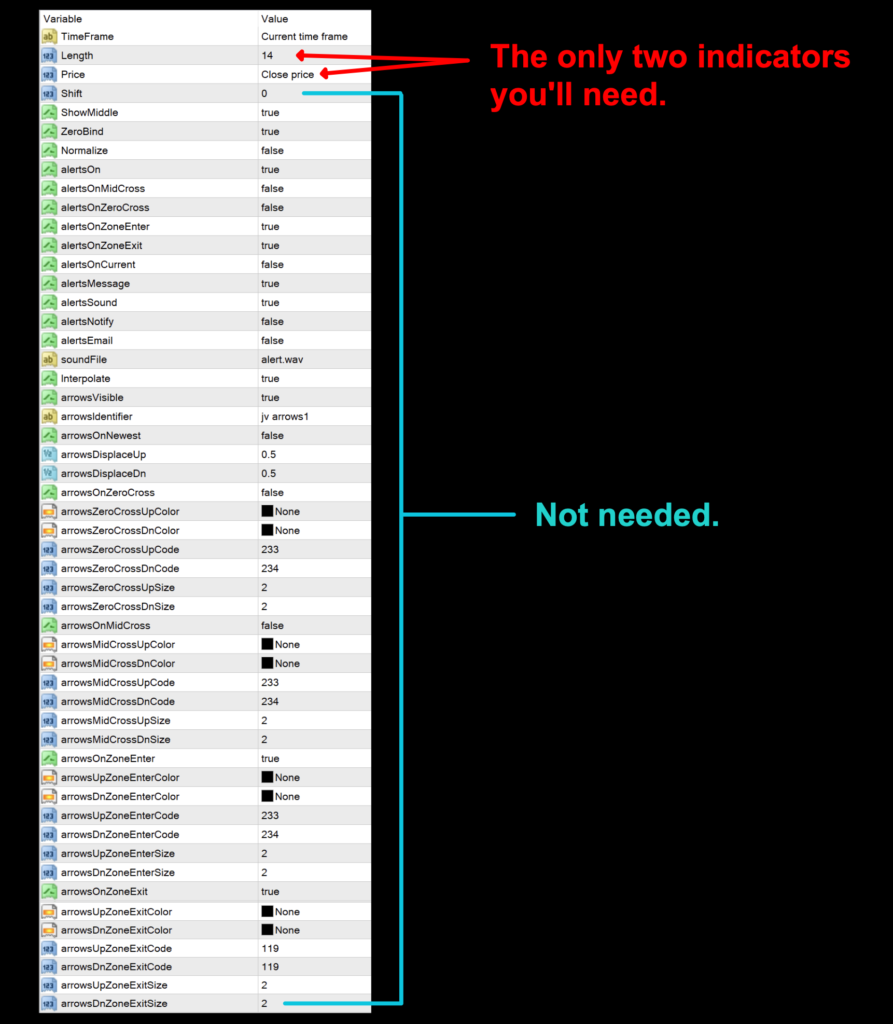
This indicator, by far, boasts the most settings we’ve come across. Thankfully, we only have to worry about two of them.
Length: The number of periods used in calculating the signal line. The default setting is 14.
Price: This is the specific price data set used for calculating the signal line; 0-Closed, 1-Open, 2-High, 3-Low, 4-Median, 5-Typical, and 6-Weighted. The default value is 0-Closed.
Advantages
* Simplified signals.
* Only two settings required for testing.
* Easy to use
Signal Spotting
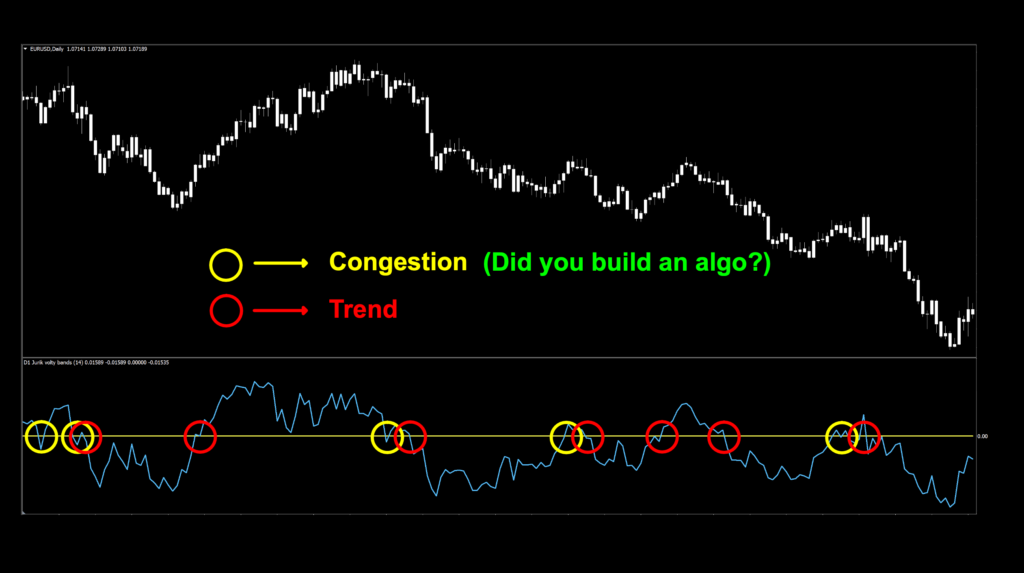
Don’t Get Mislead
A common occurrence with oscillating indicators is the multiple mid-line crossing signals. For those without an algorithm, these false entry signals can be frustrating. Having a proven algorithm is the only way to go. Not sure what we’re talking about? You’ll definitely want to read about the Advanced Course HERE.
How We Use It
Long signal: When the signal line crosses and closes above the zero line, the entry occurs on the open of the next period.
Short signal: When the signal line crosses and closes below the zero line, the entry occurs on the open of the next period.
Testing and Results
If you’re new to these studies, we recommend looking at some of the older blogs to understand how we conduct our testing.
The six pairs we recommend testing are…
EUR/USD
AUD/NZD
EUR/GBP
AUD/CAD
CHF/JPY
CAD/SGD
The markets we test our indicators are the:
EUR/USD (Euro/US Dollar)
BTC/USD (Bitcoin/US Dollar)
XAU/USD (Gold/US Dollar)
SPX500 (S&P500 Index)
Timeframes and Results
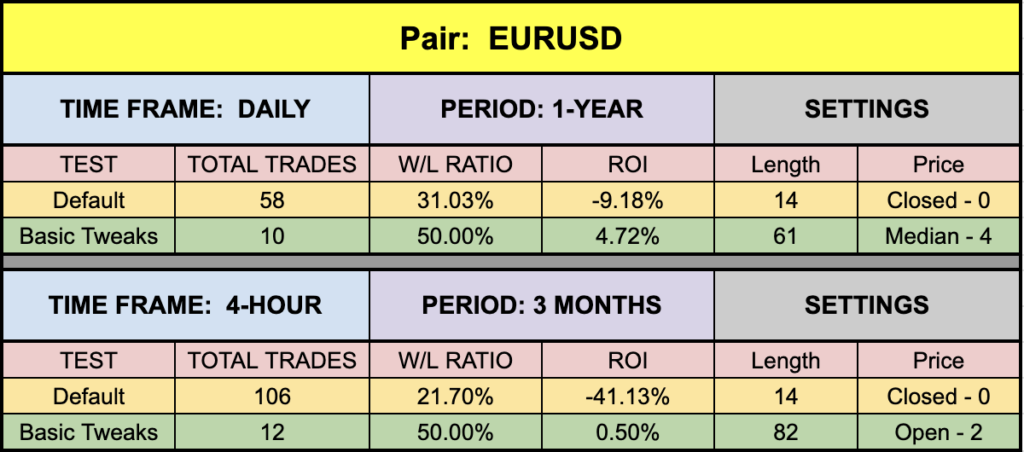
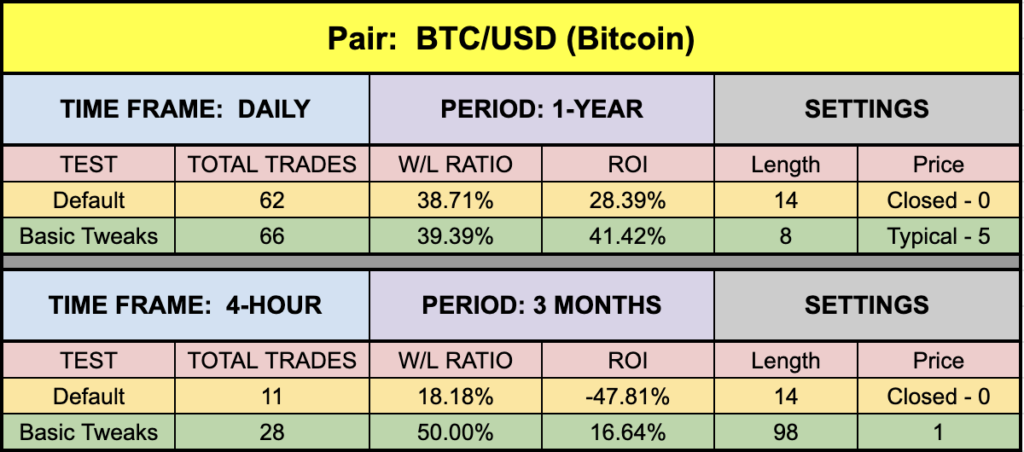
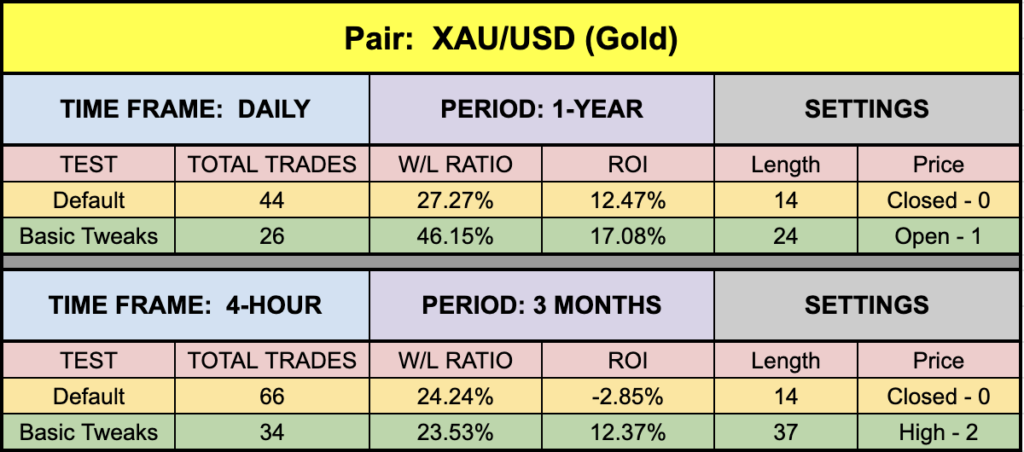
We’ll run the Jurik Volty Bands indicator on the EUR/USD, BTC/USD, XAU/USD, and the SPX500 using the default and tweaked settings across the daily and 4-hour timeframes on the MT4 strategy tester.
We focus on three metrics;
Total trades
Win/Loss ratio
ROI (return on investment)
Testing Outcomes
Below is the data from our testing.
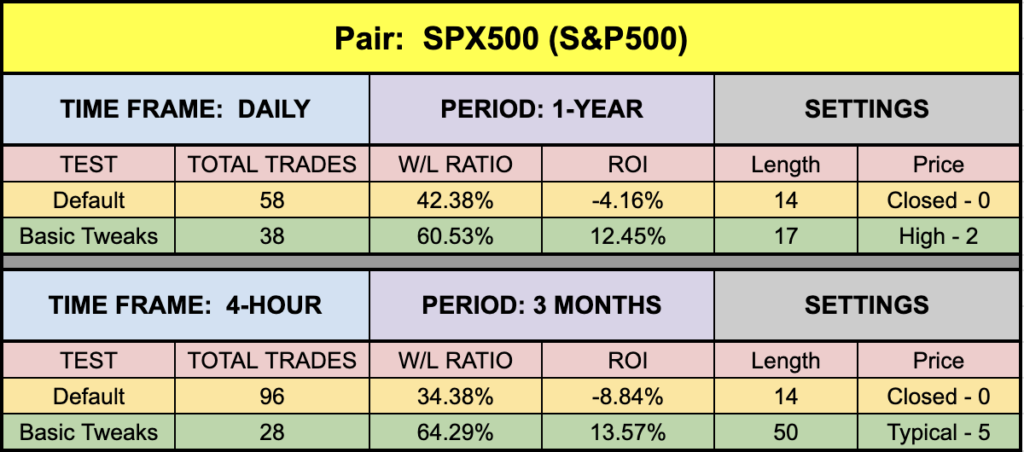
Optimized, Data Not Found
Remember, green highlighted rows are the tweaked values we found which returned better results. There would be no point in posting fully optimized values as they change each day. What we’re doing is demonstrating that the indicators we find can be made better. Not in every case, but in most cases.
Not Applicable
If you see a “N/A”, then we could not find values that worked in that market or in the testing time span. If you see it, move on. It happens, and that’s okay. Remember, you’re testing this across many pairs, and each pair has its own characteristics.
Money Management
Money management is based on the NNFX risk profile. That information can be learned in the Advanced Course.
Resources
We’ve made the Jurik Volty Bands indicator available for download on our site from the indicator library. When you’re ready to get it, click HERE.
We’re Here For You
Sign up on our contacts page on the website for the latest digests. Subscribe to our YouTube channel and Facebook page. We also answer questions on Quora related to Forex. Visit Trustpilot to see what others are saying about us as well. Consider giving us a 5-star review if we’ve helped you. Your contribution helps others find us for a safe place to learn.
Our only goal is to make you a better trader.
BTW – Any information communicated by Stonehill Forex Limited is solely for educational purposes. The information contained within the courses and on the website neither constitutes investment advice nor a general recommendation on investments. It is not intended to be and should not be interpreted as investment advice or a general recommendation on investment. Any person who places trades, orders or makes other types of trades and investments etc. is responsible for their own investment decisions and does so at their own risk. It is recommended that any person taking investment decisions consults with an independent financial advisor. Stonehill Forex Limited training courses and blogs are for educational purposes only, not a financial advisory service, and does not give financial advice or make general recommendations on investment.