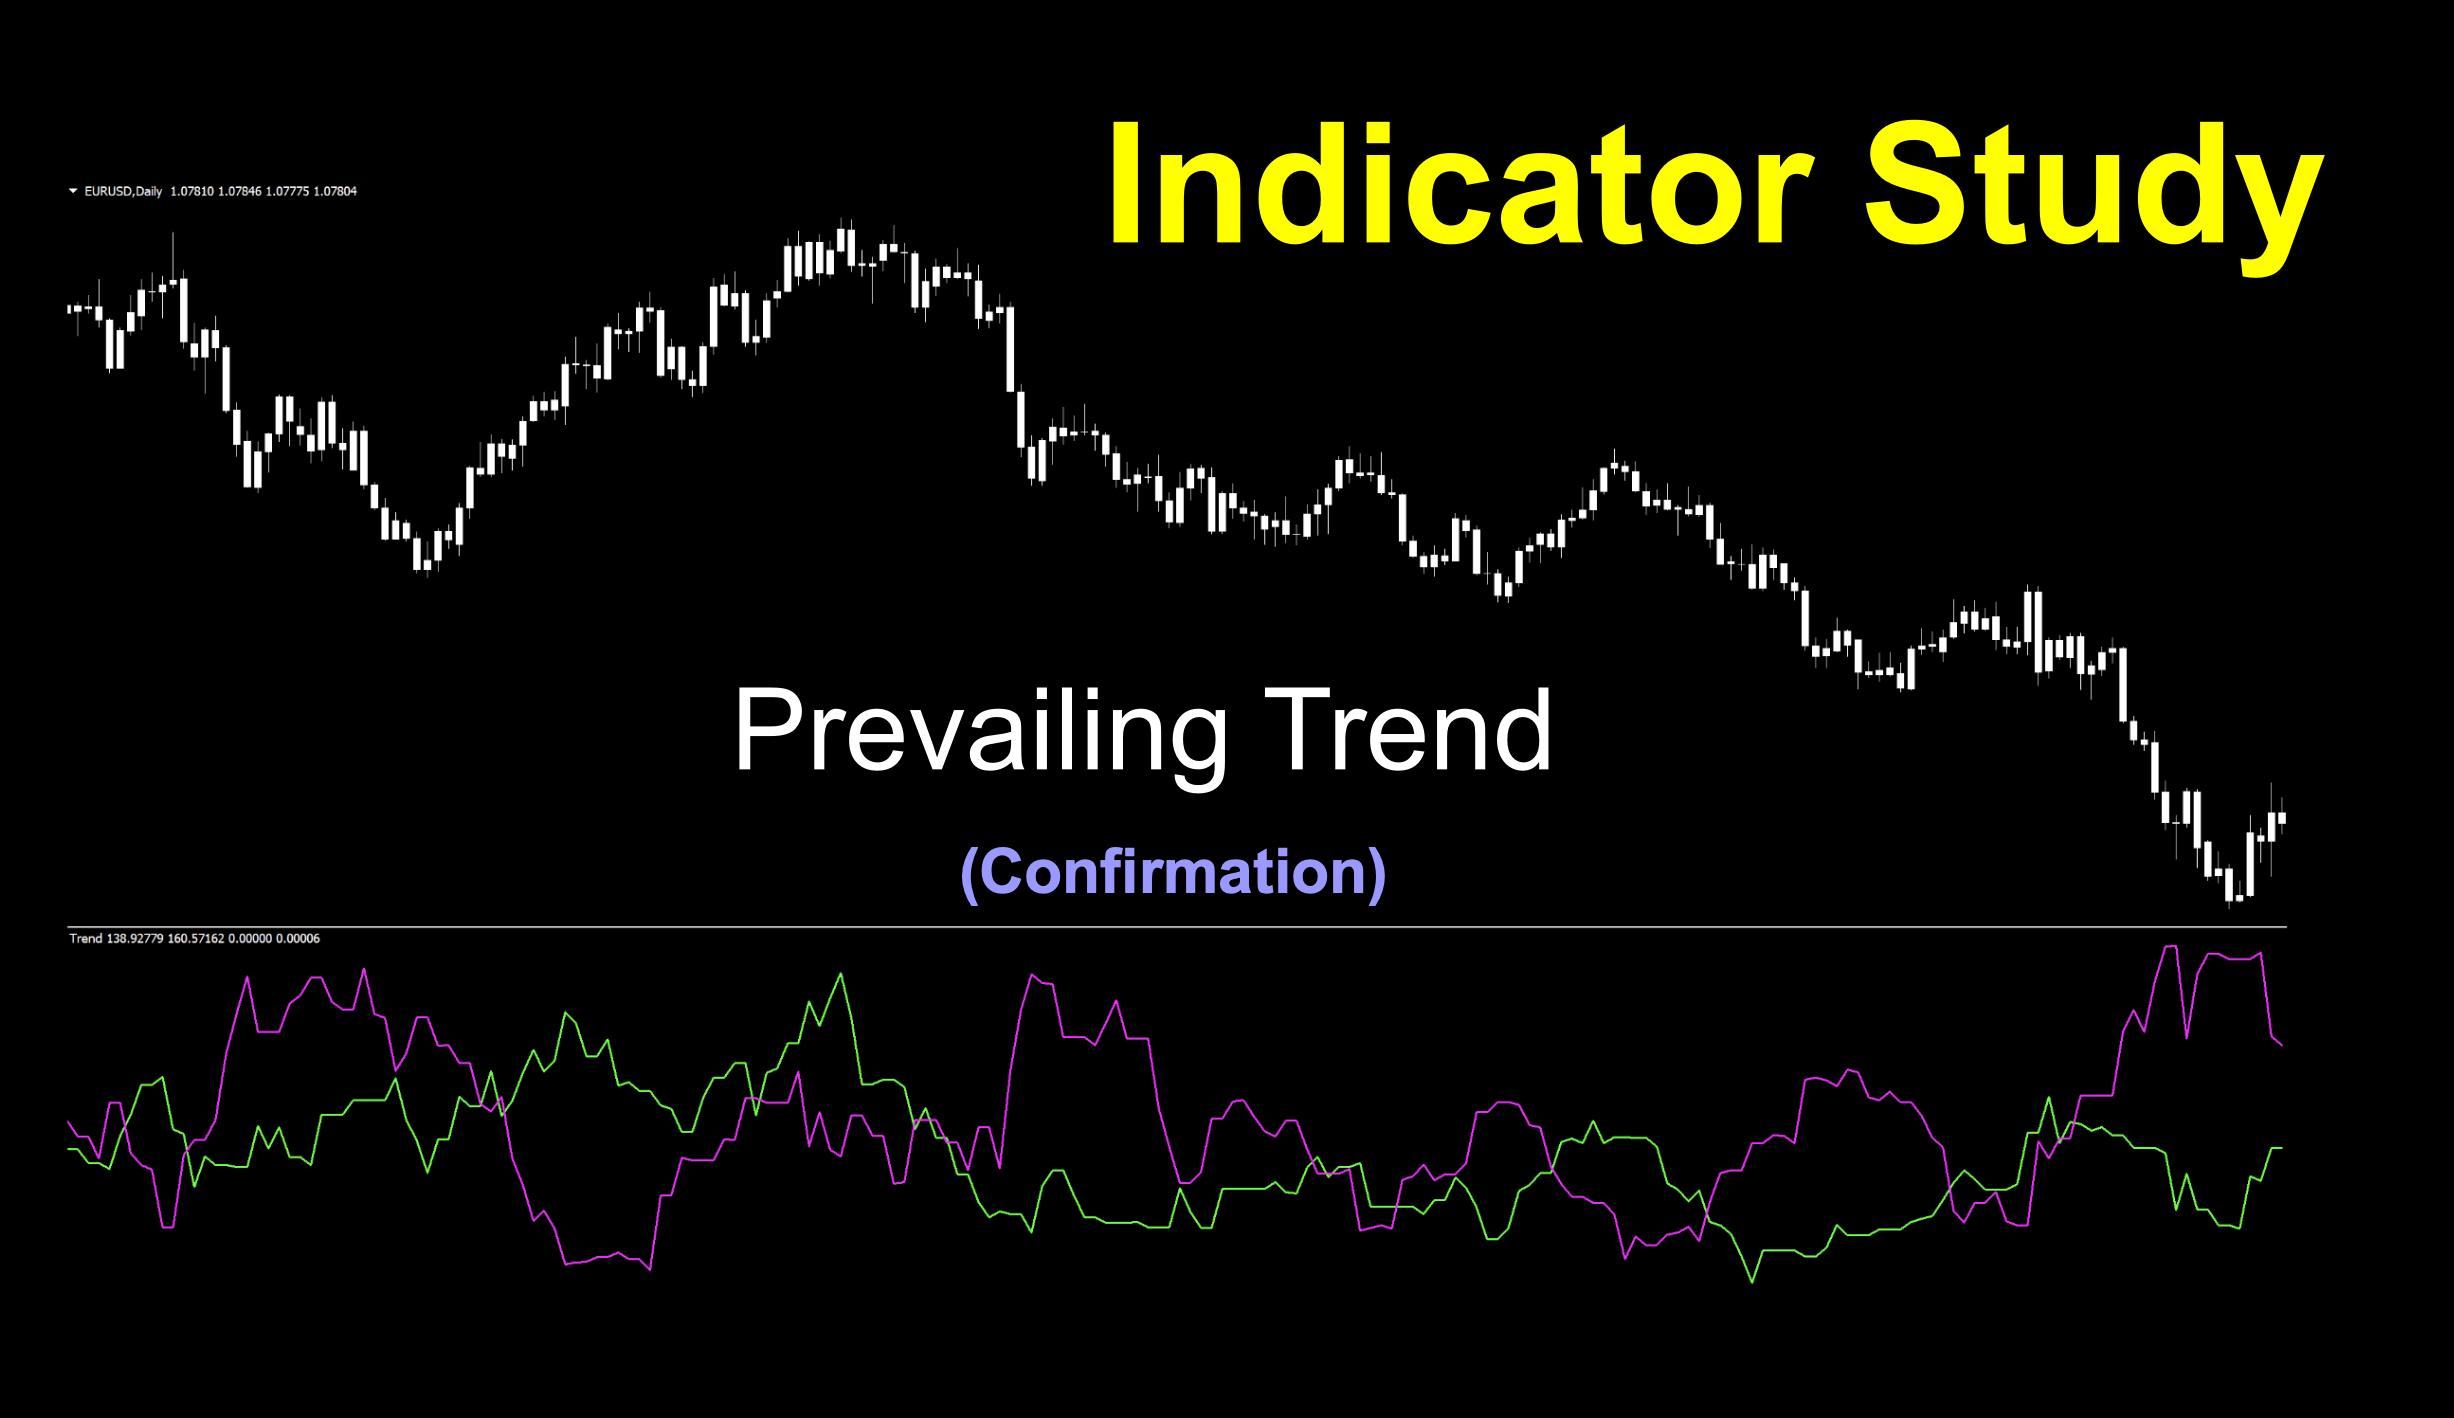
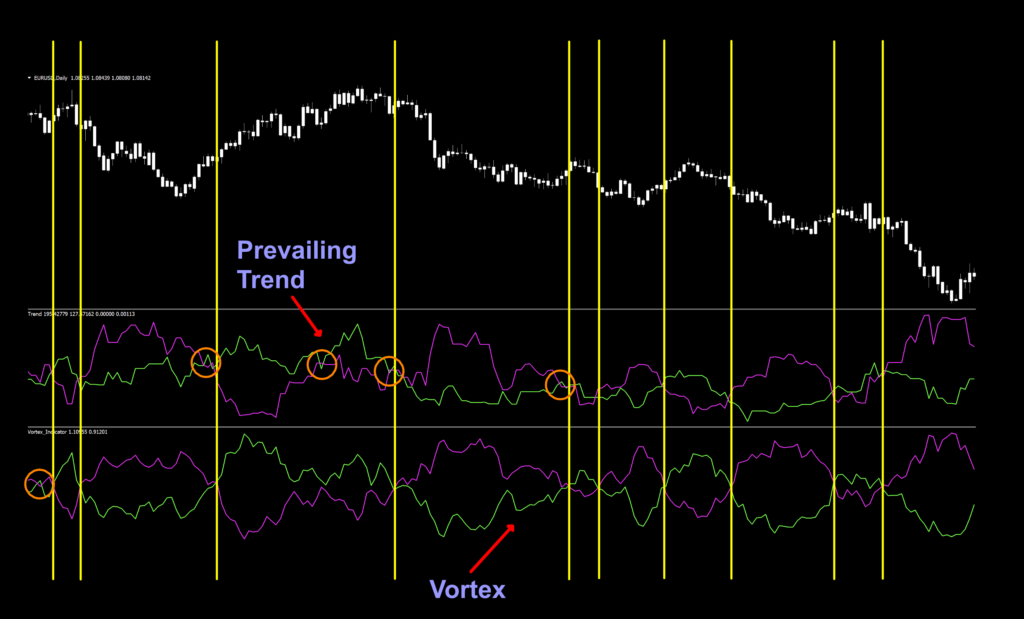
Prevailing Trend
If you’d like to follow along with the e-book version of the blog, click on the play button in the audio player below (at the bottom of the page).

Generally Accepted Opinion
Okay, I’ll bite. The formal name of this week’s indicator has a first and last name. To its friends, it’s just known as “Trend”. It can’t get any simpler than that.
Seek and Find
This was another indicator we just kind of stumbled across during our lengthy searches. I know we post a lot of mid-line or zero cross indicators, so we’re trying to mix it up a bit. It’s not so much the appearance of the indicator (not always) but rather we try to find indicators that use different math. The whole concept of having more than one entry confirmation indicator is to have different math. One compliments the other. Kind of like that best friend who keeps you from doing questionable things…like too many Tequila shots on a dare.
Don’t Stop Emailing
We’ve received a handful of suggestions in the last week – which is fantastic. Don’t stop sending them. We maintain a spreadsheet of potential candidates based on what we find and what you send us. Even if you’re not sure if it’s any good, don’t that dissuade you from sending it to us. Nothing is discounted until we run it through its paces. Send those nuggets of goodness to us at stonehillindicator@gmail.com.
Up, Down & All Around
Based on the basic moving average, but with a twist. This two-line cross confirmation indicator works in both directions at the same time to create its signals and was created by one of many MT4 coders in 2013. And what’s nice about that particular version is that you get to pick which kind of moving average you are using when calculating the signal lines.
UP Line = moving average of UP candles for a specific number of periods.
DOWN Line = moving average of DOWN candles for a specific number of periods.
Time Lapse
Educationally and practically speaking, a picture can be worth a thousand words. That being said, many pictures make it easier to explain those words. And that being the case, take a few minutes to watch the technical analysis video to see how this indicator does its thing. Once it’s done, continue on. We’ll be here waiting patiently for you. And, if you haven’t subscribed to the Stonehill Forex YouTube channel yet, be sure you subscribe, so you don’t miss new material.
Criss Cross Applesauce
The default chart is pretty much left as the coder intended, but you know us, we just modified the colors a bit to make them brighter. Price is not the star here, so its colors are on a coffee break, and we’ll just settle for white on white.
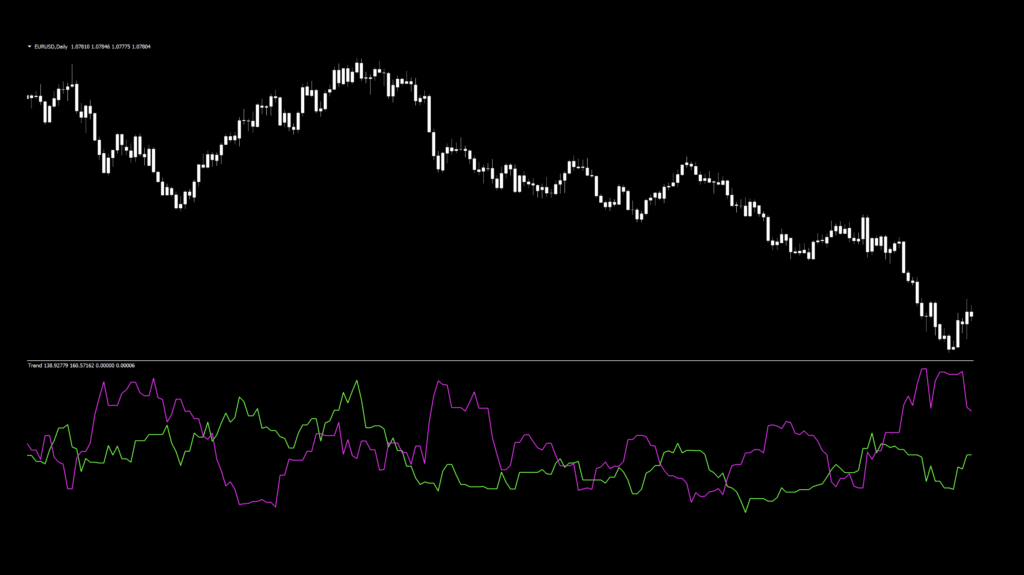
We’ll take a look at the marked up chart momentarily, but first, the settings.
Settings
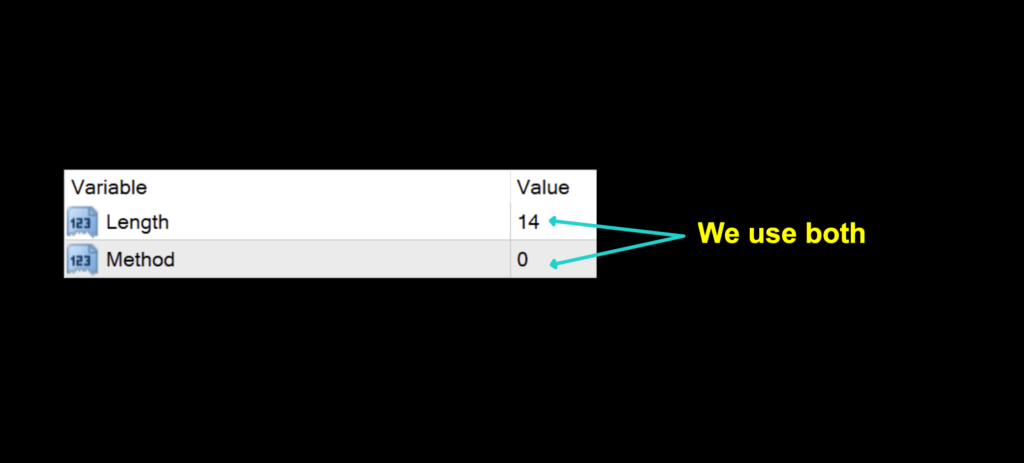
There are only two settings involved. We use both of them.
Length: The number of periods used in calculating both the UP and DOWN lines. The default setting is 14.
Method: This is the data set used to calculate the type of moving average. 0-Closed, 1-Open, 2-High, and 3-Low. The default value is 0-Closed.
Advantages
* Employs the most popular and easy to understand indicator components (moving averages).
* Can be used an exit indicator.
* Few settings make it easy to test.
Signaling Potential Trades
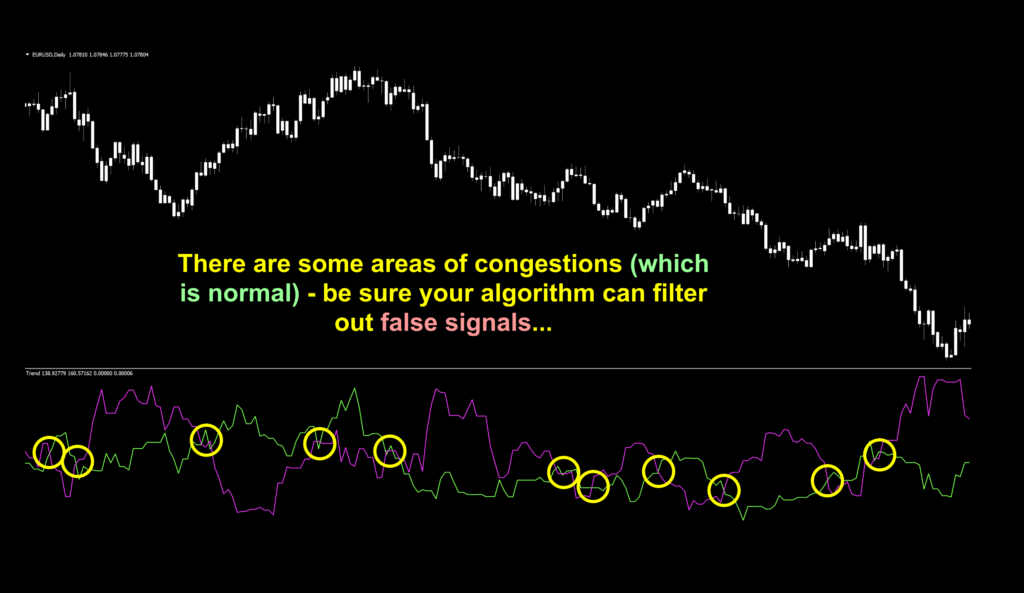
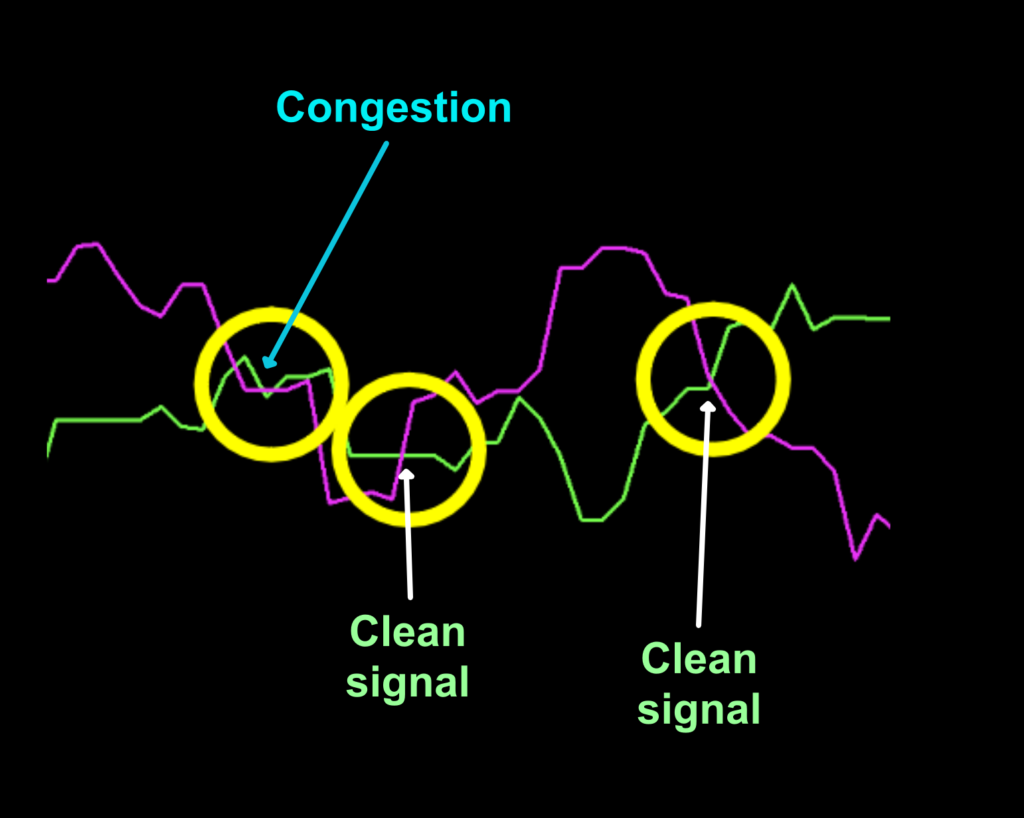
As signals within congestion can be difficult to see, we’ll zoom in on what clear signals look like compared to those which may result in losing trades.
Where multiple signals arise; which is a natural occurrence, you have some options.
1. Change settings in the indicator’s parameters to filter reversals. This places a pronounced relevance on why we strongly advocate backwards AND forward testing, as thoroughly discussed in the advanced course.
2. Change the position of this indicator in your algorithm. Does it do better as C1 or C2? Try it both ways. Indicators can have either a symbiotic relationship or…
3. Perhaps it is better served as a stand-alone exit indicator.
How We Use It
Long signal: When the green line crosses and closes above the red line, the entry occurs on the open of the next period.
Short signal: When the red line crosses and closes above the green line, the entry occurs on the open of the next period.
Testing it Out
If you’re new to these studies, we recommend looking at some of the older blogs to understand how we conduct our testing.
The six pairs we recommend testing are…
EUR/USD
AUD/NZD
EUR/GBP
AUD/CAD
CHF/JPY
CAD/SGD
The markets we test our indicators are the:
EUR/USD (Euro/US Dollar)
BTC/USD (Bitcoin/US Dollar)
XAU/USD (Gold/US Dollar)
SPX500 (S&P500 Index)
Timeframes and Results
We’ll run the Prevailing Trend indicator on the EUR/USD, BTC/USD, XAU/USD, and the SPX500 using the default and tweaked settings across the daily and 4-hour timeframes on the MT4 strategy tester.
We focus on three metrics;
Total trades
Win/Loss ratio
ROI (return on investment)
What We Got
Below are the spreadsheets from our tests.
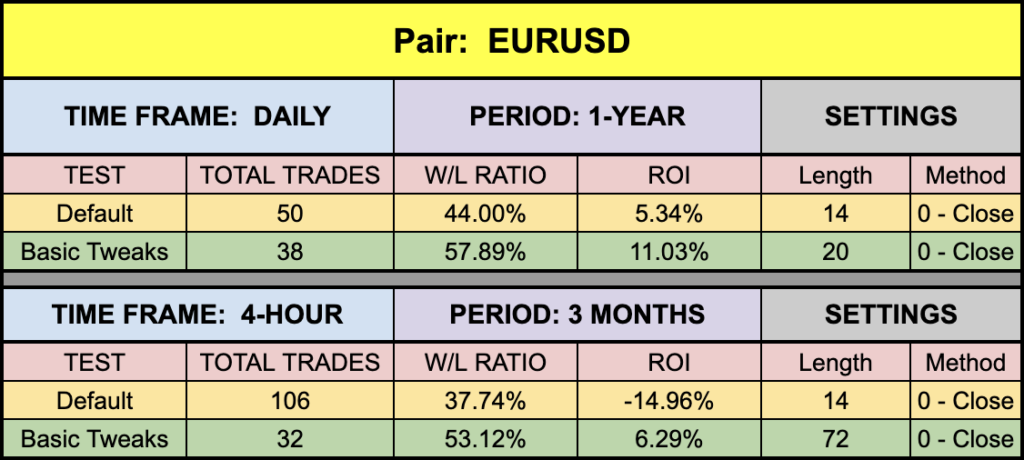
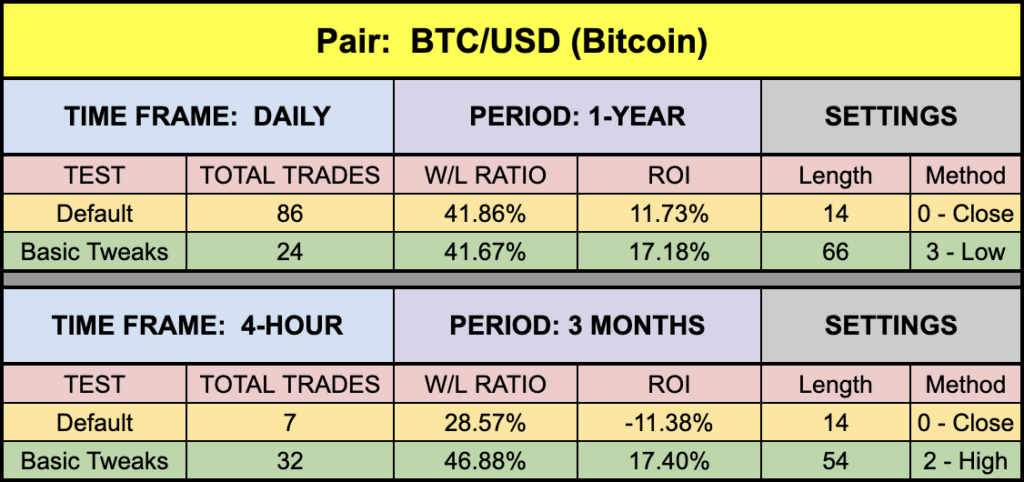
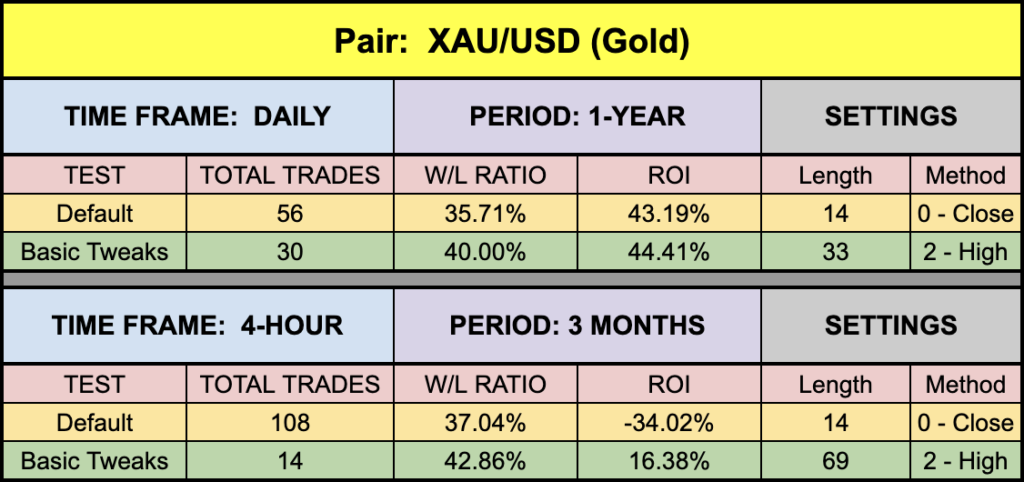
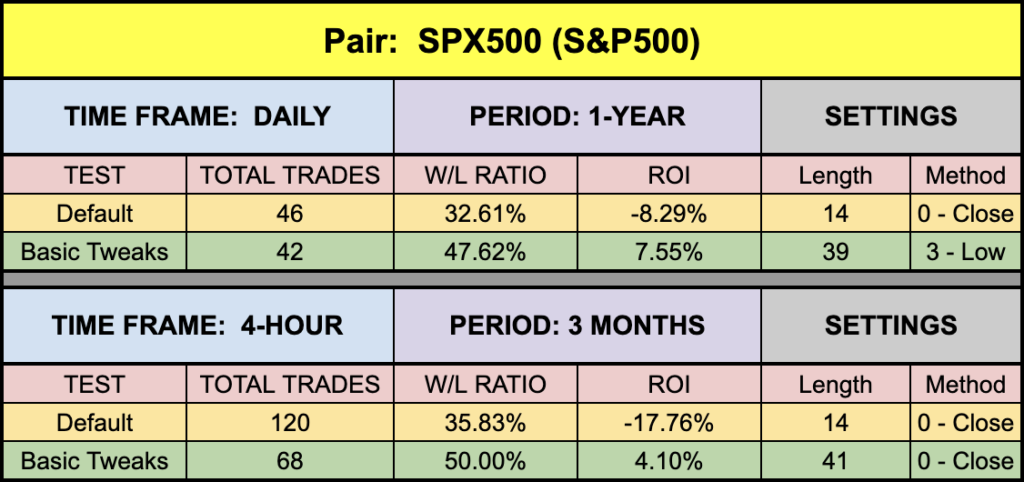
Better Values, Better Odds
The green highlighted rows are tweaked values we tried and, in those cases, returned better results. We receive emails asking about the “best” settings. Our response is always the same. We don’t post the highest settings because it doesn’t serve the purpose of what we’re doing. We are demonstrating that the indicators we find can be made better. This isn’t an absolute for every indicator, but for most cases, it is.
Ode To Randall
Given the fact that one of our followers mentioned that the Vortex Indicator (profiled nearly a year ago) had similar signals, we had to check it out for ourselves. We laid both indicators on a chart (with their default settings) and sure enough, many of the signals were within a candle or two; however, there were a few additional signals on the Prevailing Trend indicator. When we compared the math, similar calls to moving average functions were noted with some minor differences, but the biggest deal is that the Prevailing Trend indicator has the ability to use the different price data sets. While both indicators defaulted to the “closed” set, the Prevailing Trend indicator offered the ability to use “open”, “high” and “low” data sets as well, giving more overall control of the indicator. We’ve put up a marked up screenshot for your review and a big thank you to Randall who gets an “A” in class today.
Money Management
Money management is based on the NNFX risk profile. That information can be learned in the Advanced Course.
Resources
We’ve made the Previaling Trend indicator available for download on our site from the indicator library. When you’re ready to get it, click HERE.
We’re Here For You
Sign up on our contacts page on the website for the latest digests. Subscribe to our YouTube channel and Facebook page. We also answer questions on Quora related to Forex. Visit Trustpilot to see what others are saying about us as well. Consider giving us a 5-star review if we’ve helped you. Your contribution helps others find us for a safe place to learn.
Our only goal is to make you a better trader.
BTW – Any information communicated by Stonehill Forex Limited is solely for educational purposes. The information contained within the courses and on the website neither constitutes investment advice nor a general recommendation on investments. It is not intended to be and should not be interpreted as investment advice or a general recommendation on investment. Any person who places trades, orders or makes other types of trades and investments etc. is responsible for their own investment decisions and does so at their own risk. It is recommended that any person taking investment decisions consults with an independent financial advisor. Stonehill Forex Limited training courses and blogs are for educational purposes only, not a financial advisory service, and does not give financial advice or make general recommendations on investment.