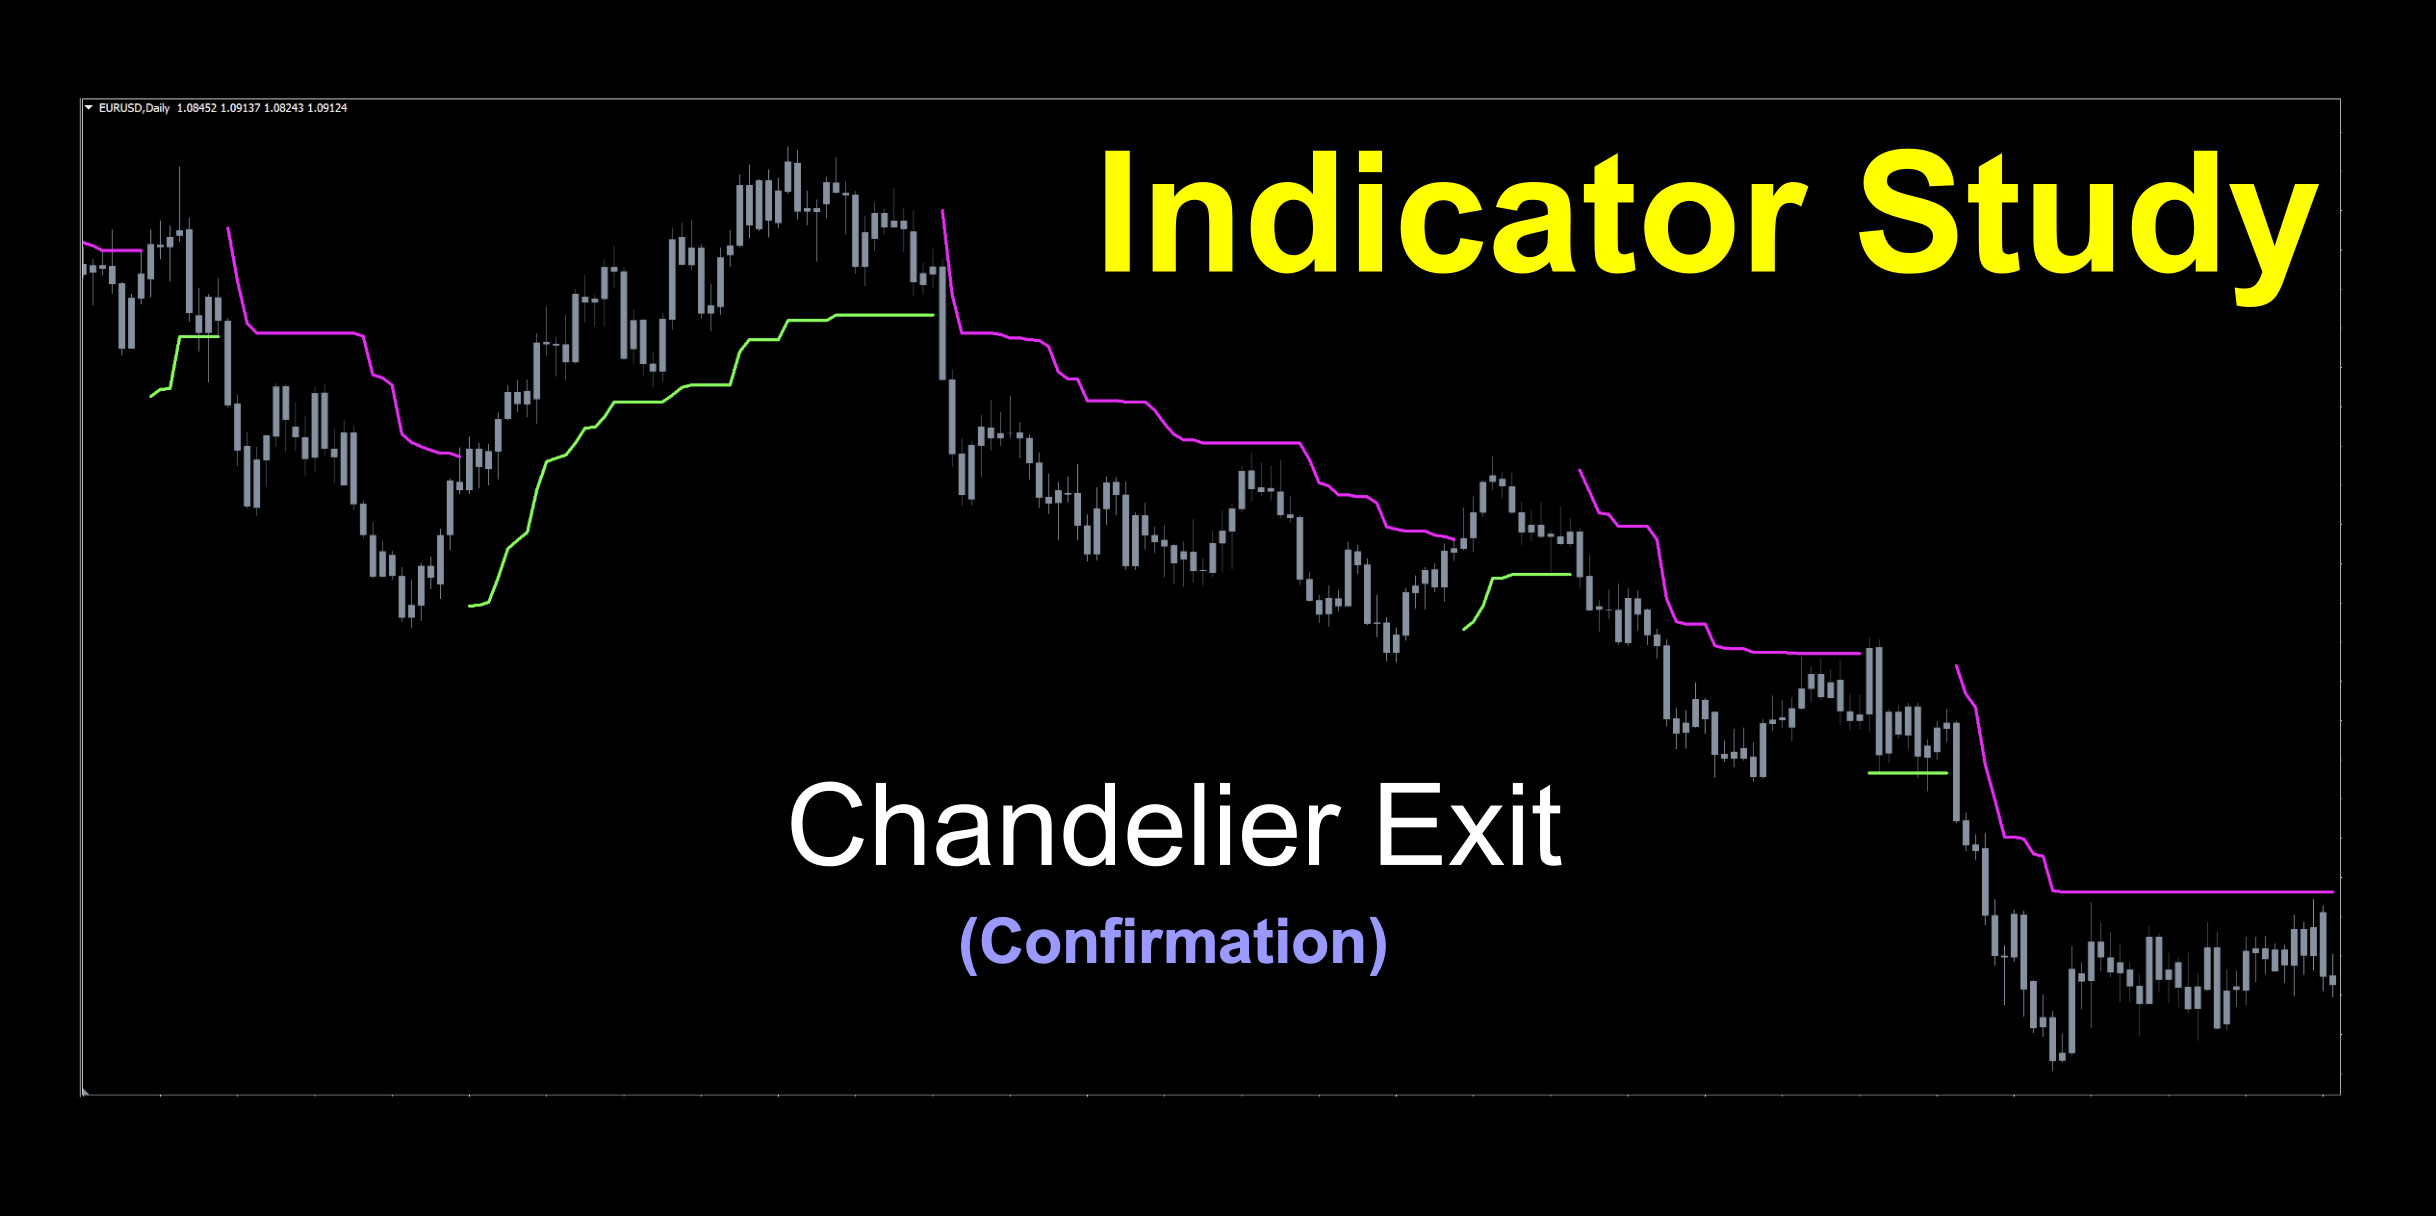
Chandelier Exit
If you’d like to follow along with the e-book version of the blog, click on the play button in the audio player below (at the bottom of the page).

Keeping With The Trend
Finding trending indicators is what we’re all about. We’ve got one this week, which is billed as an exit indicator. Okay, sure…whatever. Technically speaking, pretty much any confirmation indicator can be used as an exit indicator. But are they the best for the job? That’s the part we (that’s both you and we) aim to find out through testing and observation. You’ll see further down in the blog that this indicator’s intended purpose doesn’t really work for us because we have other ideas for calculating exits. Confused? Don’t be. We’ll make sense of it all, because…that’s what we do here.
Friends for a Cause
We’re going to take a look at the Chandelier Exit indicator. Odd name, right? It turns out that the “Chandelier” in the namesake was actually a reference to that light thing which hangs in one’s house.

Perhaps it was a cheeky nod to the book, “Come into My Trading Room” written by Alexander Elder in 2002. Trading room…chandelier? Maybe? Maybe not. Whatever. The concept was originally developed by Charles (Chuck) Le Beau a bit earlier, but Mr. Elder brought it to us lucky traders. Good book, by the way. The MT4 version came to us in 2008, which is the version we’re looking at. There are numerous versions out there, with various functionalities added, but we’re trying to stay true to the original concept.
Pretty Simple
The formula is three simple parts; a period high or low, the ATR (our favorite), and a multiplier. The actual formula is:
Chandelier Exit (long) = 22-day High – ATR(22) x 3
Chandelier Exit (short) = 22-day Low + ATR(22) x 3
Notice that the default numbers are 22 and 3. ATR(22) was chosen because there are 22 trading days in a month, and 3 appears to be the volatility multiplier they went with based on the results suggesting a reevaluation of a position; i.e., perhaps it’s time to exit.
Typecasting
So exactly what kind of confirmation indicator is this? The Chandelier Exit indicator can be considered a volatility indicator based on its call to the ATR, originally developed by Welles Wilder. The goal of this indicator was to keep traders in a trend as long as possible by identifying something called “outsized price movements”, or a fancy expression for excessive volatility. However, for our charting purposes, we’re using it as a confirmation indicator.
What’s Your Function
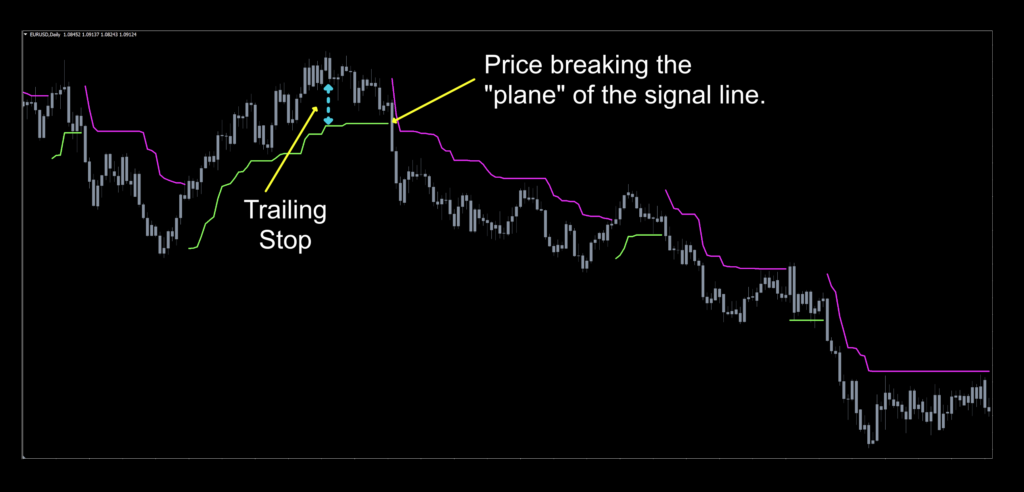
The original function of this indicator was to keep traders in an open trade as long as a trend was in place and prevent a premature exit by printing a suggested trailing stop, which will be illustrated shortly. Naturally, we as NNFX traders use the ATR in our stop loss levels, but calculated differently.
Video Break
Now that we’ve gone through the academics of the indicator, let’s sit back for a few minutes and watch it react with price. At the conclusion of the video, come on back to the blog.
Paler Shade of Gray
We had to make a few adjustments on the initial chart view to better illustrate the indicator, including changing the default ATR value from 9 to 22 and the multiplier from 2.5 to 3. We did this to respect the original intent of the indicator. Likewise, we also “dimmed” the white candles to a darker gray to let the signal lines shine through. Now that it’s easier to see, we’ll investigate how well (or not), this indicator does.
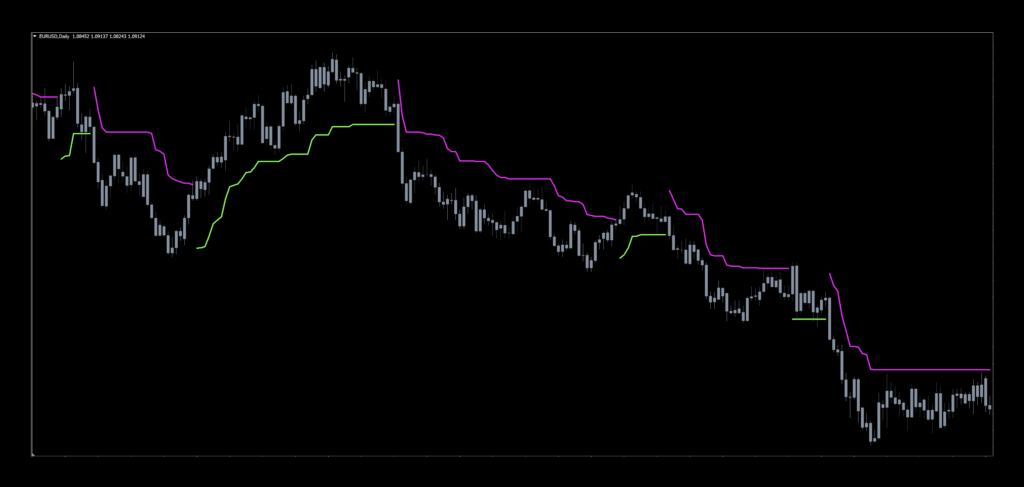
The first thing you’ll notice is the “stair stepping” the indicator does with respect to price. This distance represents the suggested trailing stop and when price breaks the plane of the signal line, you’ve hit your stop loss level. As NNFX traders, our stops are calculated differently, we’ll ignore this. The color change can be considered as an exit, if you choose to use this as your exit indicator.
Settings
There are four settings included with this version of the indicator. As the original only utilized two, we’ll test it with those two “OG” (Original Gangster) settings only. The other two settings didn’t affect the signals much, so we left them on the default settings.
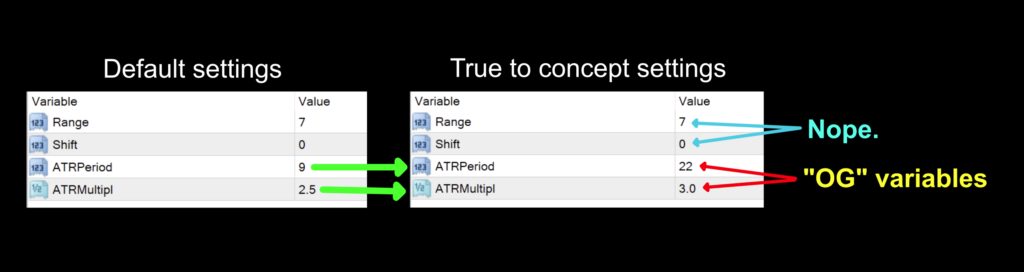
ATRPeriod: The variable that specifies the number of periods for the long and short calculations. The default setting is 9, but we changed it to 22 out of observance to the original design.
MultiplierATR: The ATR multiplier used to smooth volatility. The default setting is 2.5, but we changed it to 3 per the original design.
Advantages
* Uses ATR for trend and volatility determination.
* Fairly easy to adjust, only two settings.
* Has been utilized in multiple markets as a mainstay indicator.
How we use it.
To clarify specific concepts relating to the NNFX system. There are three possible trade actions;
OPENING A TRADE
CLOSING A TRADE
MAINTAINING A TRADE
One of these three actions need to happen in the last 30 minutes prior to the close. This is when you make your trading decisions, and not actually wait for the close at 1700 EST, because we trade on the daily time frame.
Long signal: When the color changes from red to green. Entry is in the last 30 minutes of the trading day.
Short signal: When the color changes from green to red. Entry is in the last 30 minutes of the trading day.
Signals For The Win
Below is the marked up chart to see how those modified default settings did with respect to the OG concept.
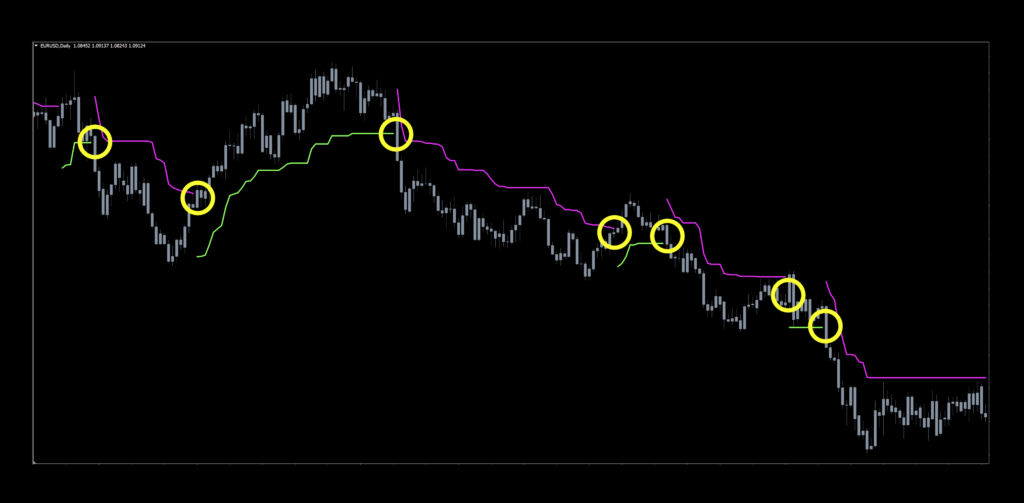
Okay…not too bad. The exits on the modified default settings were a bit on the slow side, and of course there were a couple of areas where range bound price caused a few in/out signals. But, it’s not a bad first glance. We’ll see how it does once we get our hands on it during testing.
Testing the Chandelier Exit
To reiterate, we’re only testing the effectiveness of this indicator based on color change and not utilizing the suggested exit functions; i.e., we’re sticking with NNFX rules. If you’re new to these studies, we recommend looking at some of the older blogs to understand how we conduct our testing.
The six pairs we recommend testing are…
EUR/USD
AUD/NZD
EUR/GBP
AUD/CAD
CHF/JPY
CAD/SGD
The markets we test our indicators are the:
EUR/USD (Euro/US Dollar)
BTC/USD (Bitcoin/US Dollar)
XAU/USD (Gold/US Dollar)
SPX500 (S&P500 Index)
Timeframes and Results
We’ll run the Chandelier Exit indicator on the EUR/USD, BTC/USD, XAU/USD, and the SPX500 using the default and tweaked settings across the daily and 4-hour timeframes on the MT4 strategy tester.
We focus on three metrics;
Total trades
Win/Loss ratio
ROI (return on investment)
The Results Are In
Below is the data from our testing.
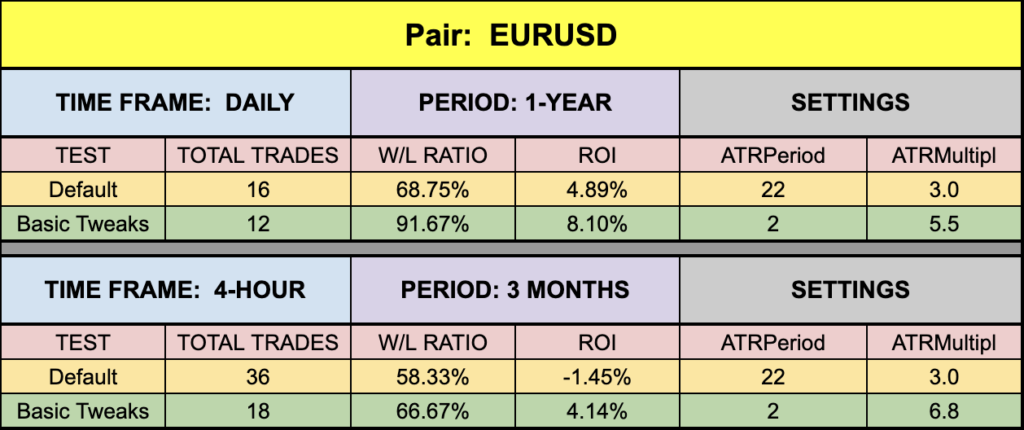
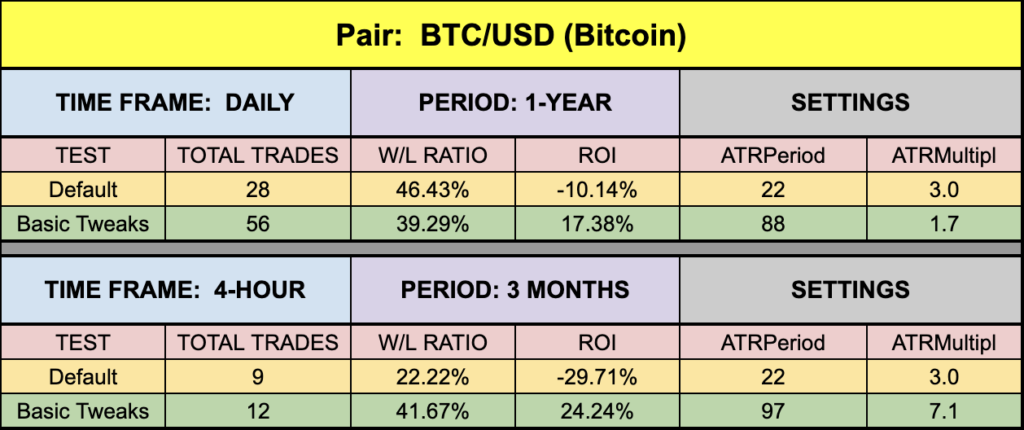
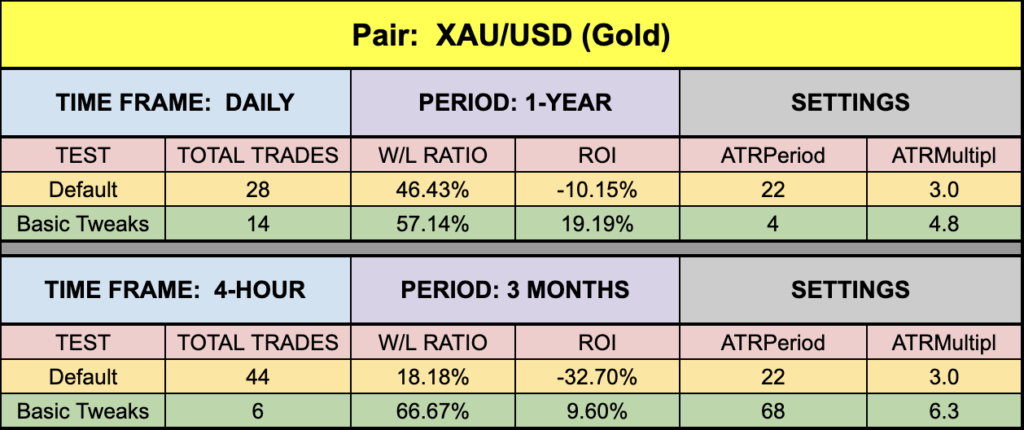

Numbers were a bit on the low side for the EUR and SPX500…not too terrible, but pretty darn good for BTC and XAU which are, of course, the current darlings of our testing parade. But don’t take our word for it, go test it yourself and see if it can help you. Remember, that’s what we do here, empower you to forge your own future.
Forget-Me-Nots
There is a short survey on the Stonehill Forex home page, where which we hope everybody will participate. It takes less than 5 minutes.
We added two pages to the site. The first is a “Marketplace” for those of you who want to advertise their coding skills for hire. The second is a repainting indicator page. Each profiled repainting indicator will have an accompanying video, which will be housed in a separate playlist on YouTube.
Money Management
Money management is based on the NNFX risk profile. That information can be learned in the Advanced Course.
Resources
We’ve made the Chandelier Exit indicator available for download on our site from the indicator library, for free. When you’re ready to get it, click HERE.
We’re Here For You
Don’t forget to sign up for the latest digests. If you missed it, be sure to sign up on the website and email dan@stonehillforex.com with the title “Latest Digest Please” and we’ll send the most recent one off to you within 24 hours.
Other Resources
Be sure to subscribe to the Stonehill Forex YouTube channel for the technical analysis videos which pair well with these blogs…like mountains and skiing. Don’t forget Facebook and Quora, where we answer questions relating to Forex.
Our only goal is to make you a better trader.
BTW – Any information communicated by Stonehill Forex Limited is solely for educational purposes. The information contained within the courses and on the website neither constitutes investment advice nor a general recommendation on investments. It is not intended to be and should not be interpreted as investment advice or a general recommendation on investment. Any person who places trades, orders or makes other types of trades and investments etc. is responsible for their own investment decisions and does so at their own risk. It is recommended that any person taking investment decisions consults with an independent financial advisor. Stonehill Forex Limited training courses and blogs are for educational purposes only, not a financial advisory service, and does not give financial advice or make general recommendations on investment.