
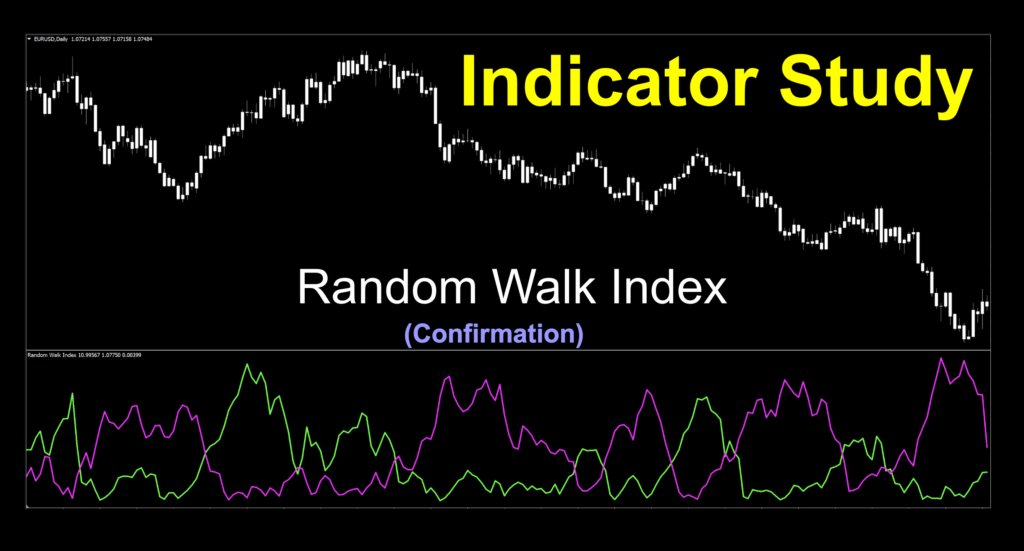
Random Walk Index
If you’d like to follow along with the e-book version of the blog, click on the play button in the audio player below (at the bottom of the page).
We’re Walking, We’re Talking
Have you ever gone out for a stroll, wrapped up in your thoughts when all of a sudden, you have no idea where you’ve ended up? It’s totally cool to admit it. We’ve all done it. That planned walk just became more of a random roam about town. There’s an interesting correlation with price that gave the idea to see if there was an indicator which could detect random movement, i.e. a random trading range or if it’s moving with purpose; i.e., trending.
Headache City
We initially ran the data stream using the default settings, but holy mackerel, it nearly caused us to have a seizure. Way too short of a look back period, and it just printed weird in the testing mode. That being said, we did include a few seconds of the indicator walking its walk with the initial settings, just so you’d be able to see it, but we had to slow this down and go back to our 1-minute chart real time test, so we would be able to pick out signals and comment on them intelligently. Was there any specific number we chose? Kind of. We chose 14 because we like that number…hint; ATR. Ring any bells?
Digital Stamp
On fire! Our in-box was burning up with some great stuff. We’re really starting to find out the whose who of the MT4 world by some of the great suggestions we receive. Some original work that we’re looking at, which is totally amazing. Keep those kick’in notions headed our way to stonehillindicator@gmail.com, and keep on keeping on.
Walk The Line
Guess what? We found something fascinating. It may not be the best we’ve ever looked at, but it’s sure different. We like different. Different math, different displays, different results. It’s all in a day’s work. We’re going to look at an indicator called the Random Walk Index. There’s a bit of history to this and as we researched “random walk”, we were met with a cascading volume of information on the topic. We won’t make this about that, but we’ll give you a bit of insight, so you know what we’re talking about.
Ga-roovy, Man…

The theory of “random walk” goes back a few years. So far back, that pertinent details create somewhat of a timeline. We won’t go into all the boring details, just the major dates. The concept of the “random walk” was a hypothesis in financial theory which states that a security’s price evolves due to random movement and cannot be predicted. This can be traced all the way back to 1863 when a French Broker published his works including this theory. There were many intermediary studies conducted, but it really took off between the 1950s and the 1970s where it received more attention, specifically how to help traders.
Modern Thoughts
By then, rudimentary indicators were being developed for trading securities, and it was showcased in the Technical Analysis of Stocks and Commodities magazine in 1990. From there, the index indicator was created in 1993 by A guy named Michael Poulos then it became an MT4 indicator in 2012. It’s been updated slightly so the version we’re looking at was reissued in 2020. And now, your history lesson is complete. Class dismissed.
The Basics
At its heart, Mr. Poulos described the index formula in two lines;
High = MAX((High – Low(n)) / (ATR(n) * SQRT(n)))
Low = MAX((High(n) – Low) / (ATR(n) * SQRT(n)))
The simple explanation is that the index would measure how much price ranges over a specified number of periods differing from what would be expected by a random walk, or price just randomly going up and down. The larger the range, the more it suggested that price was trending.
Visuals Always Help
Some of you might not be real clear on what a random walk is, so we found a couple of visuals to help describe it in moving pictures. We’ve embedded a couple of short videos which exhibit the random movement of a gas molecule in different ways. Now imagine price just sort of moving around. Same thing.
Video Player
Video Player
Cross Eyed Mess
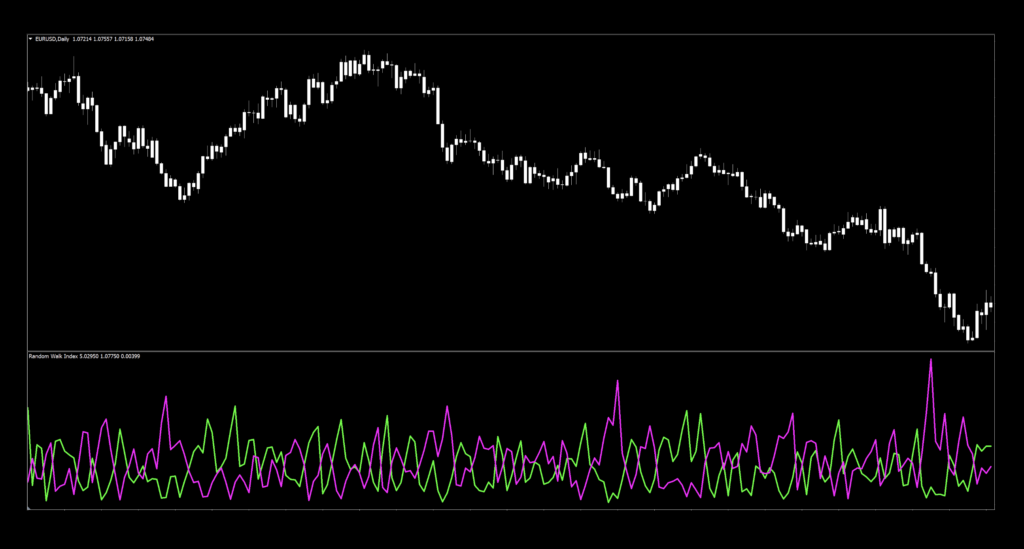
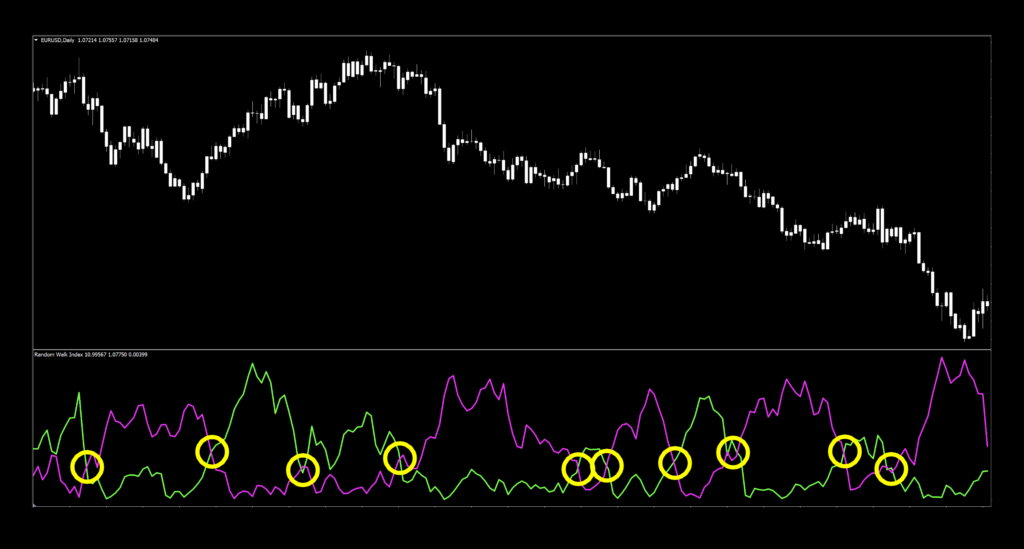
We decided to show you the indicator on its default settings, so you’ll be prepared when you try it yourselves. At first glance, it’s very difficult to use with respect to signals, and you’d go through a few pages in your journal just to record them. We did brighten up the green and red signal lines and thickened them up for easier viewing, and of course the candles are white to keep your eyes on the prize.
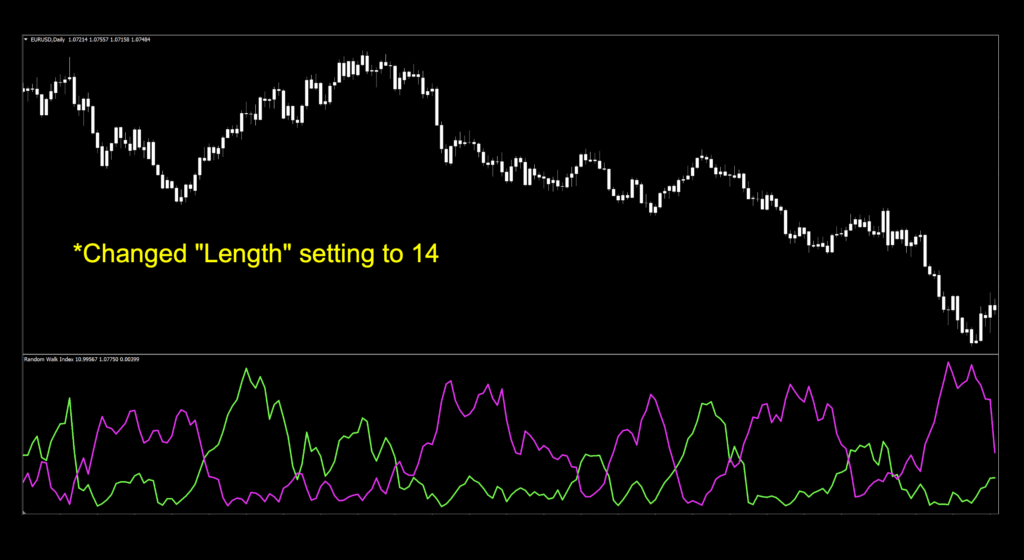
Now, we’ll just change that ridiculous default setting to…let’s say 14, because we like that number. It’s important to us. Anybody know why? Bueller? Bueller? Yep, that’s right, the ATR setting. You get a homework pass.
Settings
Lucky for us, there is only one setting to concern ourselves with.
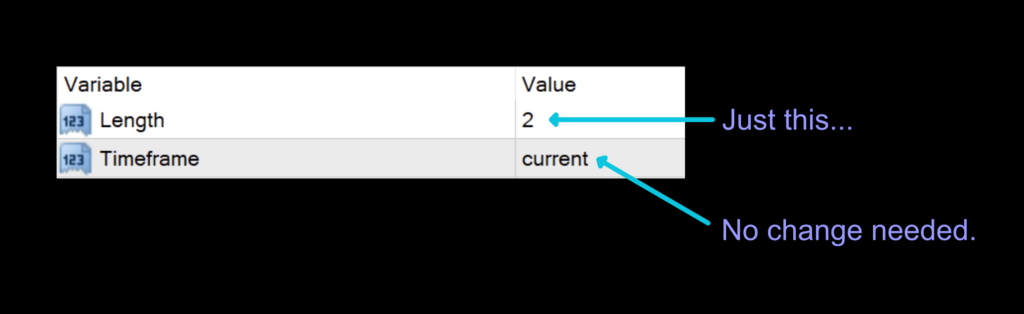
Length: The one and only setting the formula uses to calculate the signal line. The default value is 2, which is ludicrous.
Advantages
* Only one setting for quick testing.
* Based on a concept that has been around for a long time.
* Makes a decent exit indicator.
How we use it.
To clarify specific concepts relating to the NNFX system. There are three possible trade actions;
OPENING A TRADE
CLOSING A TRADE
MAINTAINING A TRADE
One of these three actions need to happen in the last 30 minutes prior to the close. This is when you make your trading decisions, and not actually wait for the close at 1700 EST, because we trade on the daily time frame.
Long signal: When the green signal line crosses above the red signal line. Entry is in the last 30 minutes of the trading day.
Short signal: When the red signal line crosses above the green signal line. Entry is in the last 30 minutes of the trading day.
We Can Work With This
The “random value” we changed in this chart produced some workable signals. Granted, there were three areas where signals reversed over themselves, but that’s to be expected when price devolves to random movements, or becomes range bound. Every market will do this at some point, which is why you never, ever trade with just one indicator. But, doable, for sure.
Acid Test
If you’re new to these studies, we recommend looking at some of the older blogs to understand how we conduct our testing.
The six pairs we recommend testing are…
EUR/USD
AUD/NZD
EUR/GBP
AUD/CAD
CHF/JPY
CAD/SGD
The markets we test our indicators are the:
EUR/USD (Euro/US Dollar)
BTC/USD (Bitcoin/US Dollar)
XAU/USD (Gold/US Dollar)
SPX500 (S&P500 Index)
Timeframes and Results
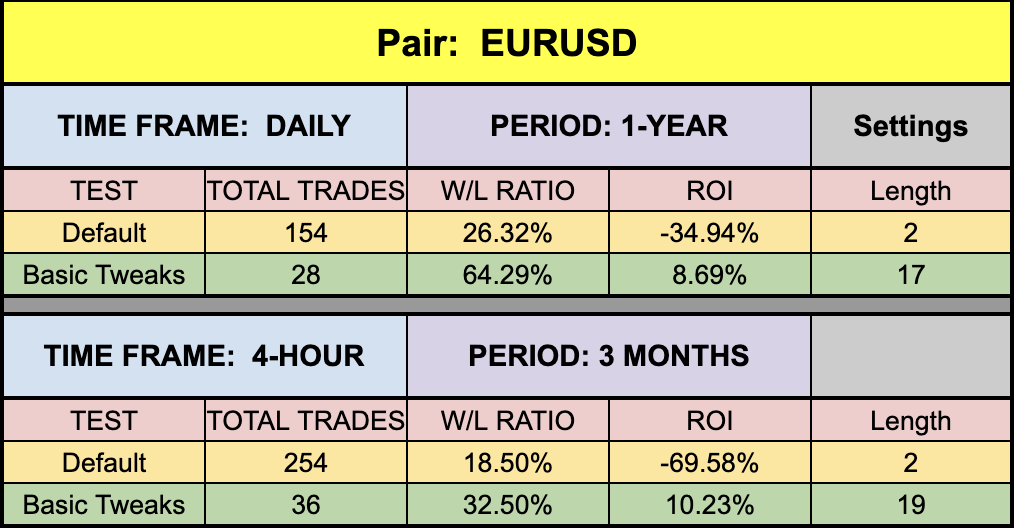
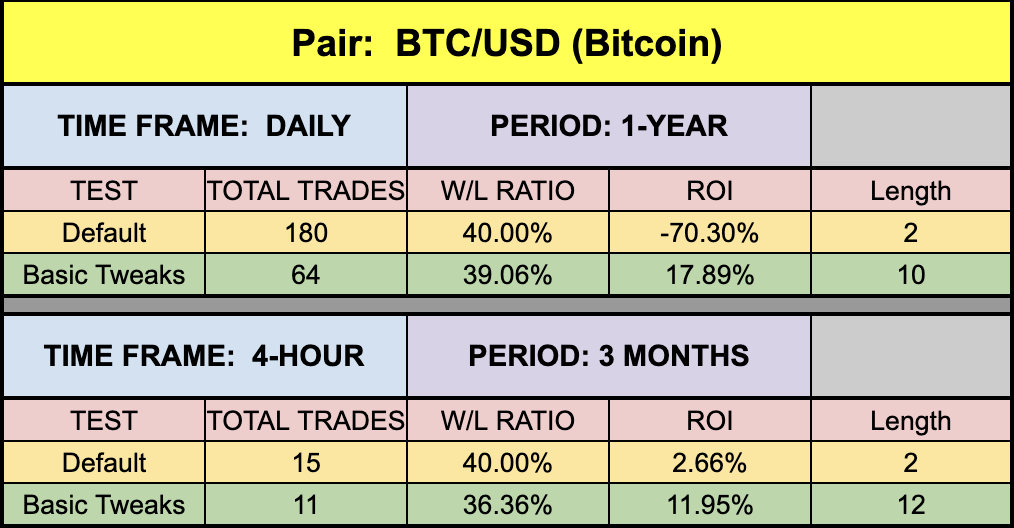
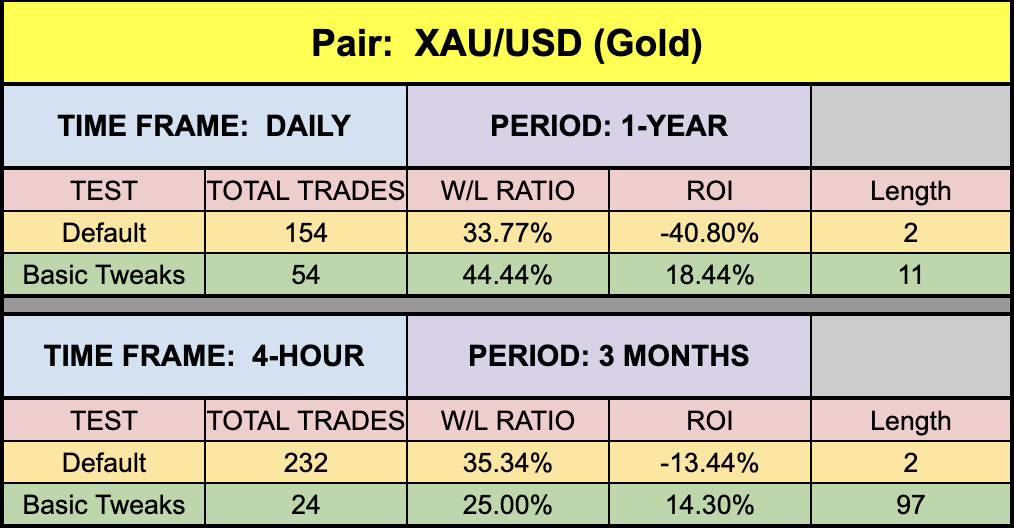
We’ll run the Random Walk Index indicator on the EUR/USD, BTC/USD, XAU/USD, and the SPX500 using the default and tweaked settings across the daily and 4-hour timeframes on the MT4 strategy tester.
We focus on three metrics;
Total trades
Win/Loss ratio
ROI (return on investment)
A Bit of a Mixed Bag
Below are our testing results for review.
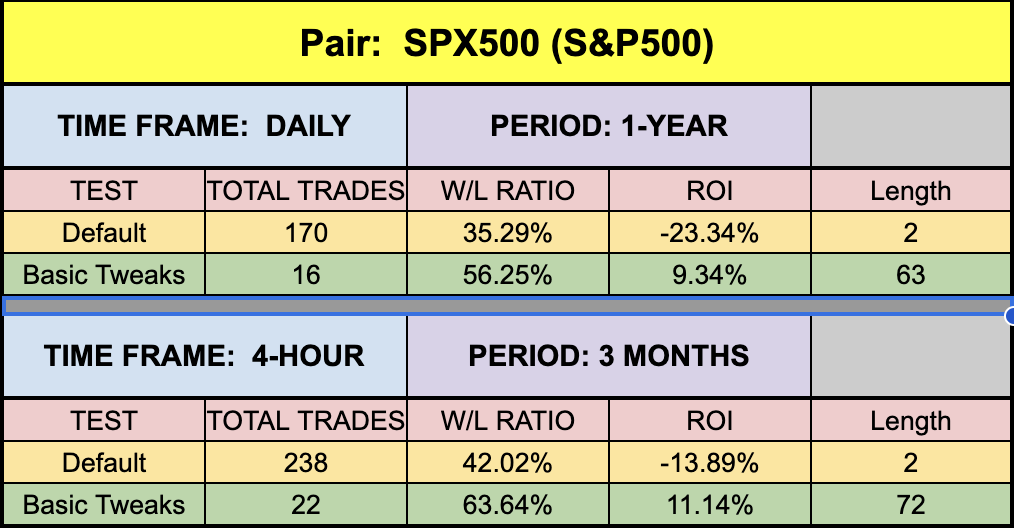
So Many Trades
Okay, the first thing we noticed was the obscene number of trades and the extremely low ROI on the default settings. But, this is not a surprise, as the number of periods used in the “Length” setting was about as short as you can make it. This is, in fact, a bit odd as a default setting because most of the time, coders try to provide an “acceptable” value which best represents the overall purpose of the indicator.
But, Better
All that aside, we were able to make it better in all cases. Not mind-blowing, but definitely worth a little time for testing on our own. BTC and XAU were neck in neck although the default values for BTC ROI% was so incredibly bad. Funny how just a little tweak can help.
Mentions
There is a short survey on the Stonehill Forex home page, where which we hope everybody will participate. It takes less than 5 minutes. We added two pages to the site. The first is a “Marketplace” for those who want to advertise their coding skills for hire. The second is a repainting indicator page. Each profiled repainting indicator will have an accompanying video, which will be housed in a separate playlist on YouTube.
Money Management
Money management is based on the NNFX risk profile. That information can be learned in the Advanced Course.
Resources
We’ve made the Random Walk Index indicator available for download on our site from the indicator library, for free. When you’re ready to get it, click HERE.
We’re Here For You
Don’t forget to sign up for the latest digests. If you missed it, be sure to sign up on the website and email dan@stonehillforex.com with the title “Latest Digest Please” and we’ll send the most recent one off to you within 24 hours.
Other Resources
Be sure to subscribe to the Stonehill Forex YouTube channel for the technical analysis videos which pair well with these blogs…like mountains and skiing. Don’t forget Facebook and Quora, where we answer questions relating to Forex.
Our only goal is to make you a better trader.
BTW – Any information communicated by Stonehill Forex Limited is solely for educational purposes. The information contained within the courses and on the website neither constitutes investment advice nor a general recommendation on investments. It is not intended to be and should not be interpreted as investment advice or a general recommendation on investment. Any person who places trades, orders or makes other types of trades and investments etc. is responsible for their own investment decisions and does so at their own risk. It is recommended that any person taking investment decisions consults with an independent financial advisor. Stonehill Forex Limited training courses and blogs are for educational purposes only, not a financial advisory service, and does not give financial advice or make general recommendations on investment.