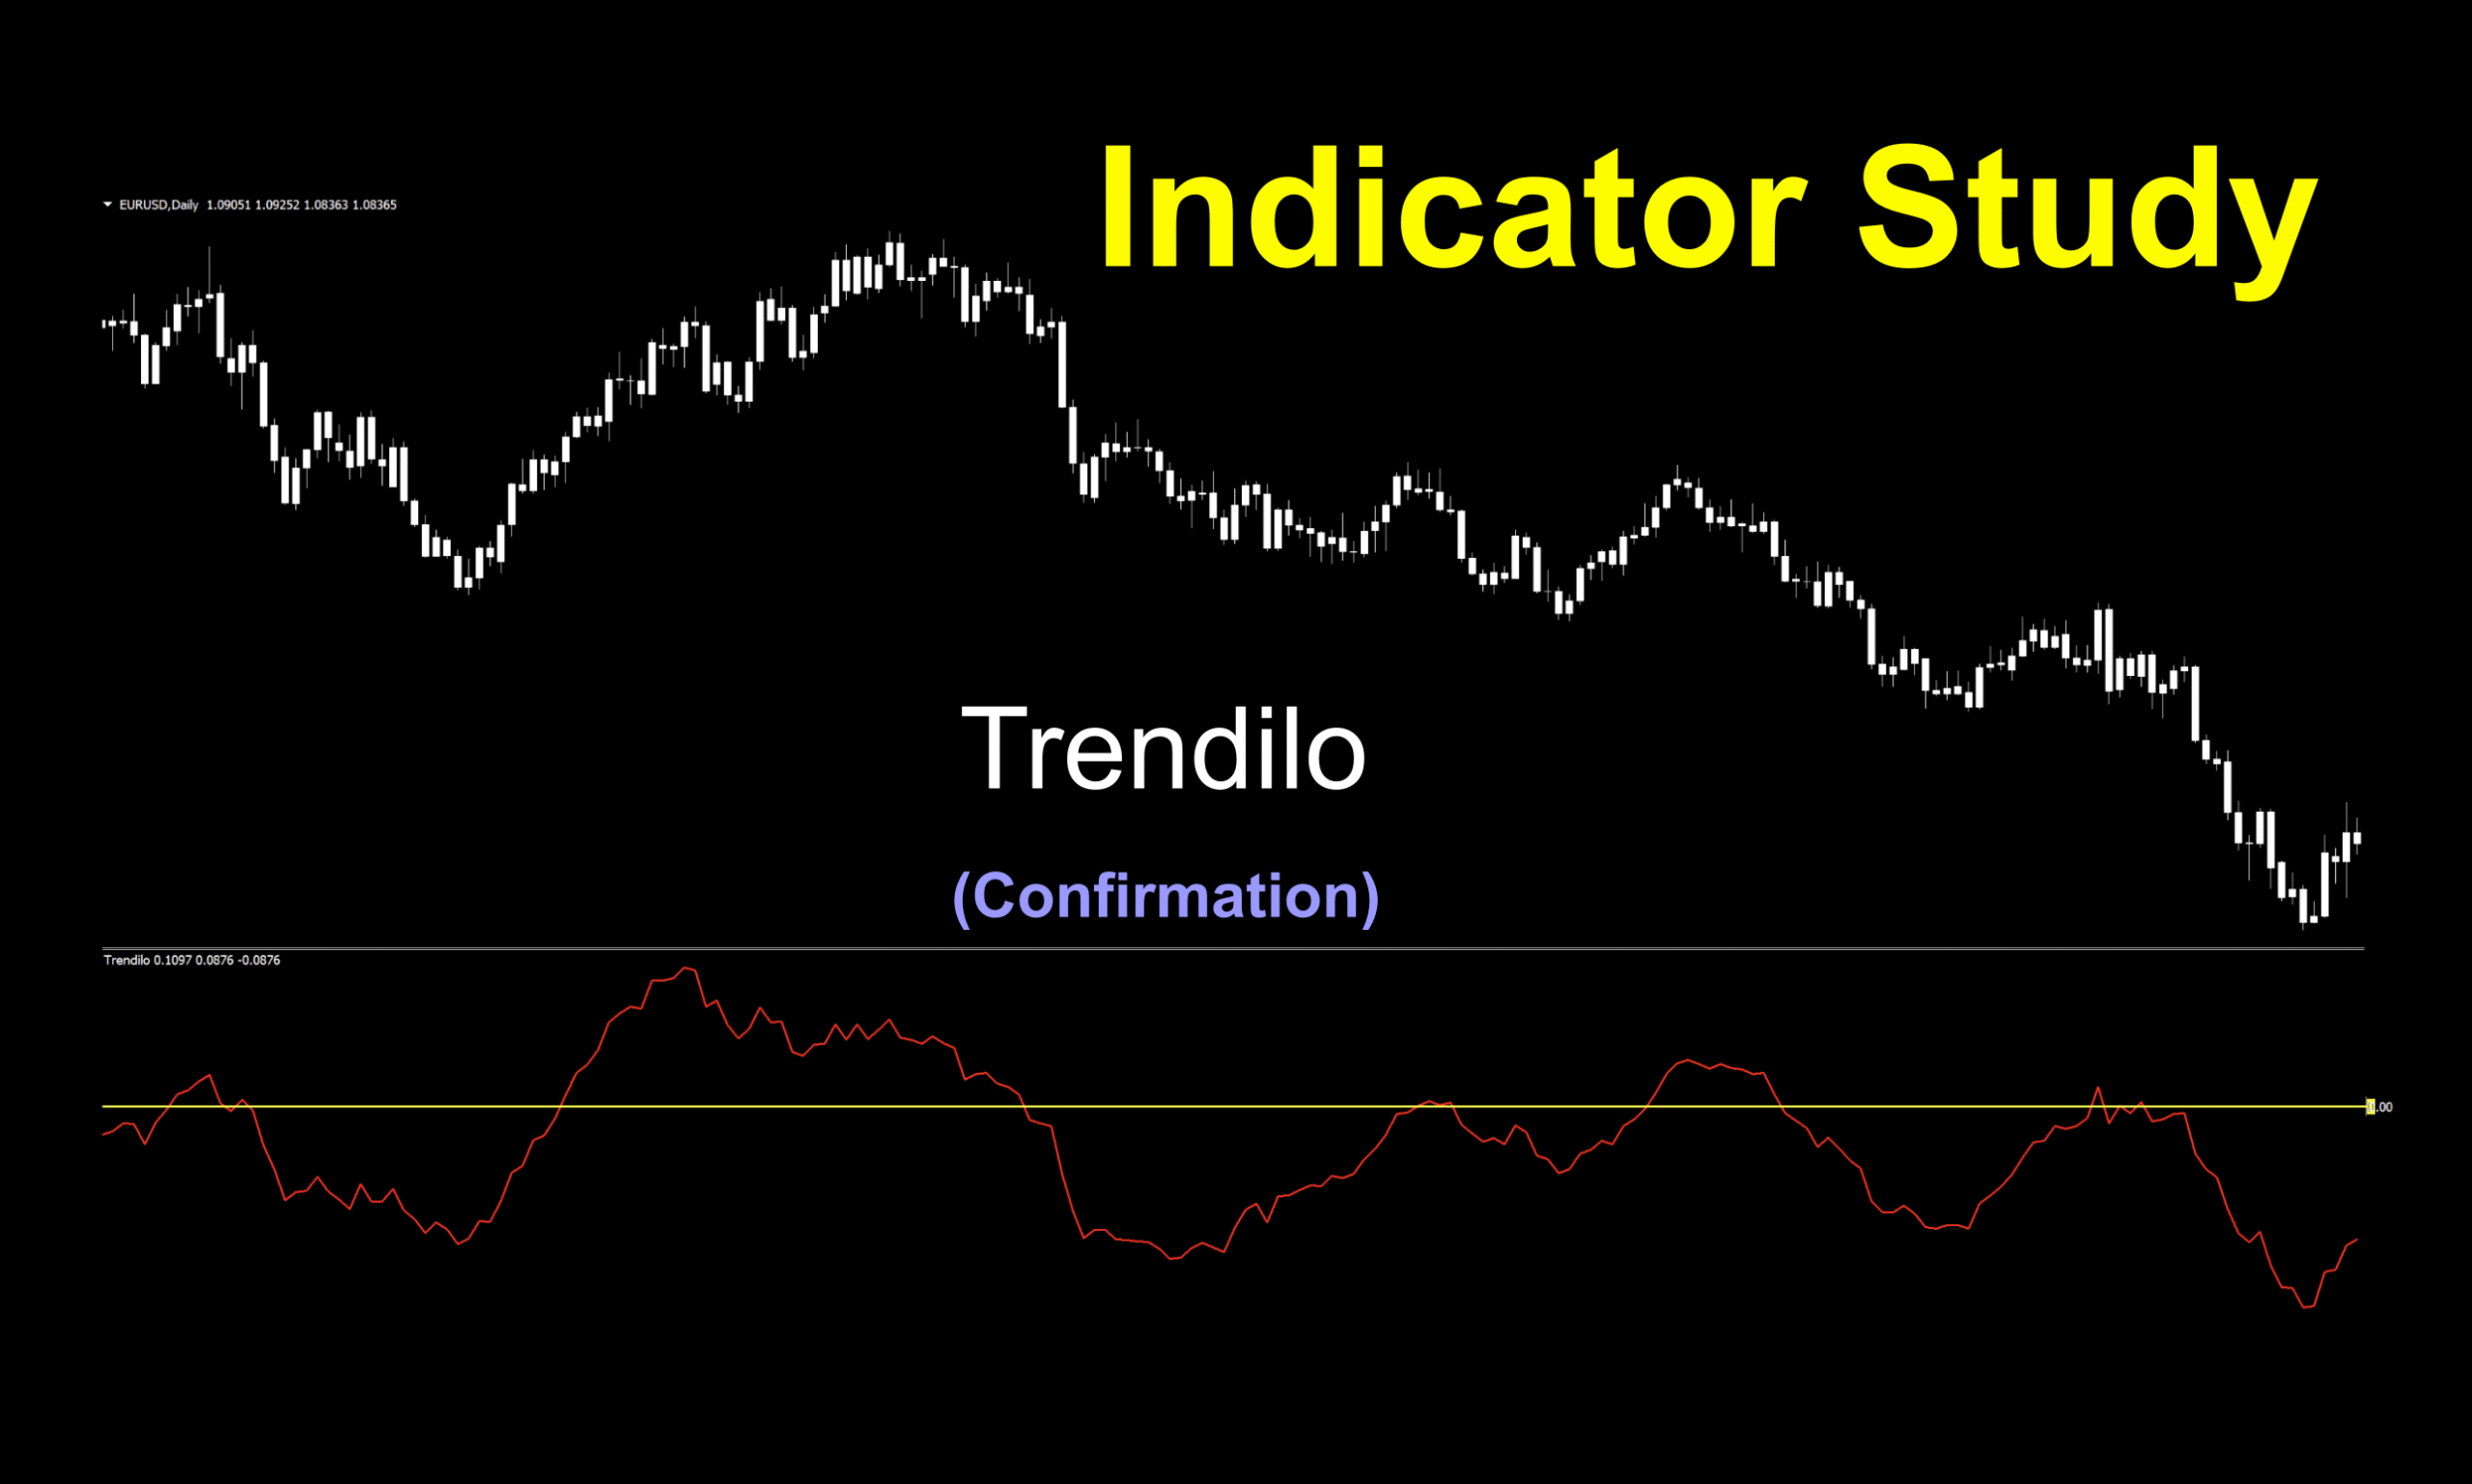
What’s The Dealio
The dealio is that we’ve got another indicator that started out as one thing, then made a few changes to suit our needs. It’s got a sprinkle of “this” and a sprinkle of “that” and we’re curious to see if this dog will hunt. Nowhere to be found in the default indicator listing of a newly minted version of MT4, we’ll take a peek-see at what this one has in store for us. Let’s go!
Vid-ee-oh!
Naturally, we’ll craft a short video of the indicator working through price action to see what the signals look like. We won’t have anything to compare it to this time, but we think it’s certainly worth the effort to give you a preview, so you can decide if you want to try it out for yourself.
Industrious Dudes
The Trendilo indicator came from a random trader’s request to convert it from a Trading View indicator into an MT4 indicator in 2019. It was finally coded in 2021 by the dynamic duo Gehtsoft and Mario Jemic.
Nice Mix
This confirmation indicator starts off looking a bit different from the “finished product” which we’ll be analyzing. We’ll go through the steps to ensure that you’re on the same page when testing it yourself.
A Call to Arnaud
It also has an interesting component we’ve featured in another blog called the ALMA indicator; a baseline featured as the last indicator of 2022 that incorporates a Gaussian filter offset and standard deviation functions. While the Arnaud Legoux Moving Average is called upon as part of the overall calculation, this indicator is not a chart overlay (on top of price) and lives below price in a separate window.
Default and Modified
We’ll take a look at the default view of the chart first. However, we’ll have to change the background color and candles because its native chromatic display is less than optimal…meaning, it’s a little difficult to see. We also “fattened” up the indicator components as well.
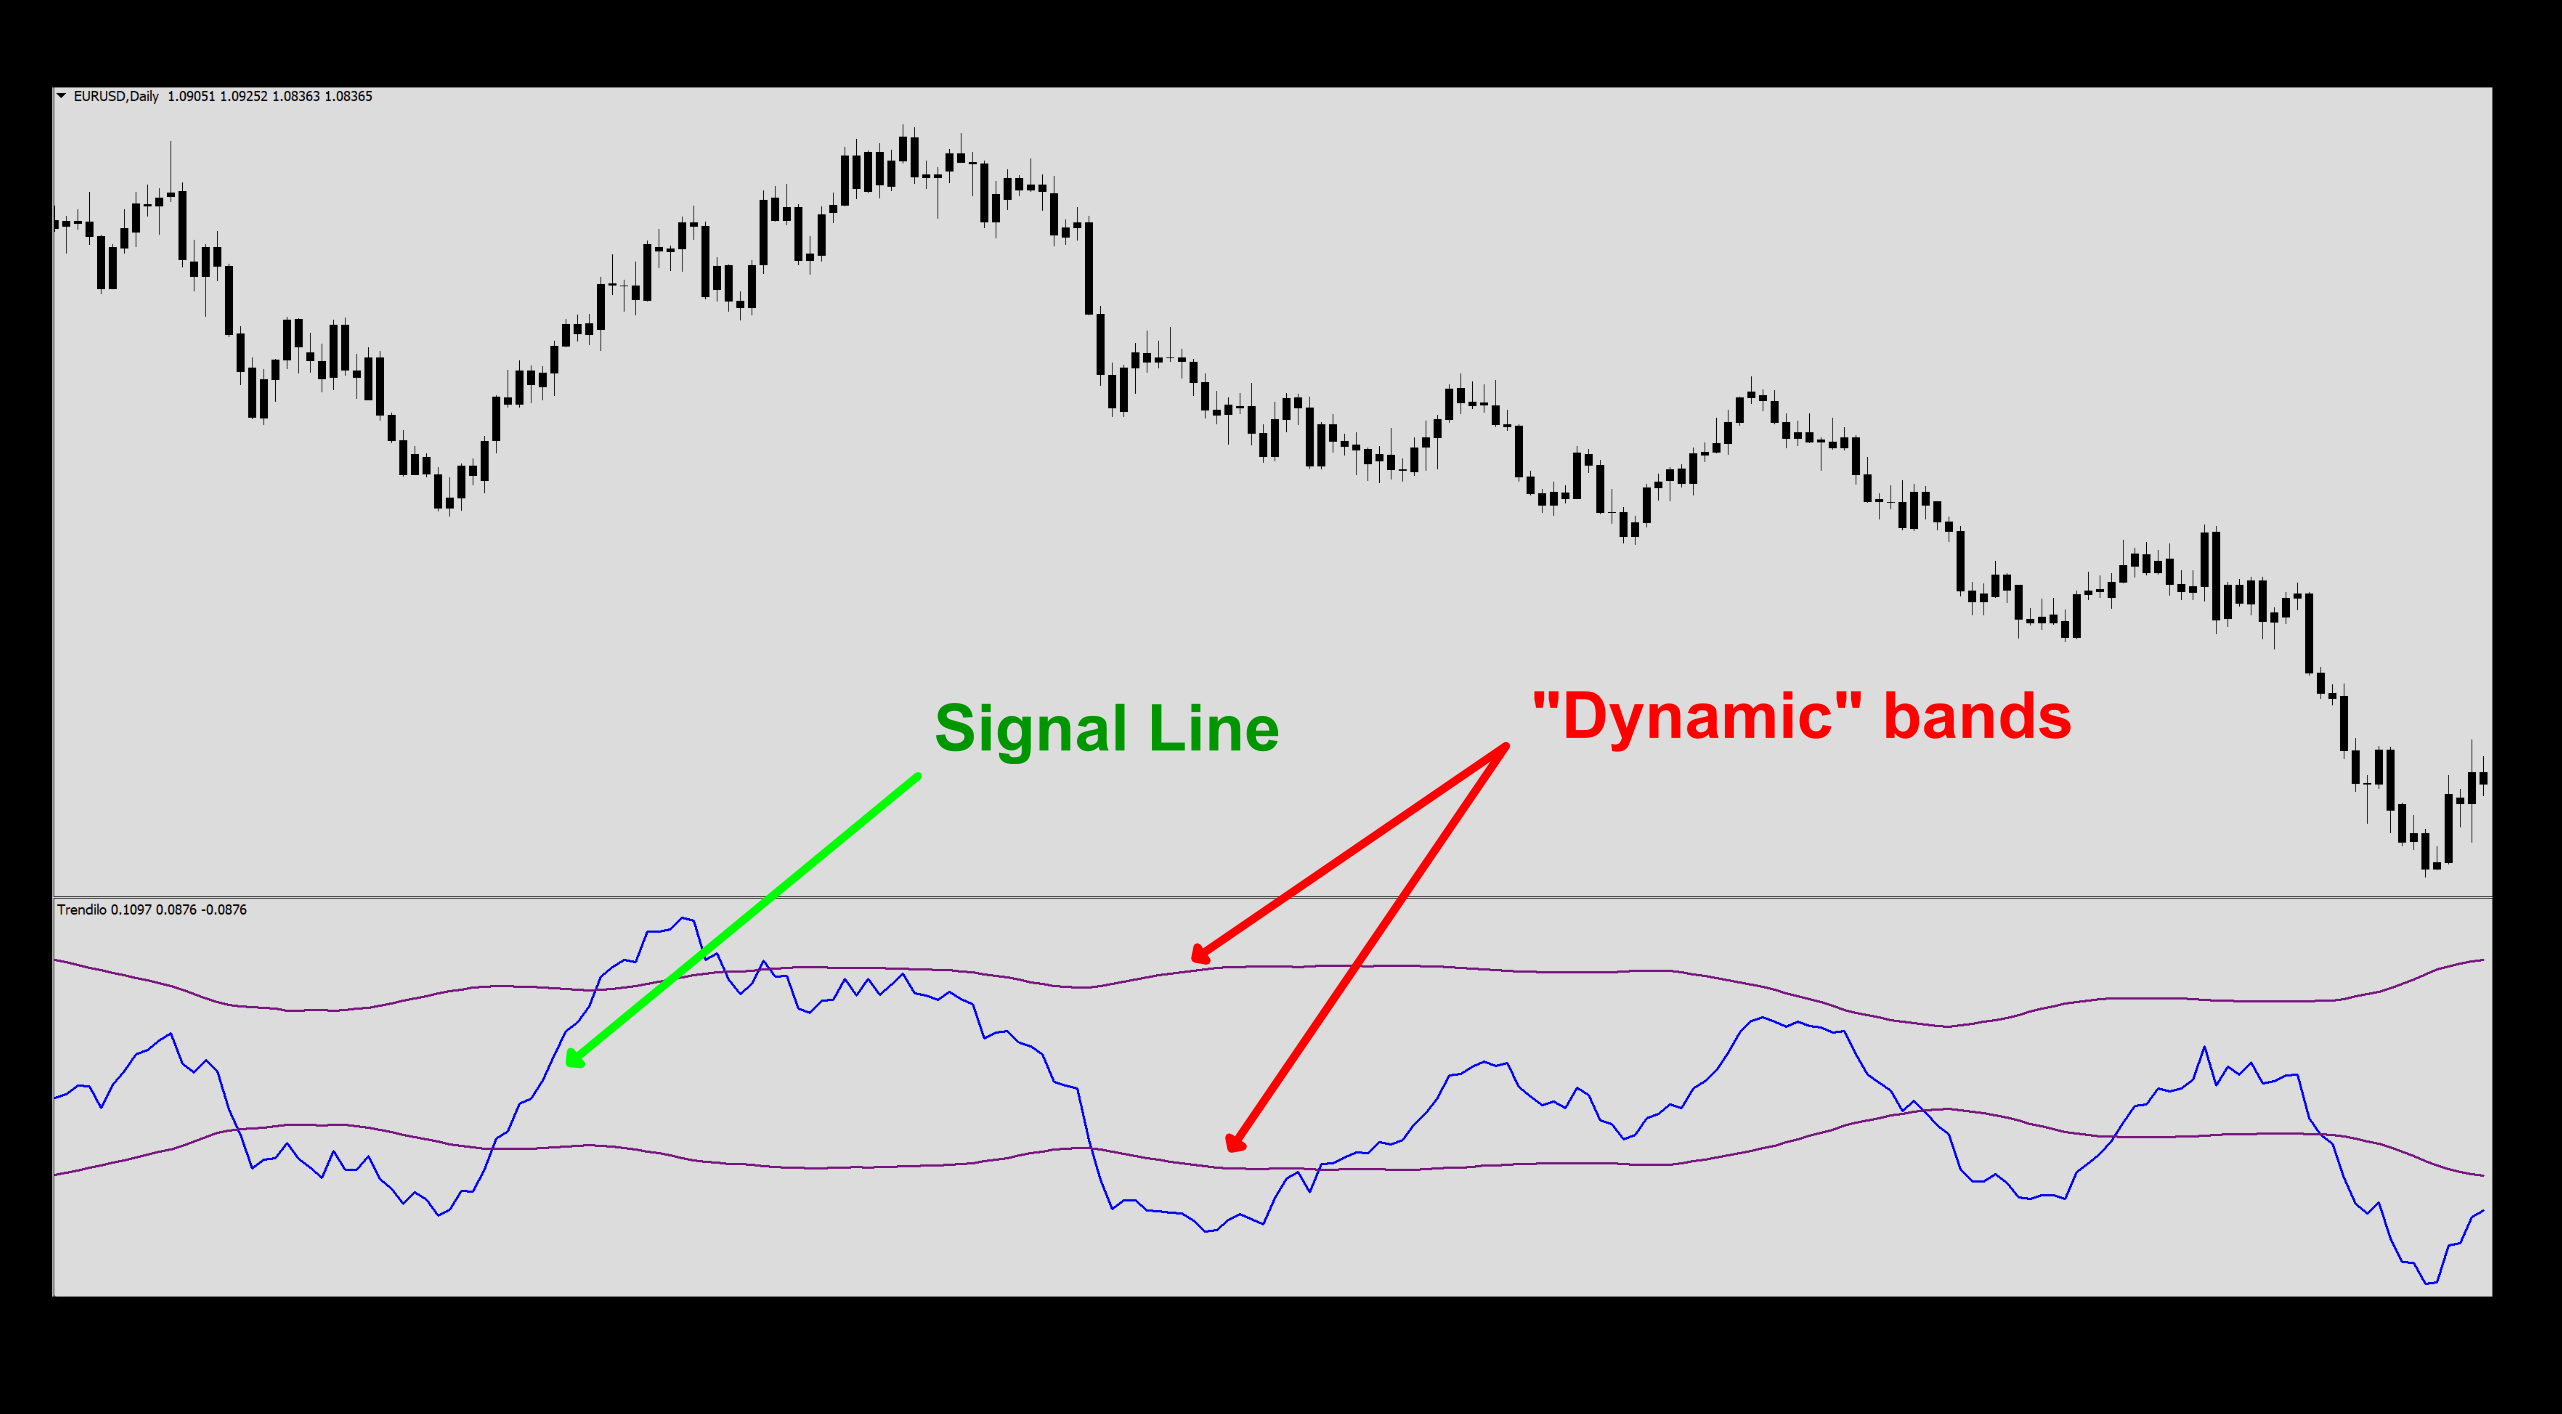
The stock version utilizes bands which “flex” around a signal line, similar to Bollinger Bands. These attempt to call buy/sell signals based on overbought and oversold levels – something we just don’t subscribe to. That being said, we’re going to remove the bands, change the color of the signal line and make our little friend here into a single level cross; in this instance, a zero-cross indicator. More like this…
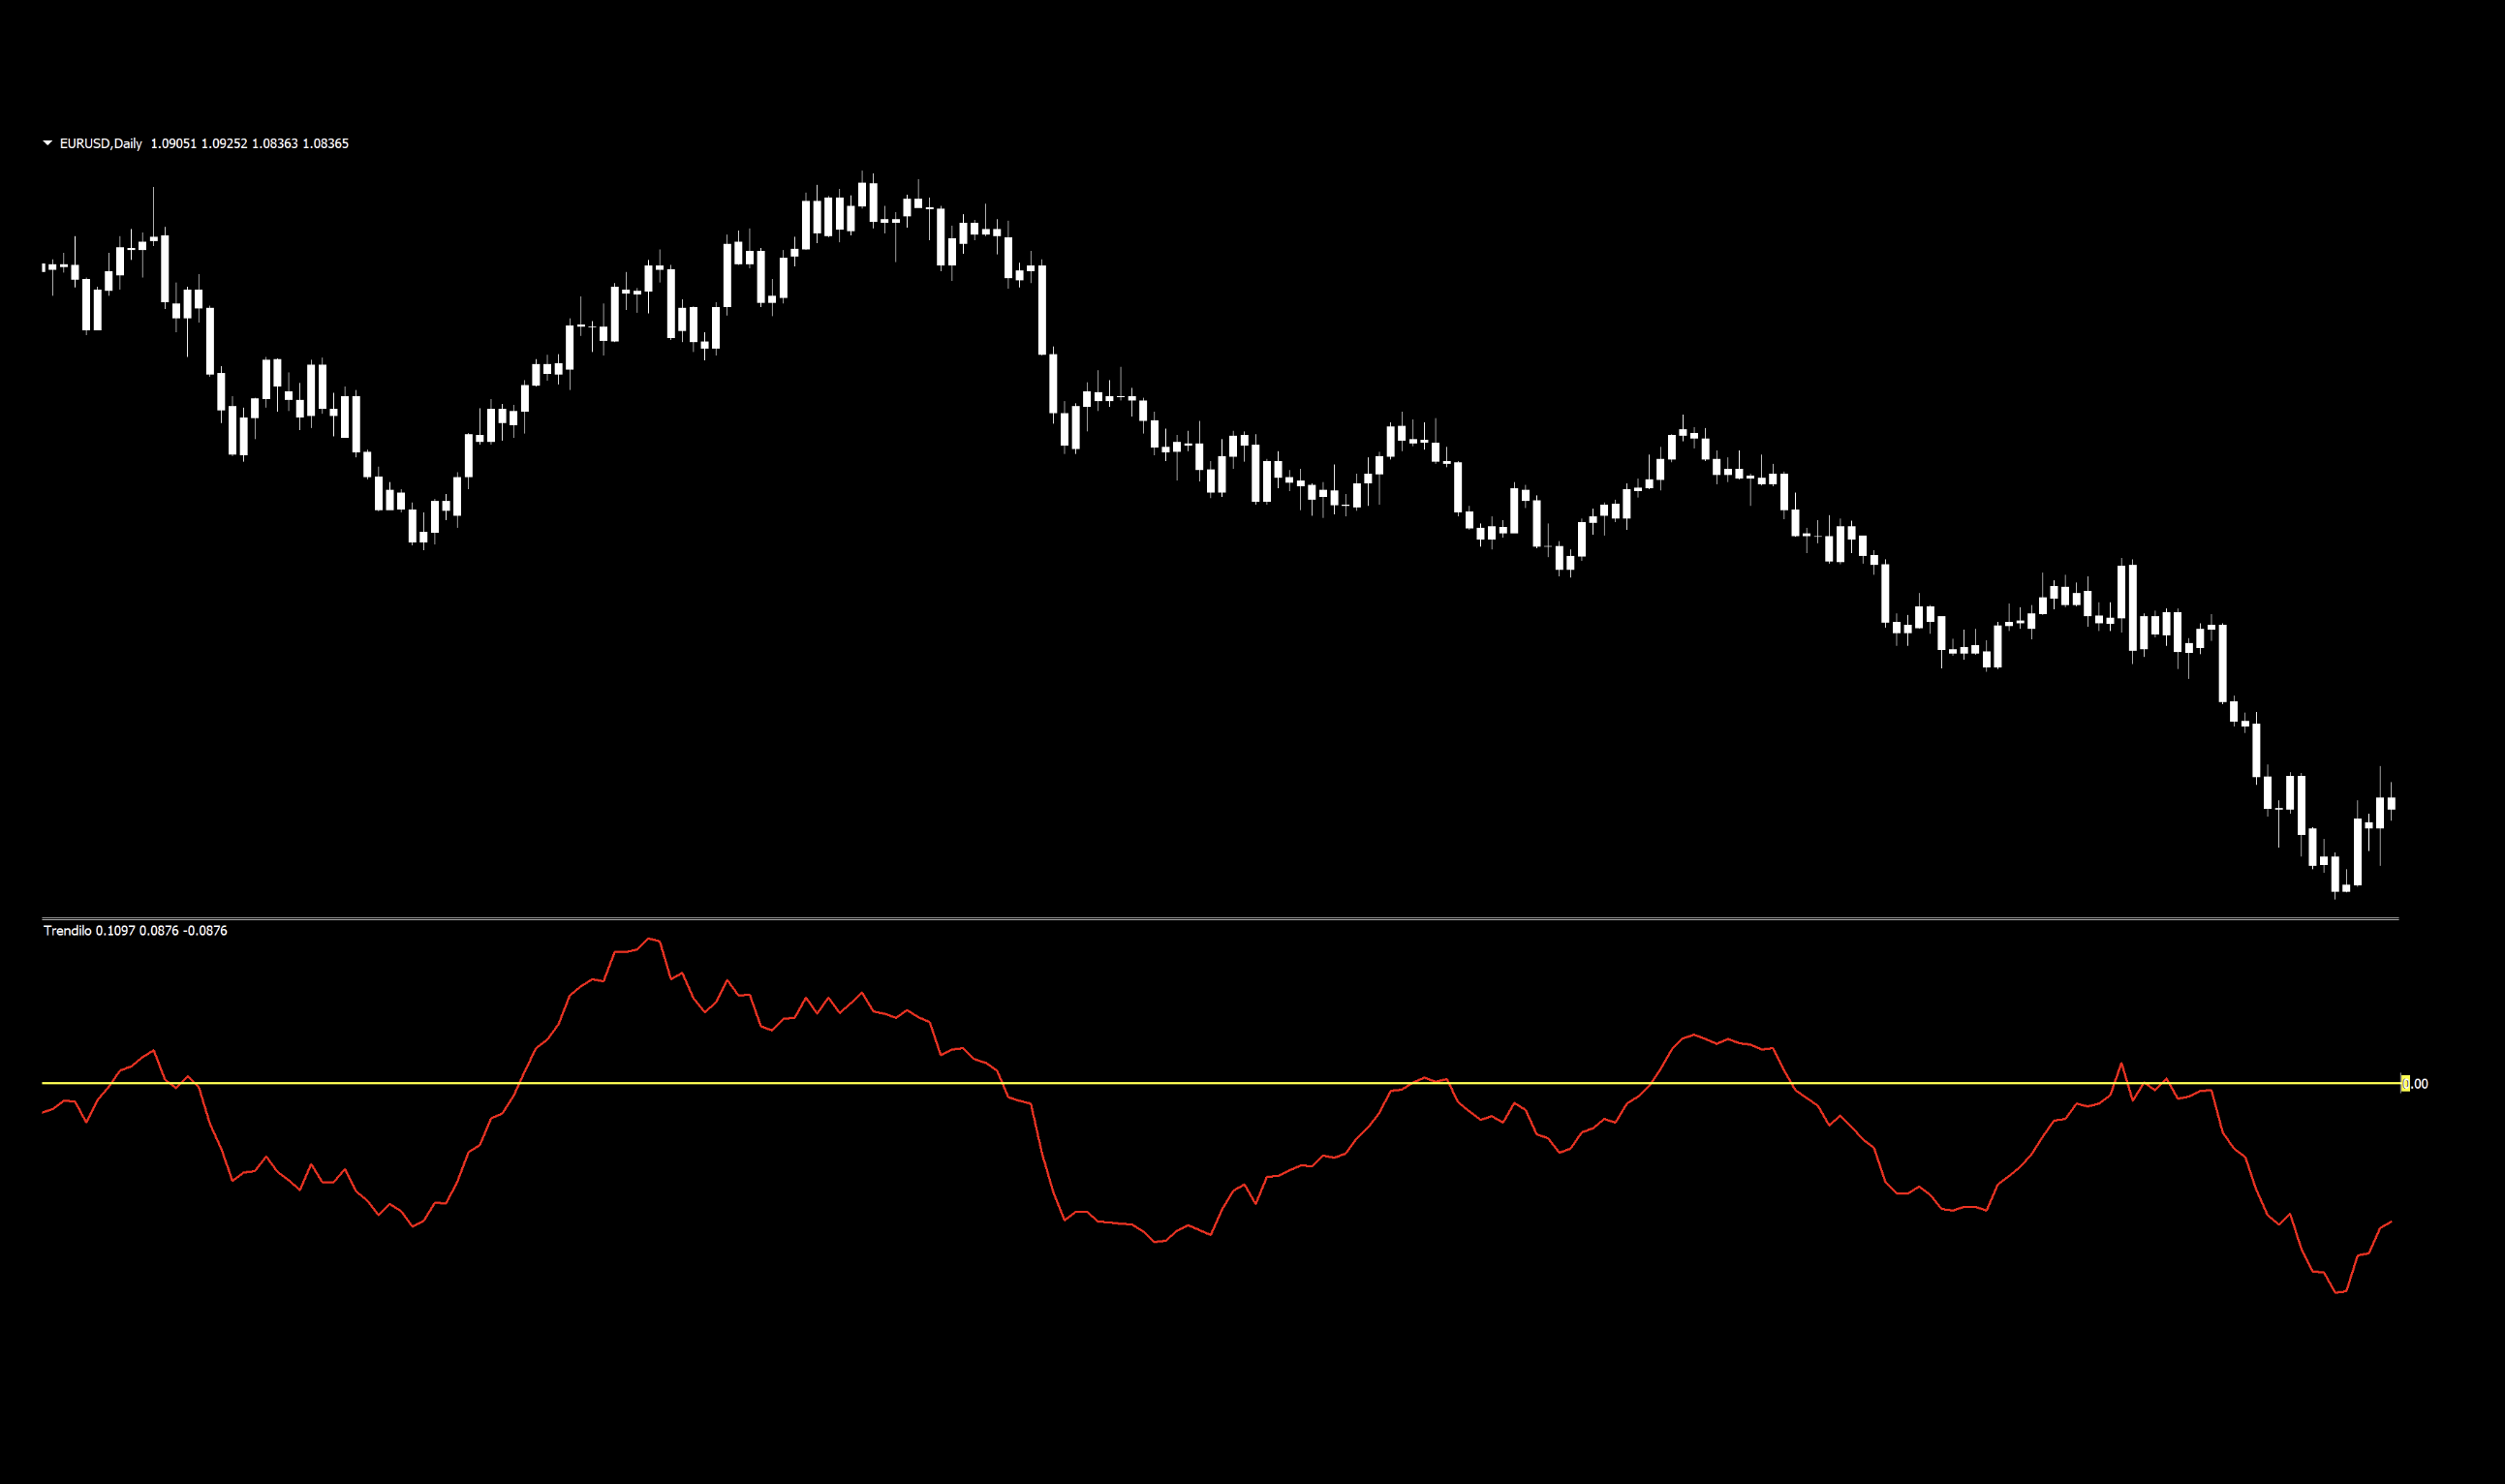
Better, right? Pretty definitive signals. If you want to see how we changed the colors on this one, it’s in the embedded video (also available on YouTube). Let’s move on.
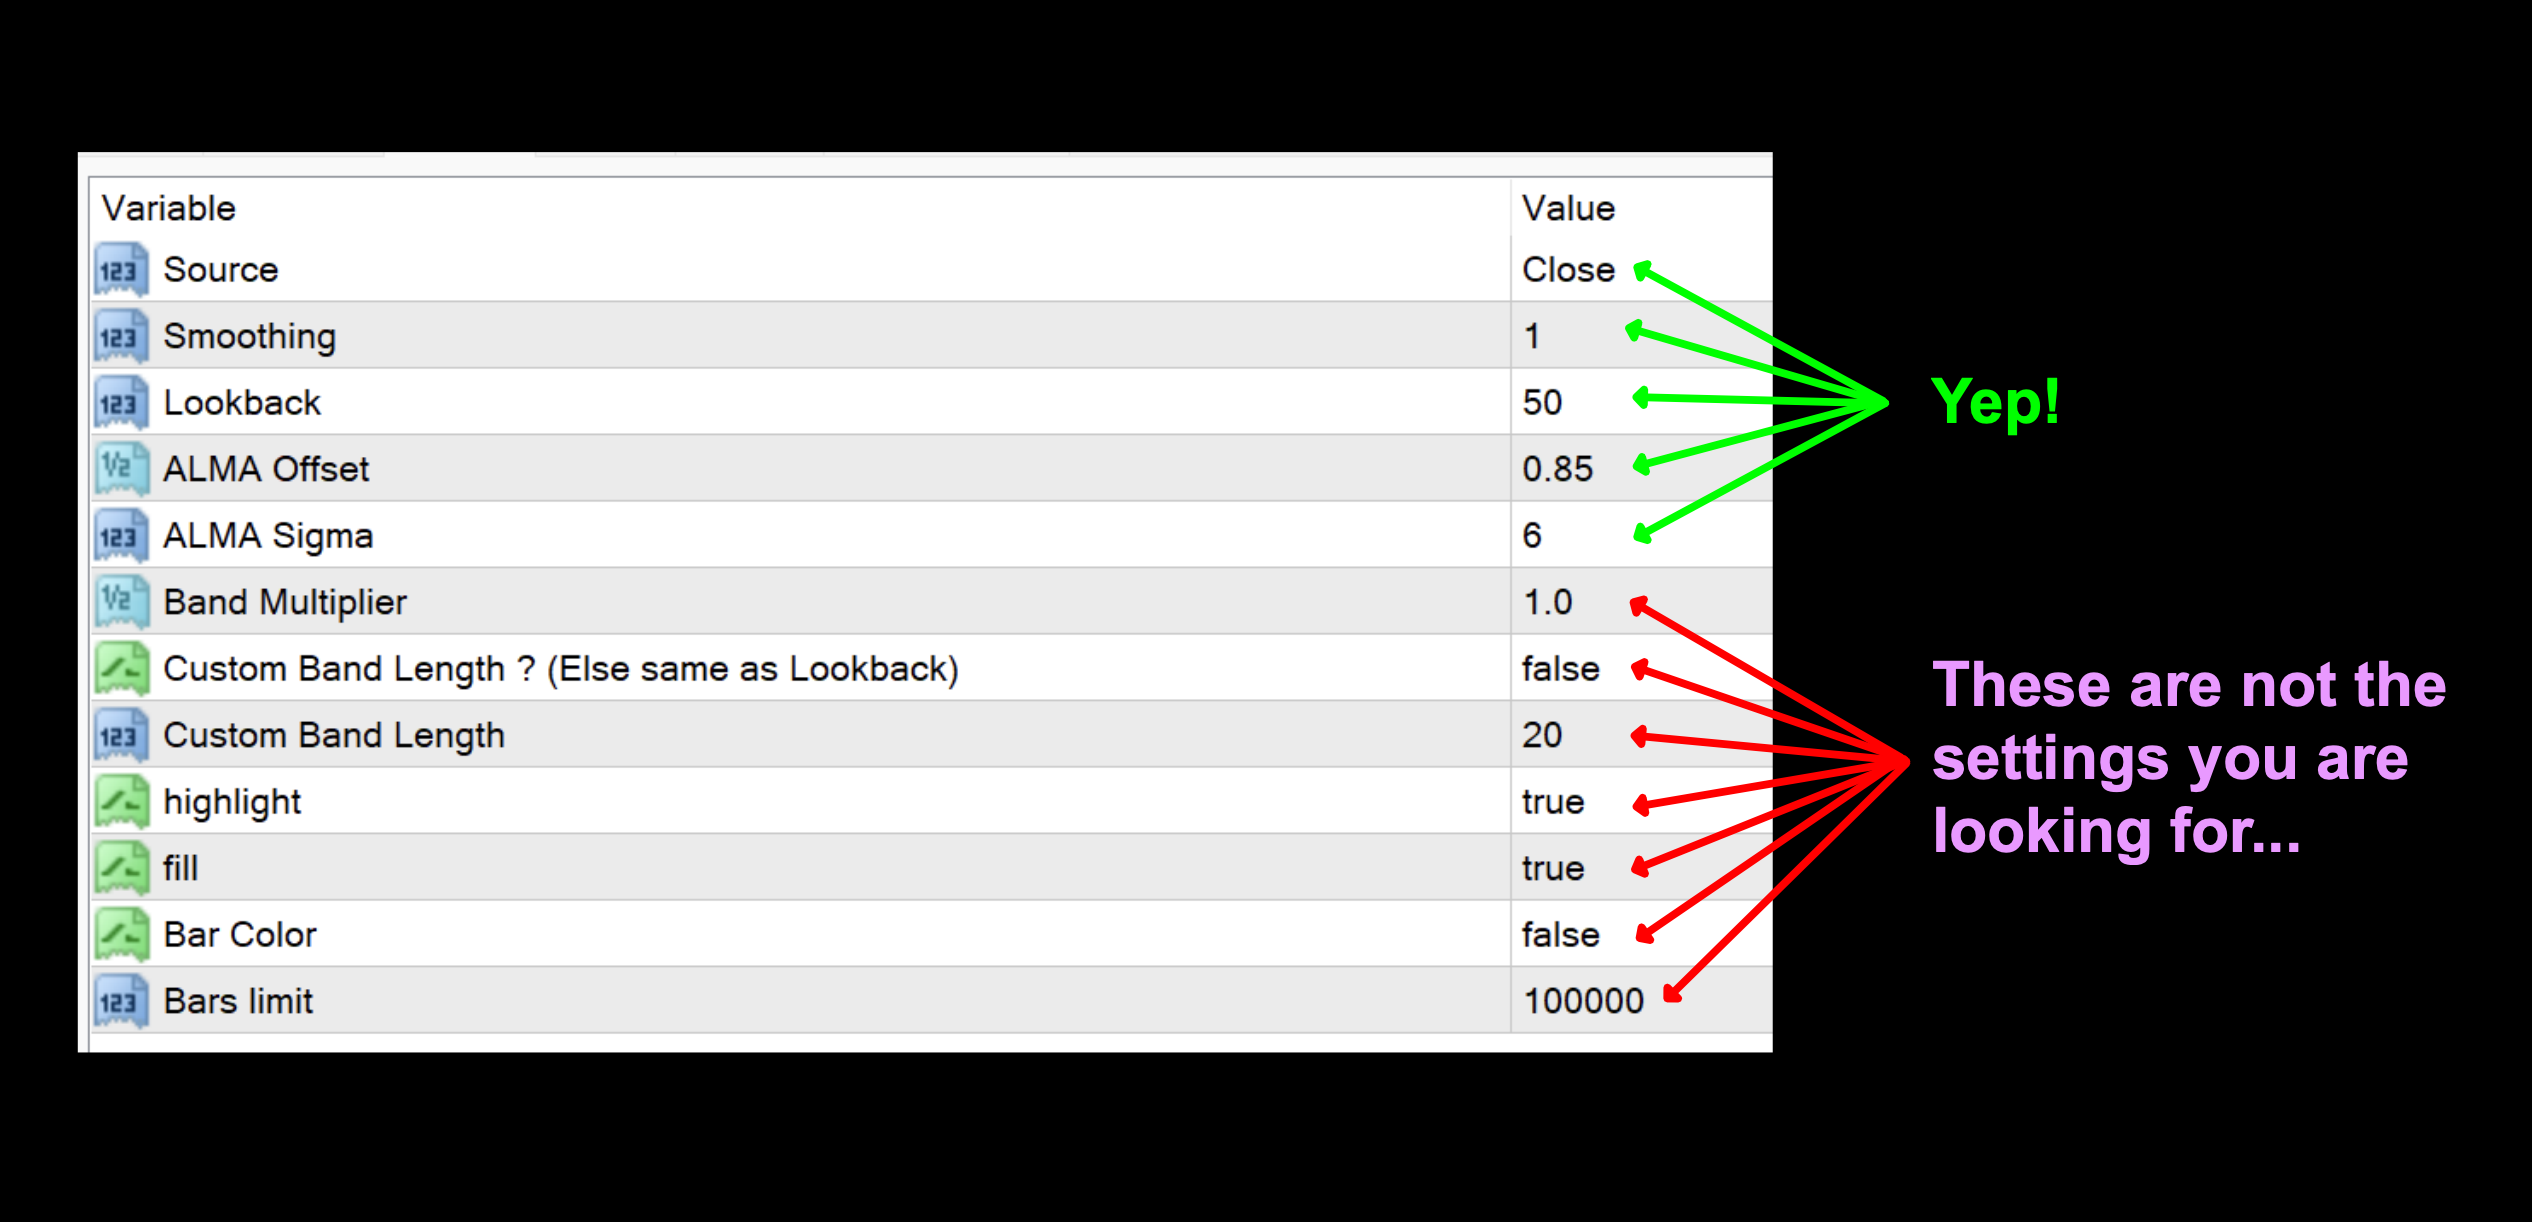
The Trendilo indicator as a comprehensive choice of variables; however, we’re only concerned with the first five. Just ignore the remainder.
Let’s watch the modified version of Trendilo react with price to get an idea of price/indicator reaction.
Video Player
Settings
There are five settings, so tweaking will give you options to find what’s best for your system.
Source: The data set used for calculations of the signal line; Close, Open, High, Low, Median, Typical, and Weighted. The default value is Close.
Smoothing: This variable affords a degree of smoothing to remove some of the extreme, jagged peaks and troughs. The higher the number, the smoother the line, and the default setting is 1.
Lookback: The overall number of periods the indicator takes into consideration when generating the signal line. The default value is 50.
ALMA Offset: By changing this setting, you “flex” the signal line by adjusting its moving average behavior. The default value is 0.85.
ALMA Sigma: This is the standard deviation applied to the signal line. It makes the signal line sharper or smoother in appearance. The default value is 6.
Advantages
* Modified version provides much clearer signals than the default version.
* Settings provide the ability to make multiple adjustments.
As an exit indicator on the default settings, it’s somewhat late, but that doesn’t preclude it from consideration, depending on settings. You’d have to see for yourself.
We’ll take a look at the signals on the default chart and see what Trendilo has to offer.
How We Use It
Long signal – When the red signal line crosses and closes above the zero line. The entry occurs on the open of the next candle.
Short signal – When the red signal line crosses and closes below the zero line. The entry occurs on the open of the next candle.
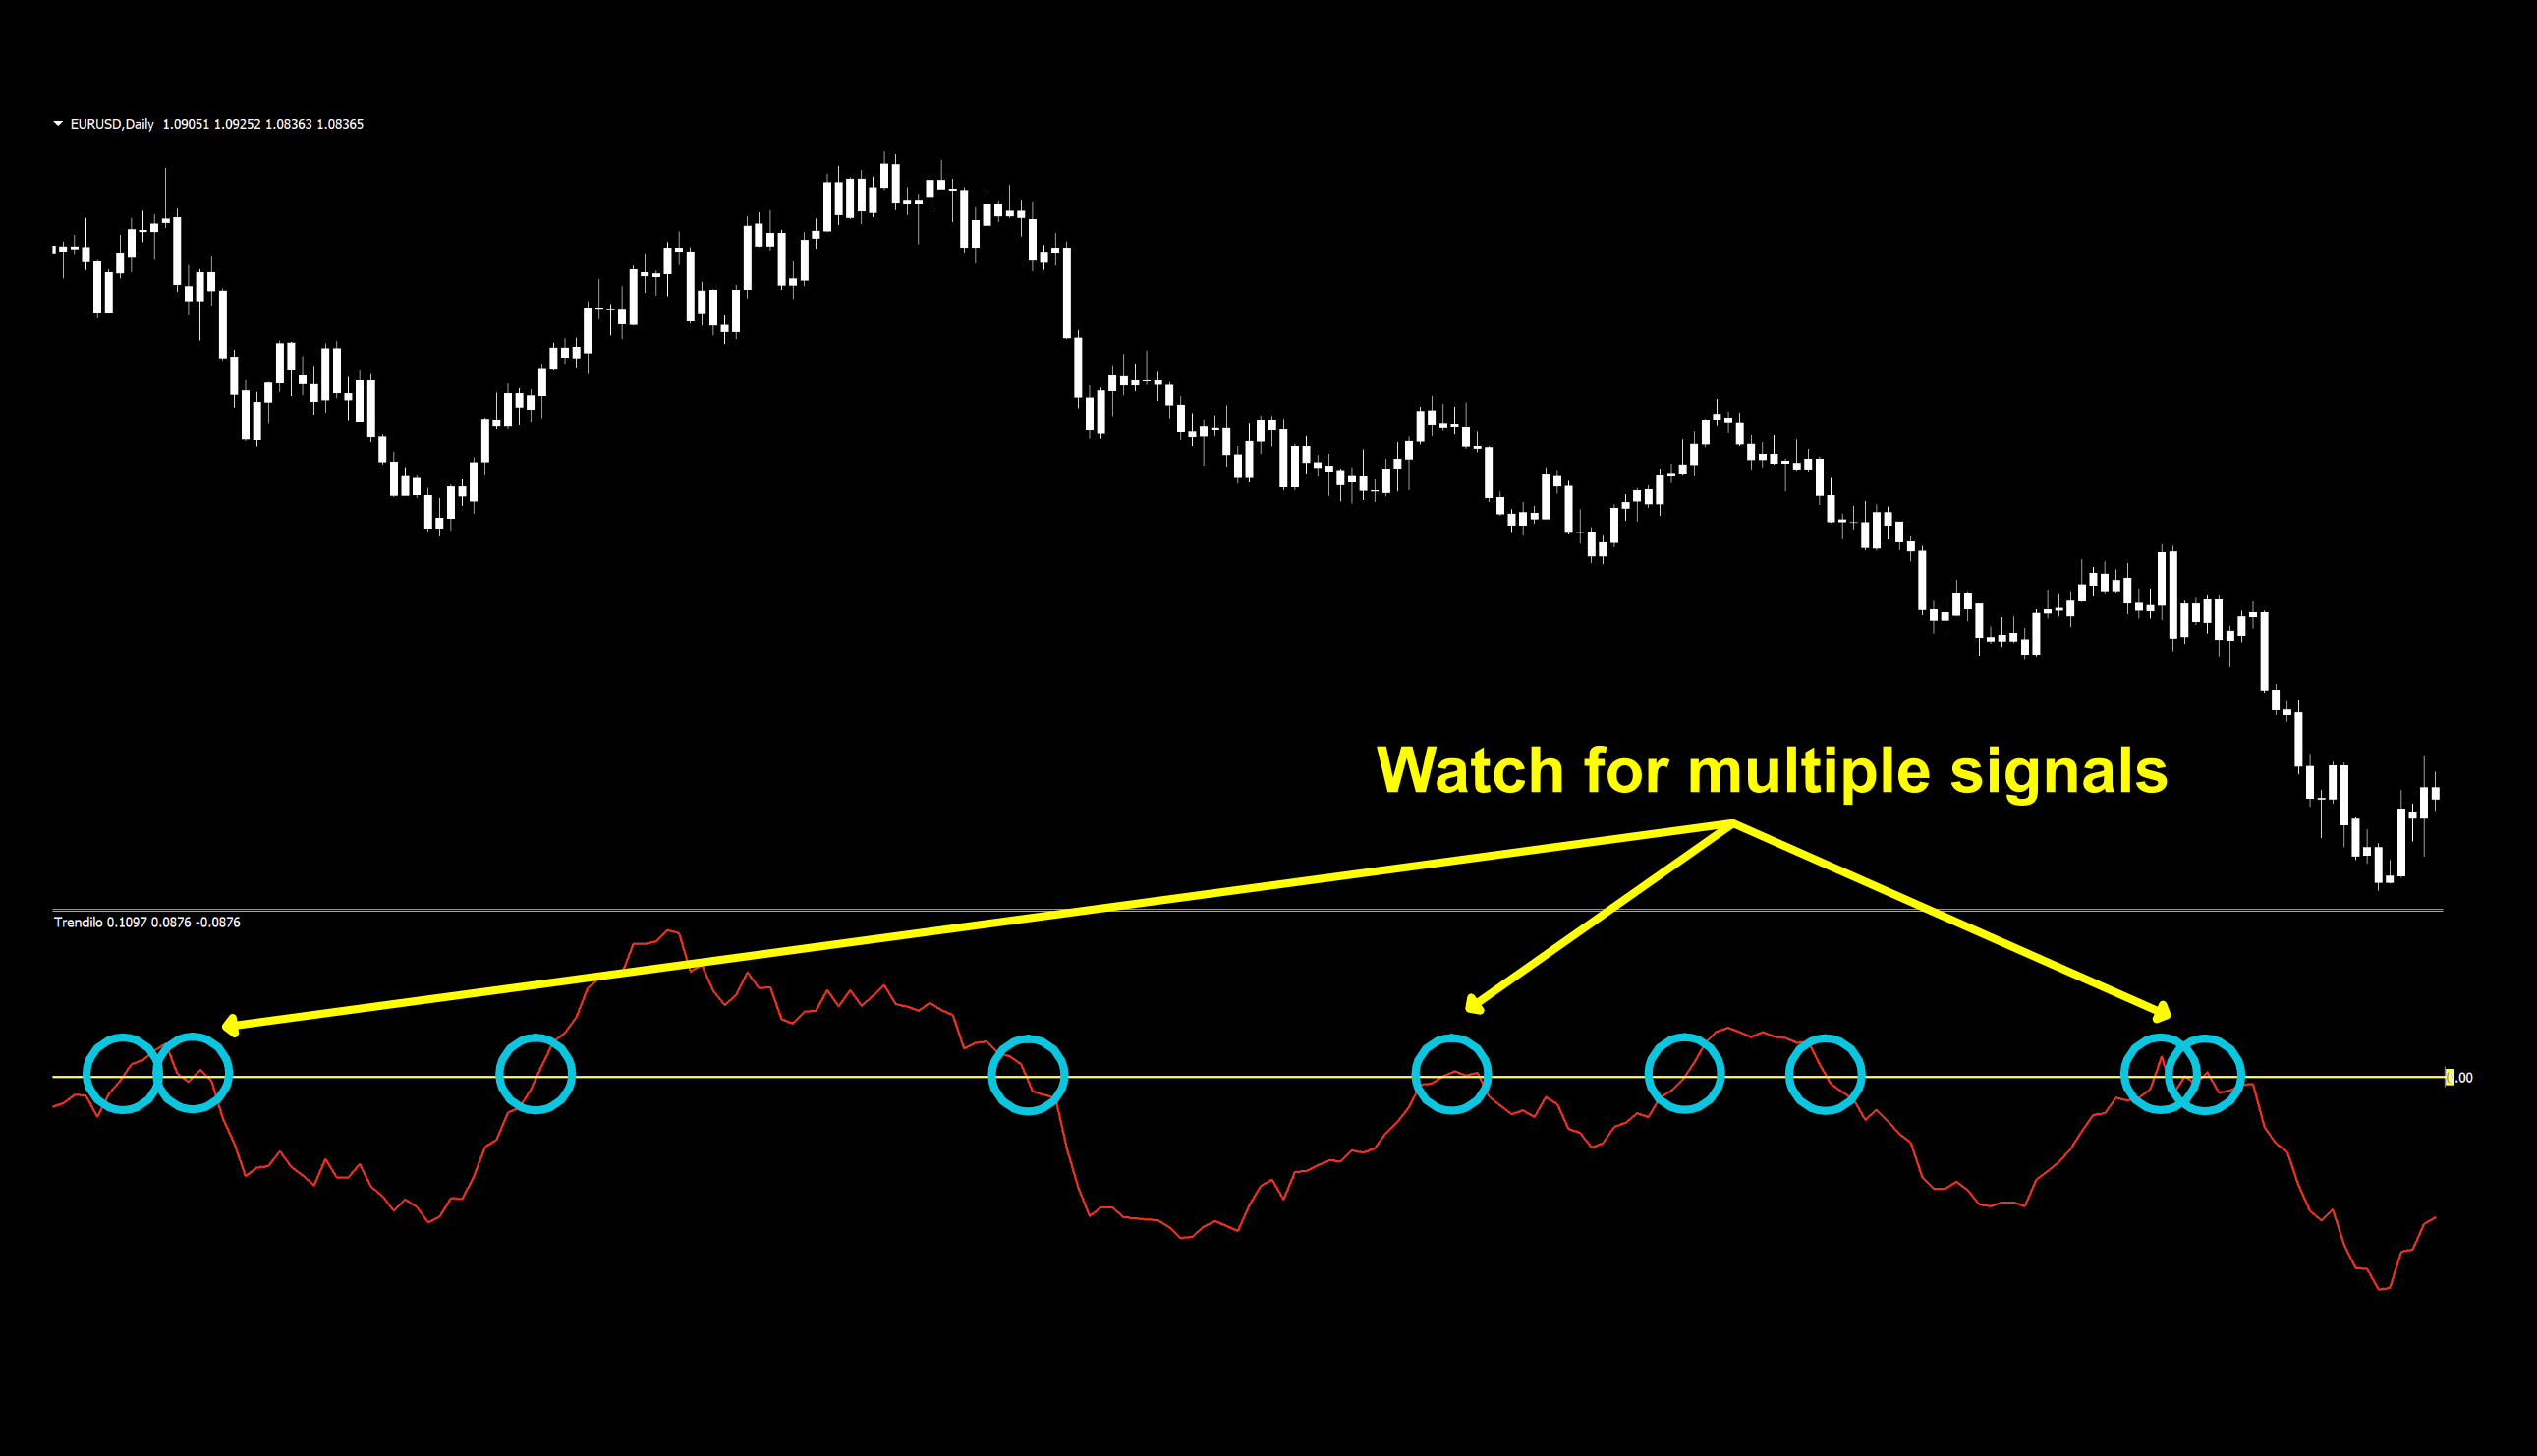
Congestion at the Zero Line
You can see there were three areas in the sample where multiple long/short signals were generated. This is normal. Indicators will react to price action dependent on the math within the indicator. This is why using indicators with adjustable variables, tweaking/testing them, and most importantly, why you never only use one indicator to make a trading decision.
Bonus!
While we could not find the original TradingView version of the indicator (for our TV indicator crowd), we were able to find the code. Feel free to copy and paste the code into a TV compiler for yourself.
//@version=4
study(“Trendilo”, overlay=false)
src=input(close, title=”Source”)
smooth = input(1, title=”Smoothing”, minval=1)
length = input(50, title=”Lookback”, minval=1)
offset = input(0.85, title= “ALMA Offset”, step=0.01)
sigma = input(6, title= “ALMA Sigma”, minval=0)
bmult = input(1.0, “Band Multiplier”)
cblen = input(false, “Custom Band Length ? (Else same as Lookback)”)
blen = input(20, “Custom Band Length”)
highlight=input(true)
fill=input(true)
barcol=input(false, “Bar Color”)
pch = change(src, smooth)/src * 100
avpch = alma(pch, length, offset, sigma)
blength = cblen ? blen : length
rms = bmult*sqrt(sum(avpch*avpch, blength)/blength)
cdir = avpch>rms ? 1 : avpch<-rms ? -1 : 0
col = cdir==1 ? color.lime : cdir==-1 ? color.red : color.gray
fplot = plot(avpch, color=highlight?col:color.blue, linewidth=2)
posrms = plot(rms, color=color.purple)
negrms = plot(-rms, color=color.purple)
fill(fplot, posrms, color=fill and cdir>0?col:na, transp=50)
fill(fplot, negrms, color=fill and cdir<0?col:na, transp=50)
barcolor(color=barcol?col:na)
hline(0)
Testing…Testing…Testing…
Remember, comprehensive analysis is strongly suggested, and we advocate backwards and forward testing indicators or systems prior to trading actual funds. We propose conducting your tests on the following pairs.
EUR/USD
AUD/NZD
EUR/GBP
AUD/CAD
CHF/JPY
CAD/SGD
If it doesn’t work on these 6 pairs, chances are it won’t work on other pairs. This is not an absolute, but we’ve found this rule is reliable in most cases.
The markets we test our indicators are the:
EUR/USD (Euro/US Dollar)
BTC/USD (Bitcoin/US Dollar)
XAU/USD (Gold/US Dollar)
SPX500 (S&P500 Index)
Timeframes and Results
In our initial test, we’ll run the Trendilo indicator on the EUR/USD, BTC/USD, XAU/USD, and the SPX500 using the default settings across the daily and 4-hour timeframes on the MT4 strategy tester. We use the fast method of testing the indicator to get a general idea; however, you may also run the tick-by-tick data set for a more precise result (which takes considerably more time).
As No Nonsense Traders – and therefore Swing Traders, we will not examine shorter time frames in these studies. We will also run an additional test, using different values for the settings, to analyze which one may work better and examine the following results:
Total trades
Win/Loss ratio
ROI (return on investment)
There are other metrics included in the strategy tester report, which can be compared, but these three metrics provide the necessary gauge to make quick decisions as to the usefulness of a particular indicator and its settings.
Next, for comparison, we’ll explore the following;
Daily – 1 year
4-hour – 3 months
The reason exceptionally long (or short) testing periods are not included is due to changing market conditions, which might return irrelevant information. A balance of statistically significant data is necessary for accurate results.
And the Outcome…
Below are the spreadsheets illustrating the results from our tests.
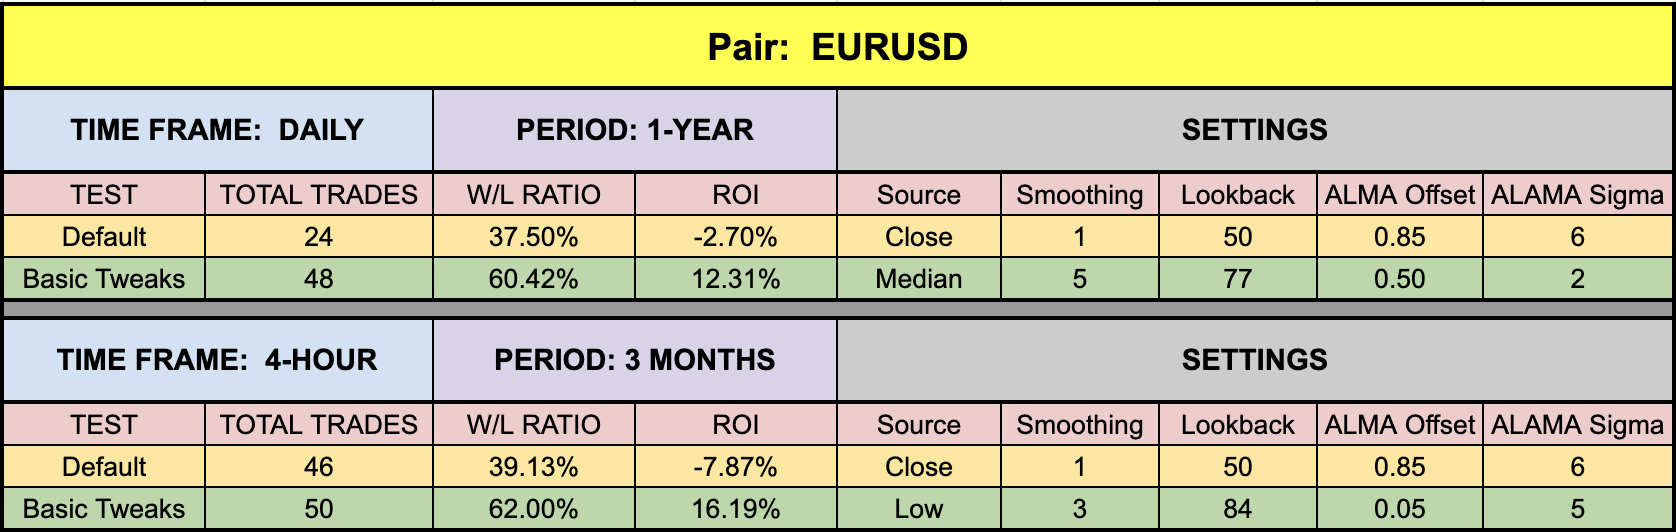
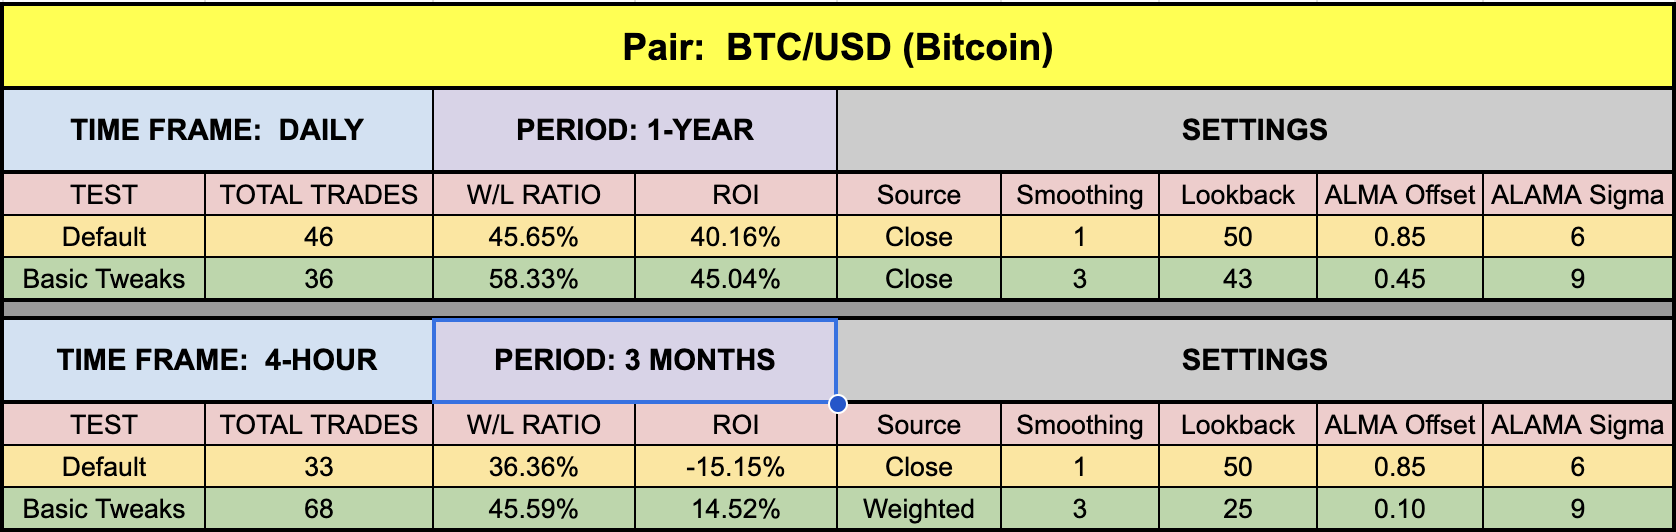

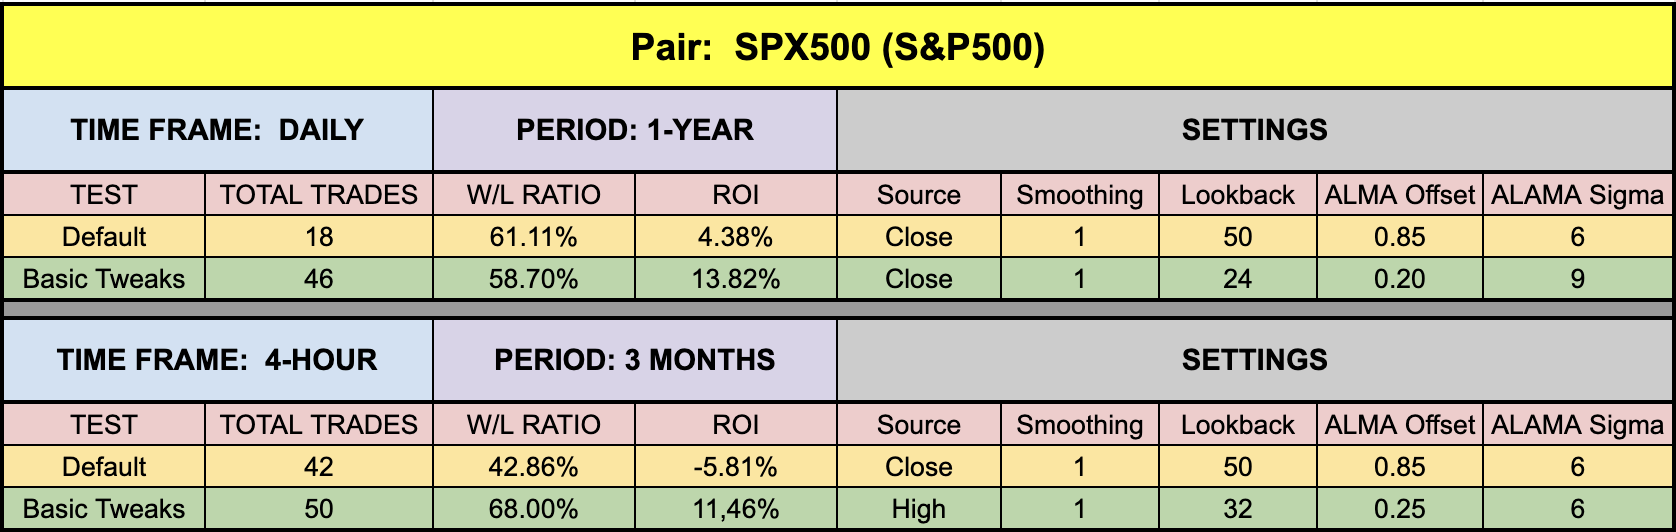
The green highlighted rows represent “basic tweaks” on the settings which returned better results. Are these the best? Not necessarily. Given that variables including testing date range and broker data are different from person to person, you may find better settings.
Trust In Yourself
Remember, the overall NNFX philosophy of taking profit, risk, and drawdown is that YOU are creating a system which YOU will be trading. Don’t let anybody else take that away from you. Part of the learning process is digging in and doing the work yourself. To learn more about these topics, check out the Advanced Course!
That being said, the results we post in these blogs should never be considered specific trading advice.
***Note: Remember, never use just this one indicator as your decision of whether to open or close a trade. It should be part of a system.
Money Management
If you are curious as to what money management is used on our tests; we have a certain way of determining wins and losses, which can be found in the Advanced Course. Our goal here is to determine how well the indicator reacts to price with respect to producing a long or short signal. Your system, with its risk profile, will dictate individual returns.
Resources
As we did with past indicator studies, we’ve made the Trendilo is available for download on our site from the indicator library. We will keep adding better indicators with each study for your use, at no charge. When you’re ready to get it, click HERE.
More to Come
There’s a lot more to come. We are excited to provide more trading tips in the near future. Sign up on our contacts page or subscribe to our YouTube channel. Receive early notifications as we continue to publish helpful, relevant, and informative Forex related material to support your quest to become a better trader.
And, now you are aware of another indicator that many traders don’t know or use.
Our only goal is to make you a better trader.
BTW – Any information communicated by Stonehill Forex Limited is solely for educational purposes. The information contained within the courses and on the website neither constitutes investment advice nor a general recommendation on investments. It is not intended to be and should not be interpreted as investment advice or a general recommendation on investment. Any person who places trades, orders or makes other types of trades and investments etc. is responsible for their own investment decisions and does so at their own risk. It is recommended that any person taking investment decisions consults with an independent financial advisor. Stonehill Forex Limited training courses and blogs are for educational purposes only, not a financial advisory service, and does not give financial advice or make general recommendations on investment.