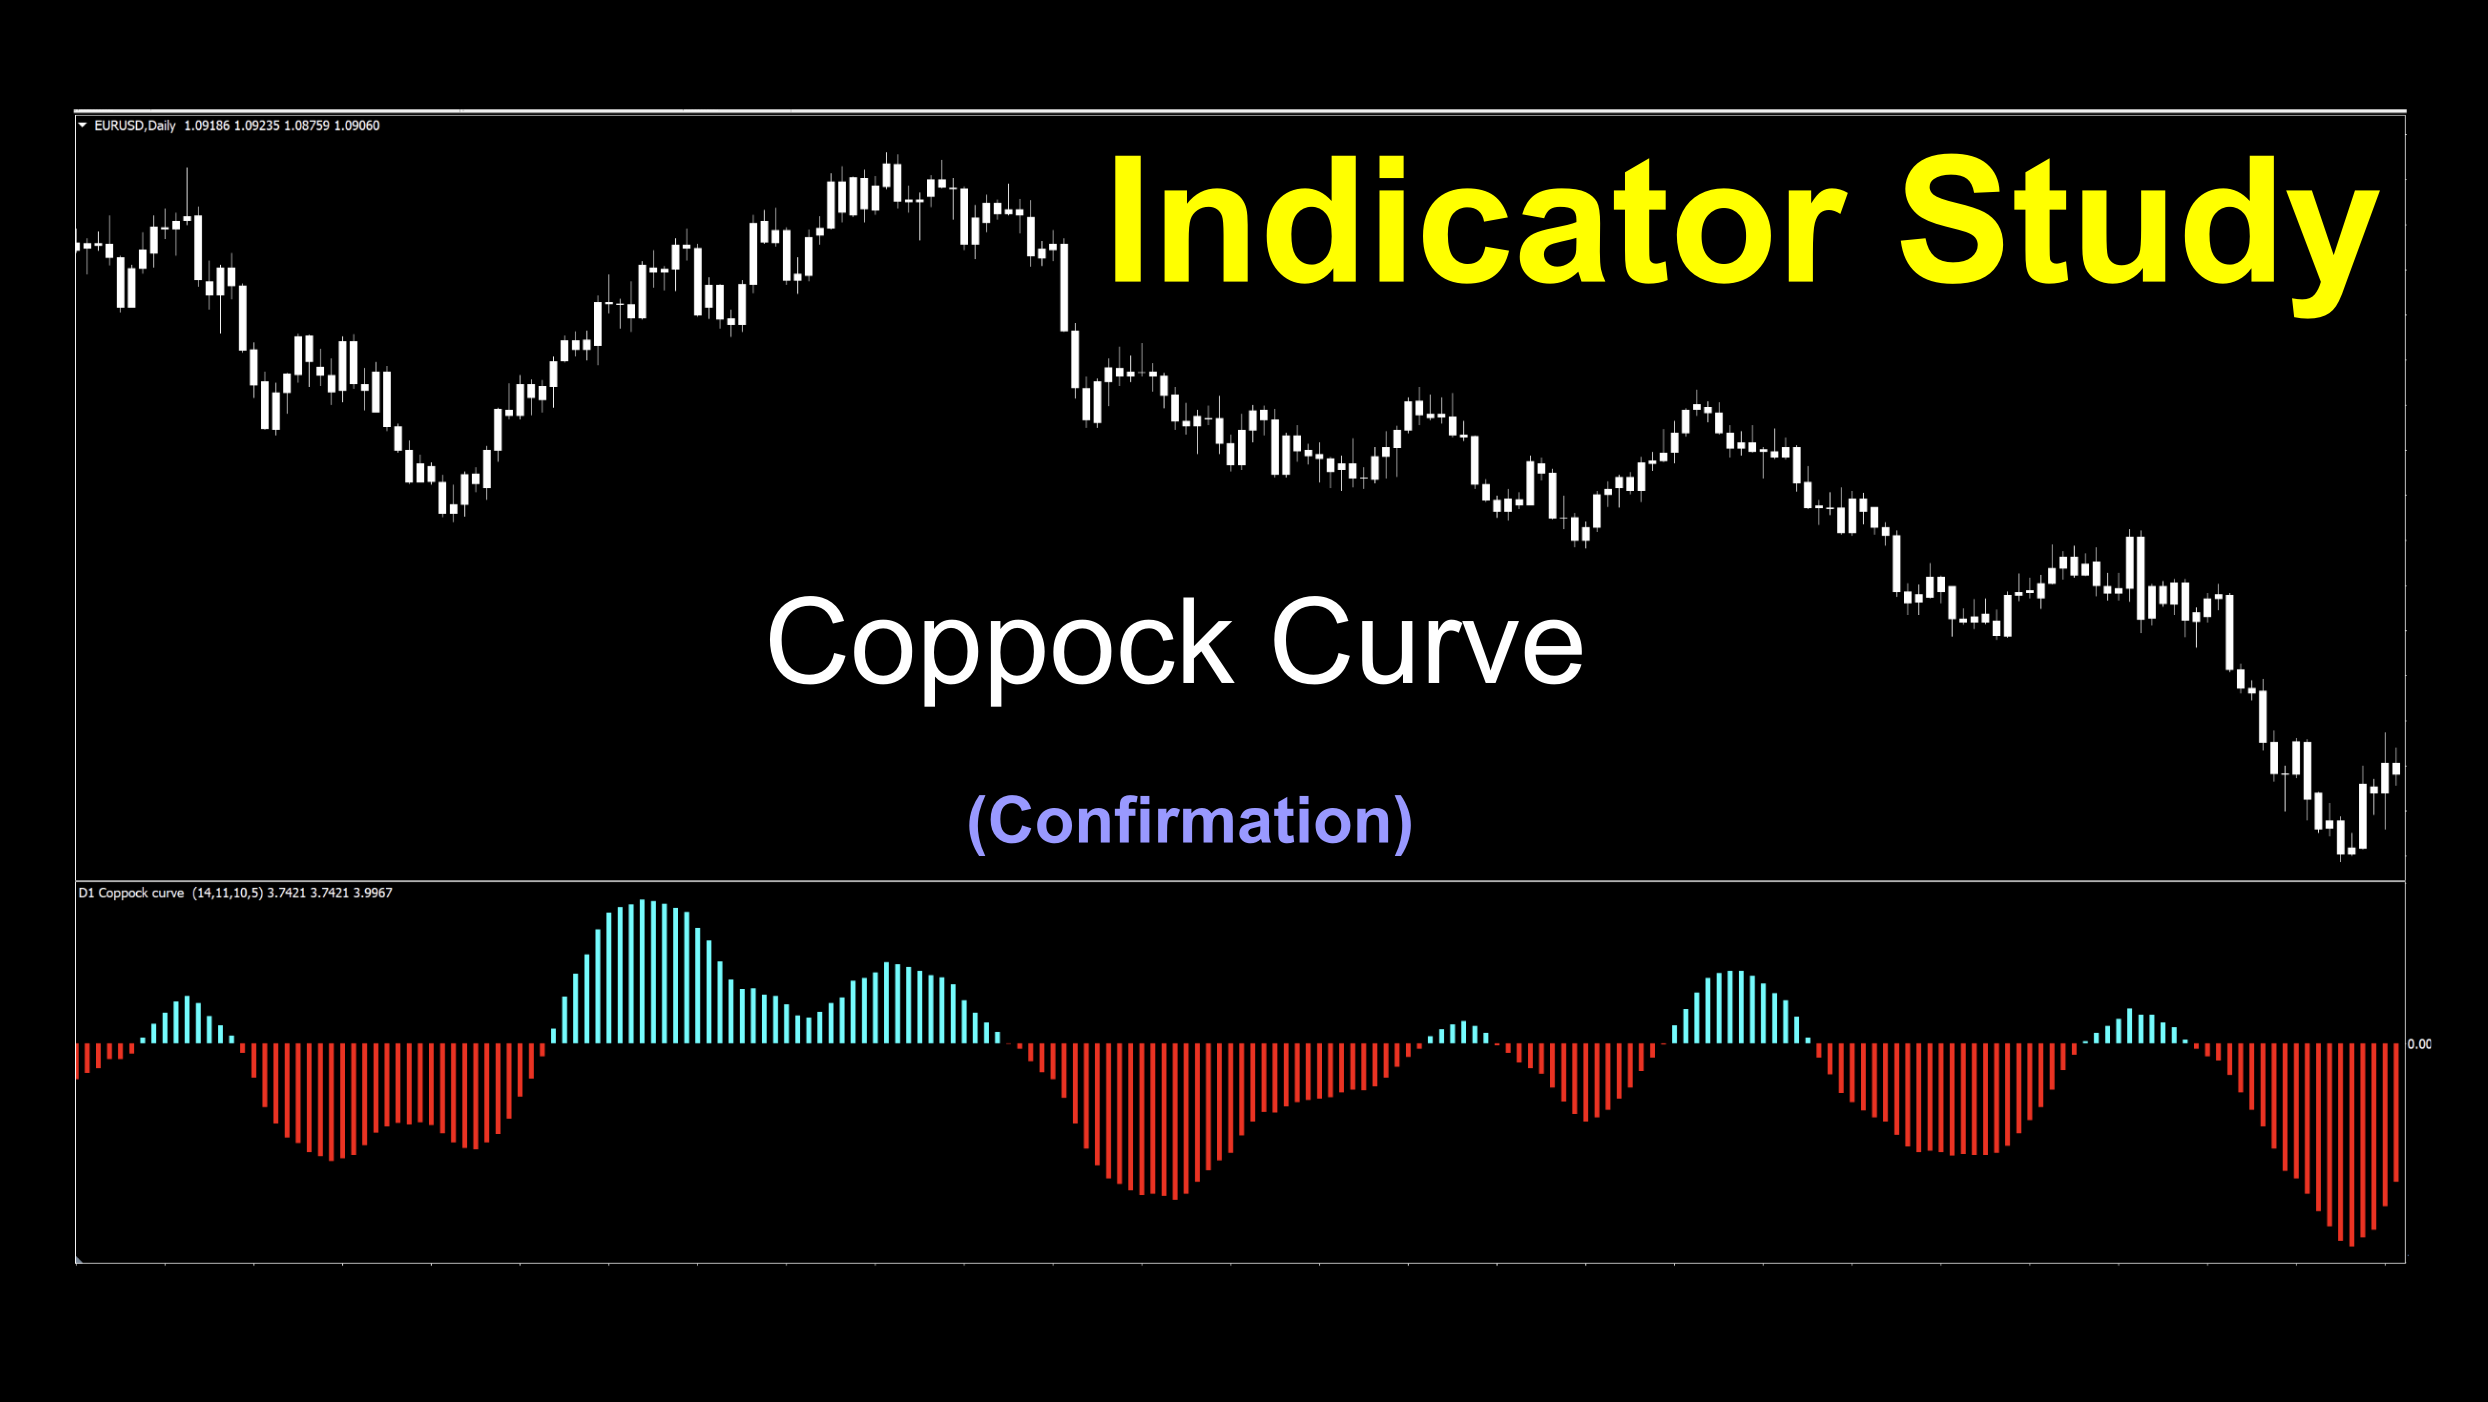
Coppock Curve
Far Out, Man!
Okay, so this definitely doesn’t meet with our usual date sensitive indicator profile series, but when we found this one, dug into the history and then starting fooling around with it, VP and I thought it was too good to pass up. Ironically, it wouldn’t be that surprising if it was part of the default indicator listing in MT4 considering its age. How old, you ask? Let’s go find out!
Oh, Say, Can You See?
The video on this one is really easy on the eyes. Especially after we cleaned it up and brightened it a bit. Be sure you spend a few minutes watching the technical analysis either here in the blog, or on YouTube to see how groovy this indicator reacts with price action. It’ll be a gas!
Outta Sight
The Coppock Curve indicator was developed by an economist named Edwin Coppock in 1962 and was first introduced in that year’s October issue of Barron’s Magazine. By the way, Barron’s’ has been around since 1921…so there’s definitely a lot of history here. Initially developed for long term monthly charts, shorter timeframes resulted in more frequent signals. This aligns well with our trading philosophy of swing trading on the daily time frame. Now it gets interesting…
Quid dicere? (Latin for “Say What?)
This indicator’s settings (which we’ll talk more about later) were actually suggested by the Episcopalian Church. Yes, you read that right. The default settings were proposed by the Bishops of the church. The reason will be explained below. Shall we risk changing those holy settings to see what happens?
Mathematica
More Latin, but you’ve got that one figured out. The basis of the Coppock Curve indicator is a momentum confirmation indicator which oscillates above and below zero and lives in a separate window below price. Simple enough, right? Let’s look at the formula.
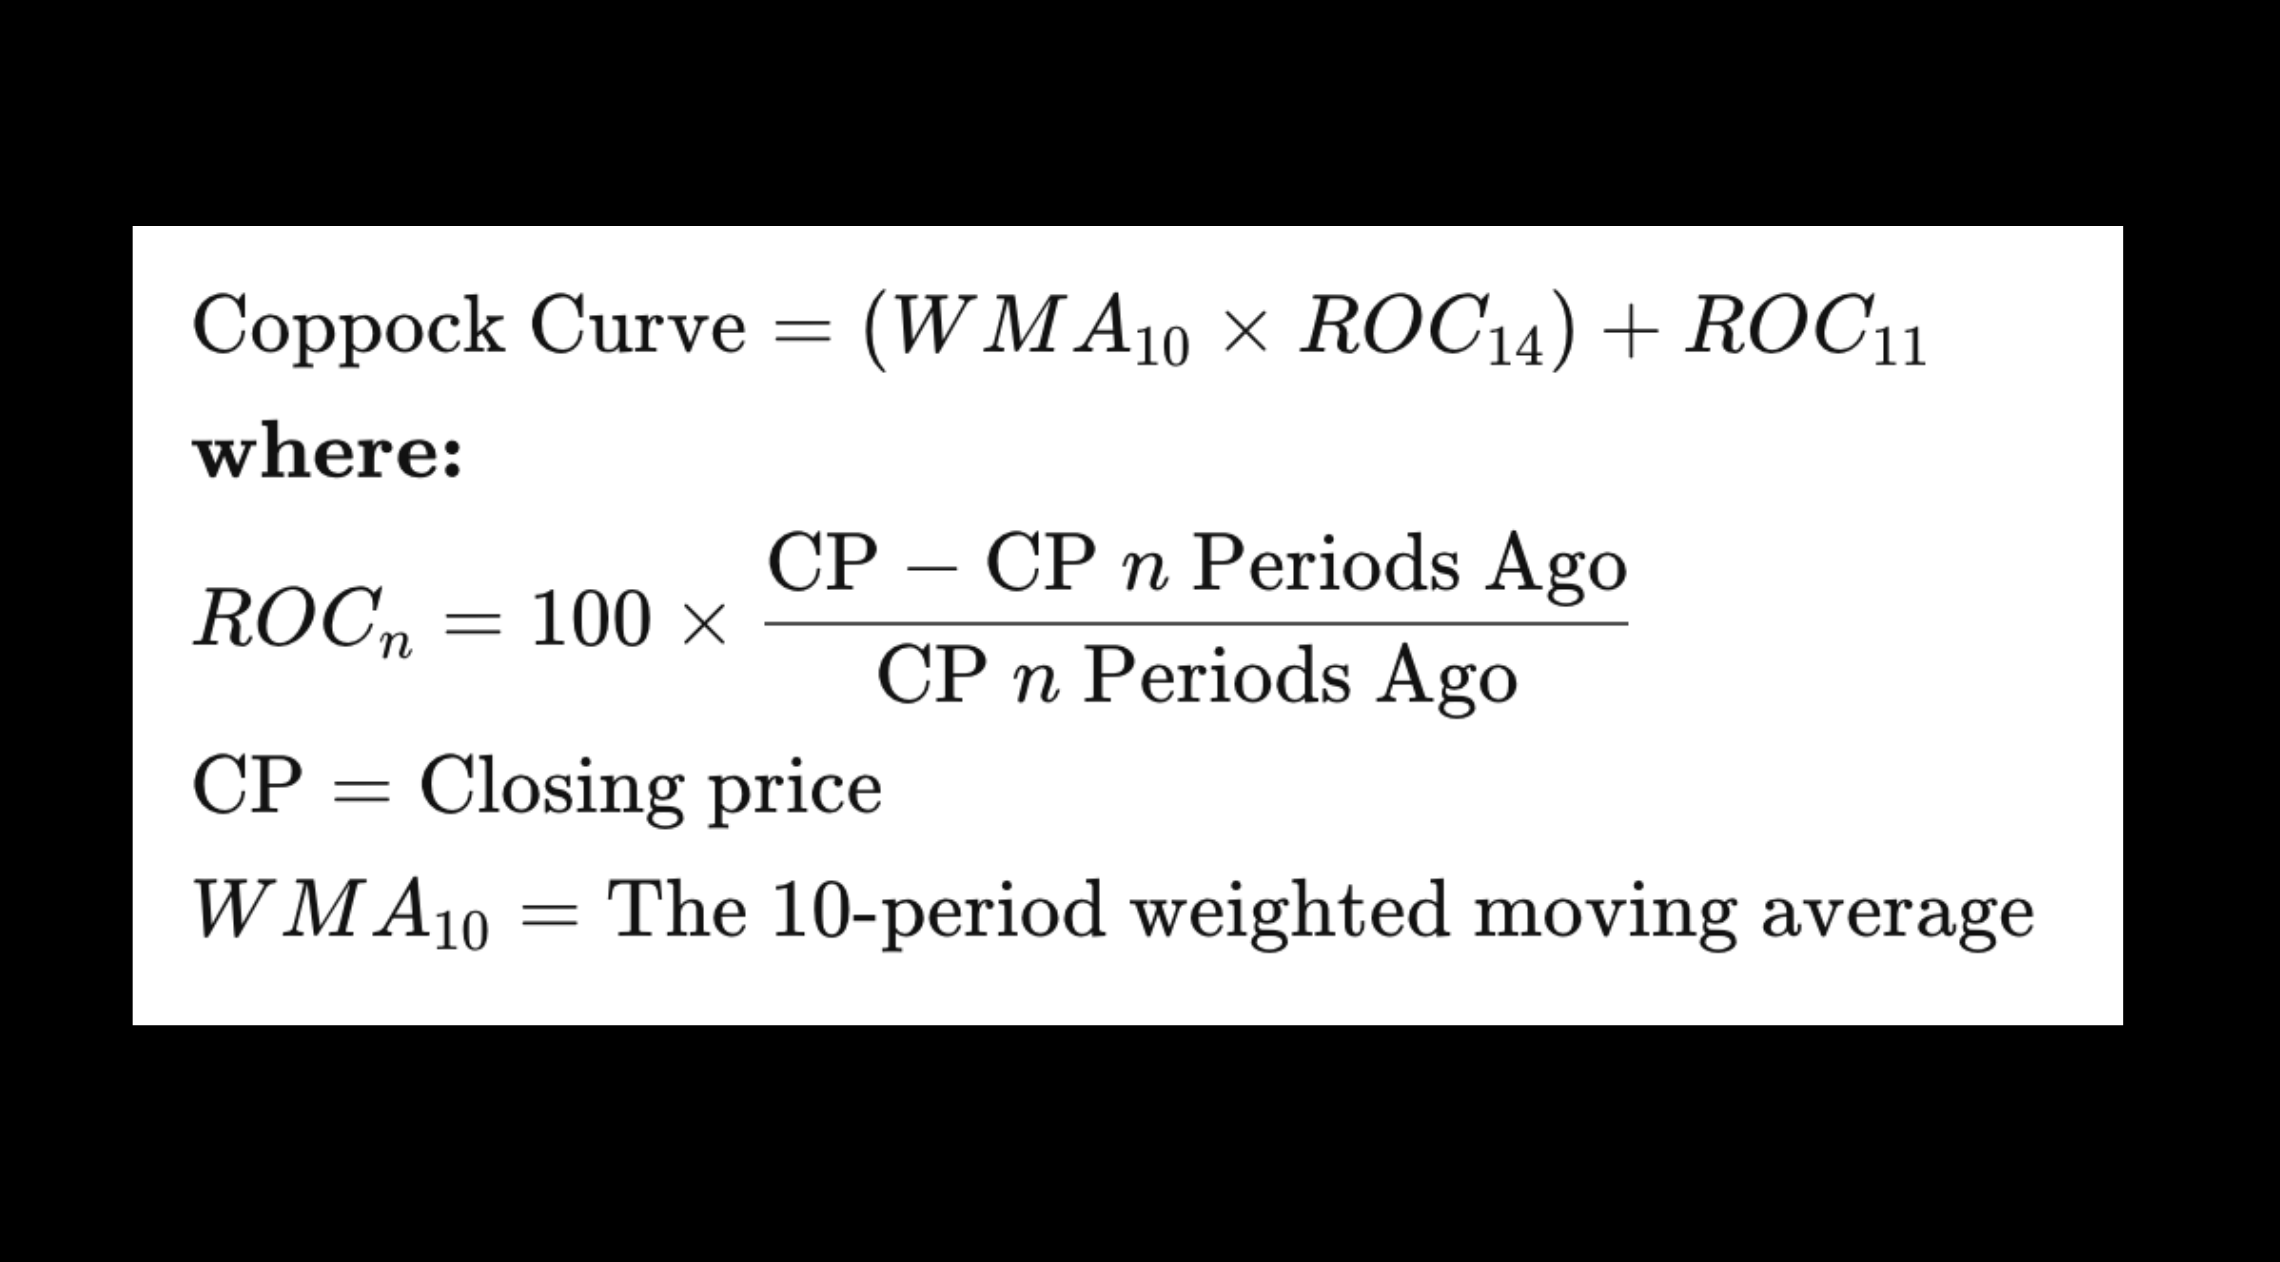
ROC stands for “Rate of Change”. This indicator uses two ROC lengths (short and long) with a WMA (weighted moving average) to help smooth things out. Simply stated, the Rate of Change is the percentage change between the current price with respect to an earlier closing price a specific quantity of prior periods. The Coppock Curve is calculated as a 10 period WMA of the sum of the 14 period rate of change and the 11 period rate of change for the currency pair. Neato! Let’s boogie…
A Lot and a Little
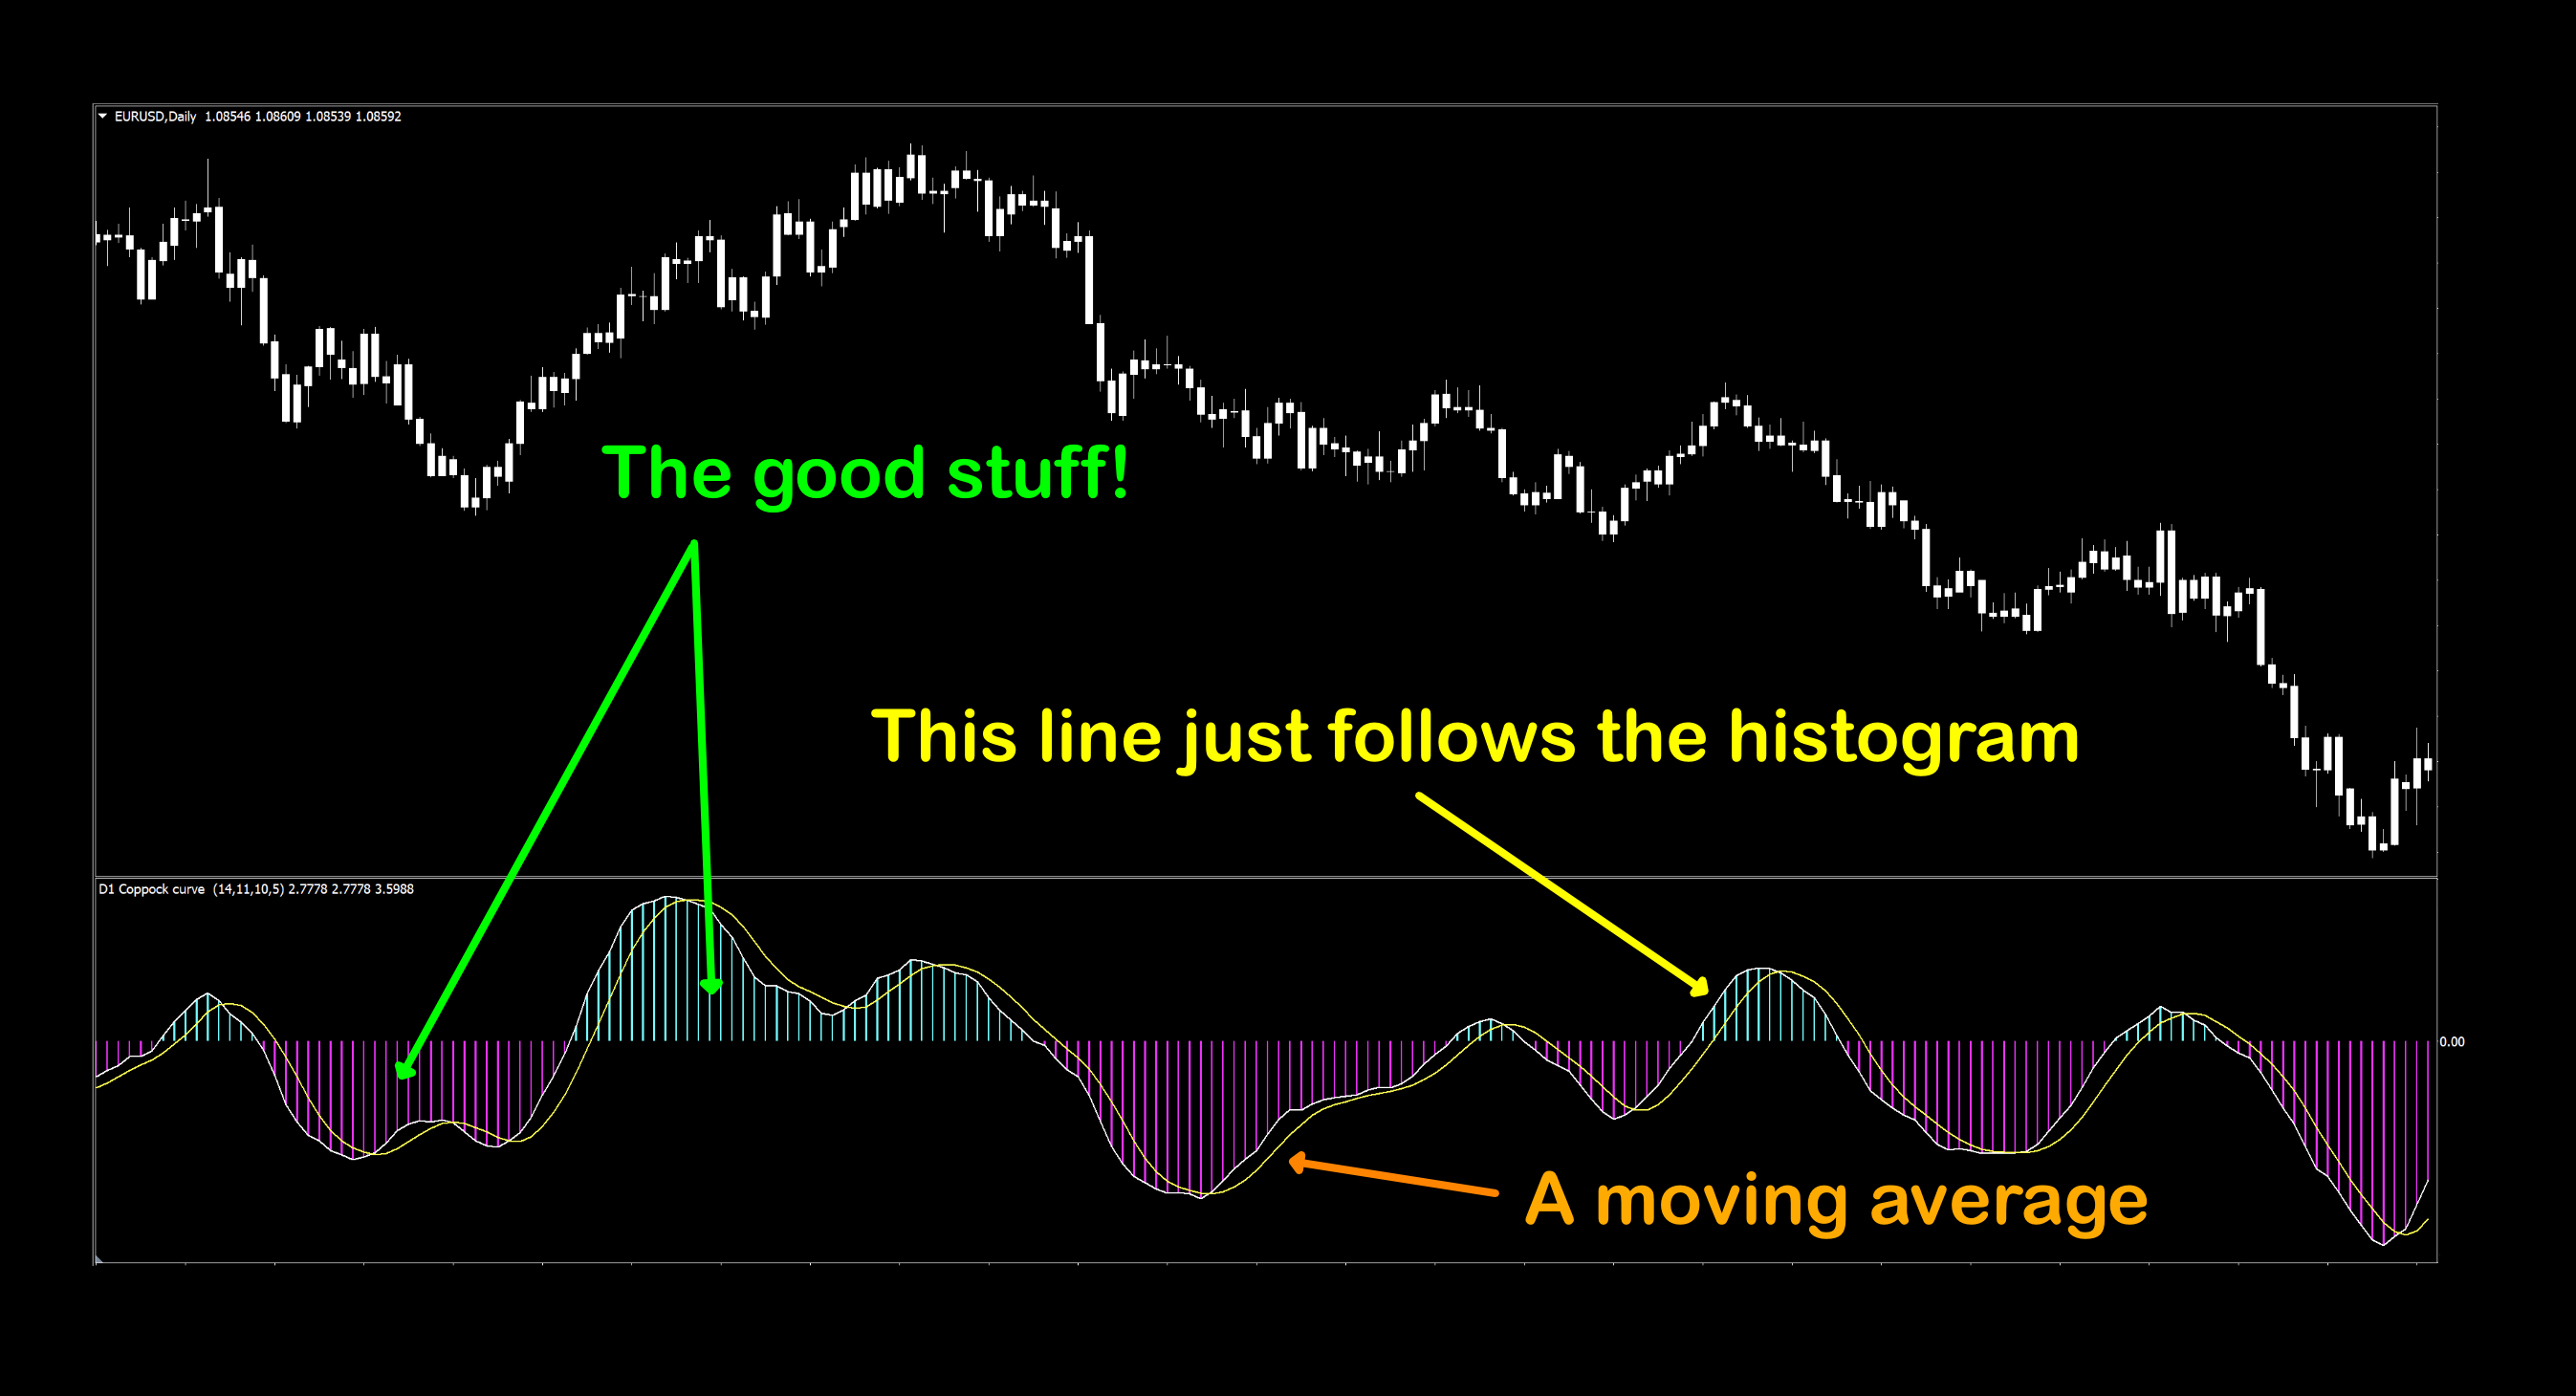
As a matter of keeping with best practices, we’ll look at the default chart, so you’ll see what we’ve done to make it easier to use. The default view has two signal lines – one that follows the histogram and one that is a moving average line. The only thing we did was brighten up the lines for better visibility. We’ll get rid of those and change the colors in the second snapshot. It’s the second version we’ll be using for our video, analysis and testing purposes.
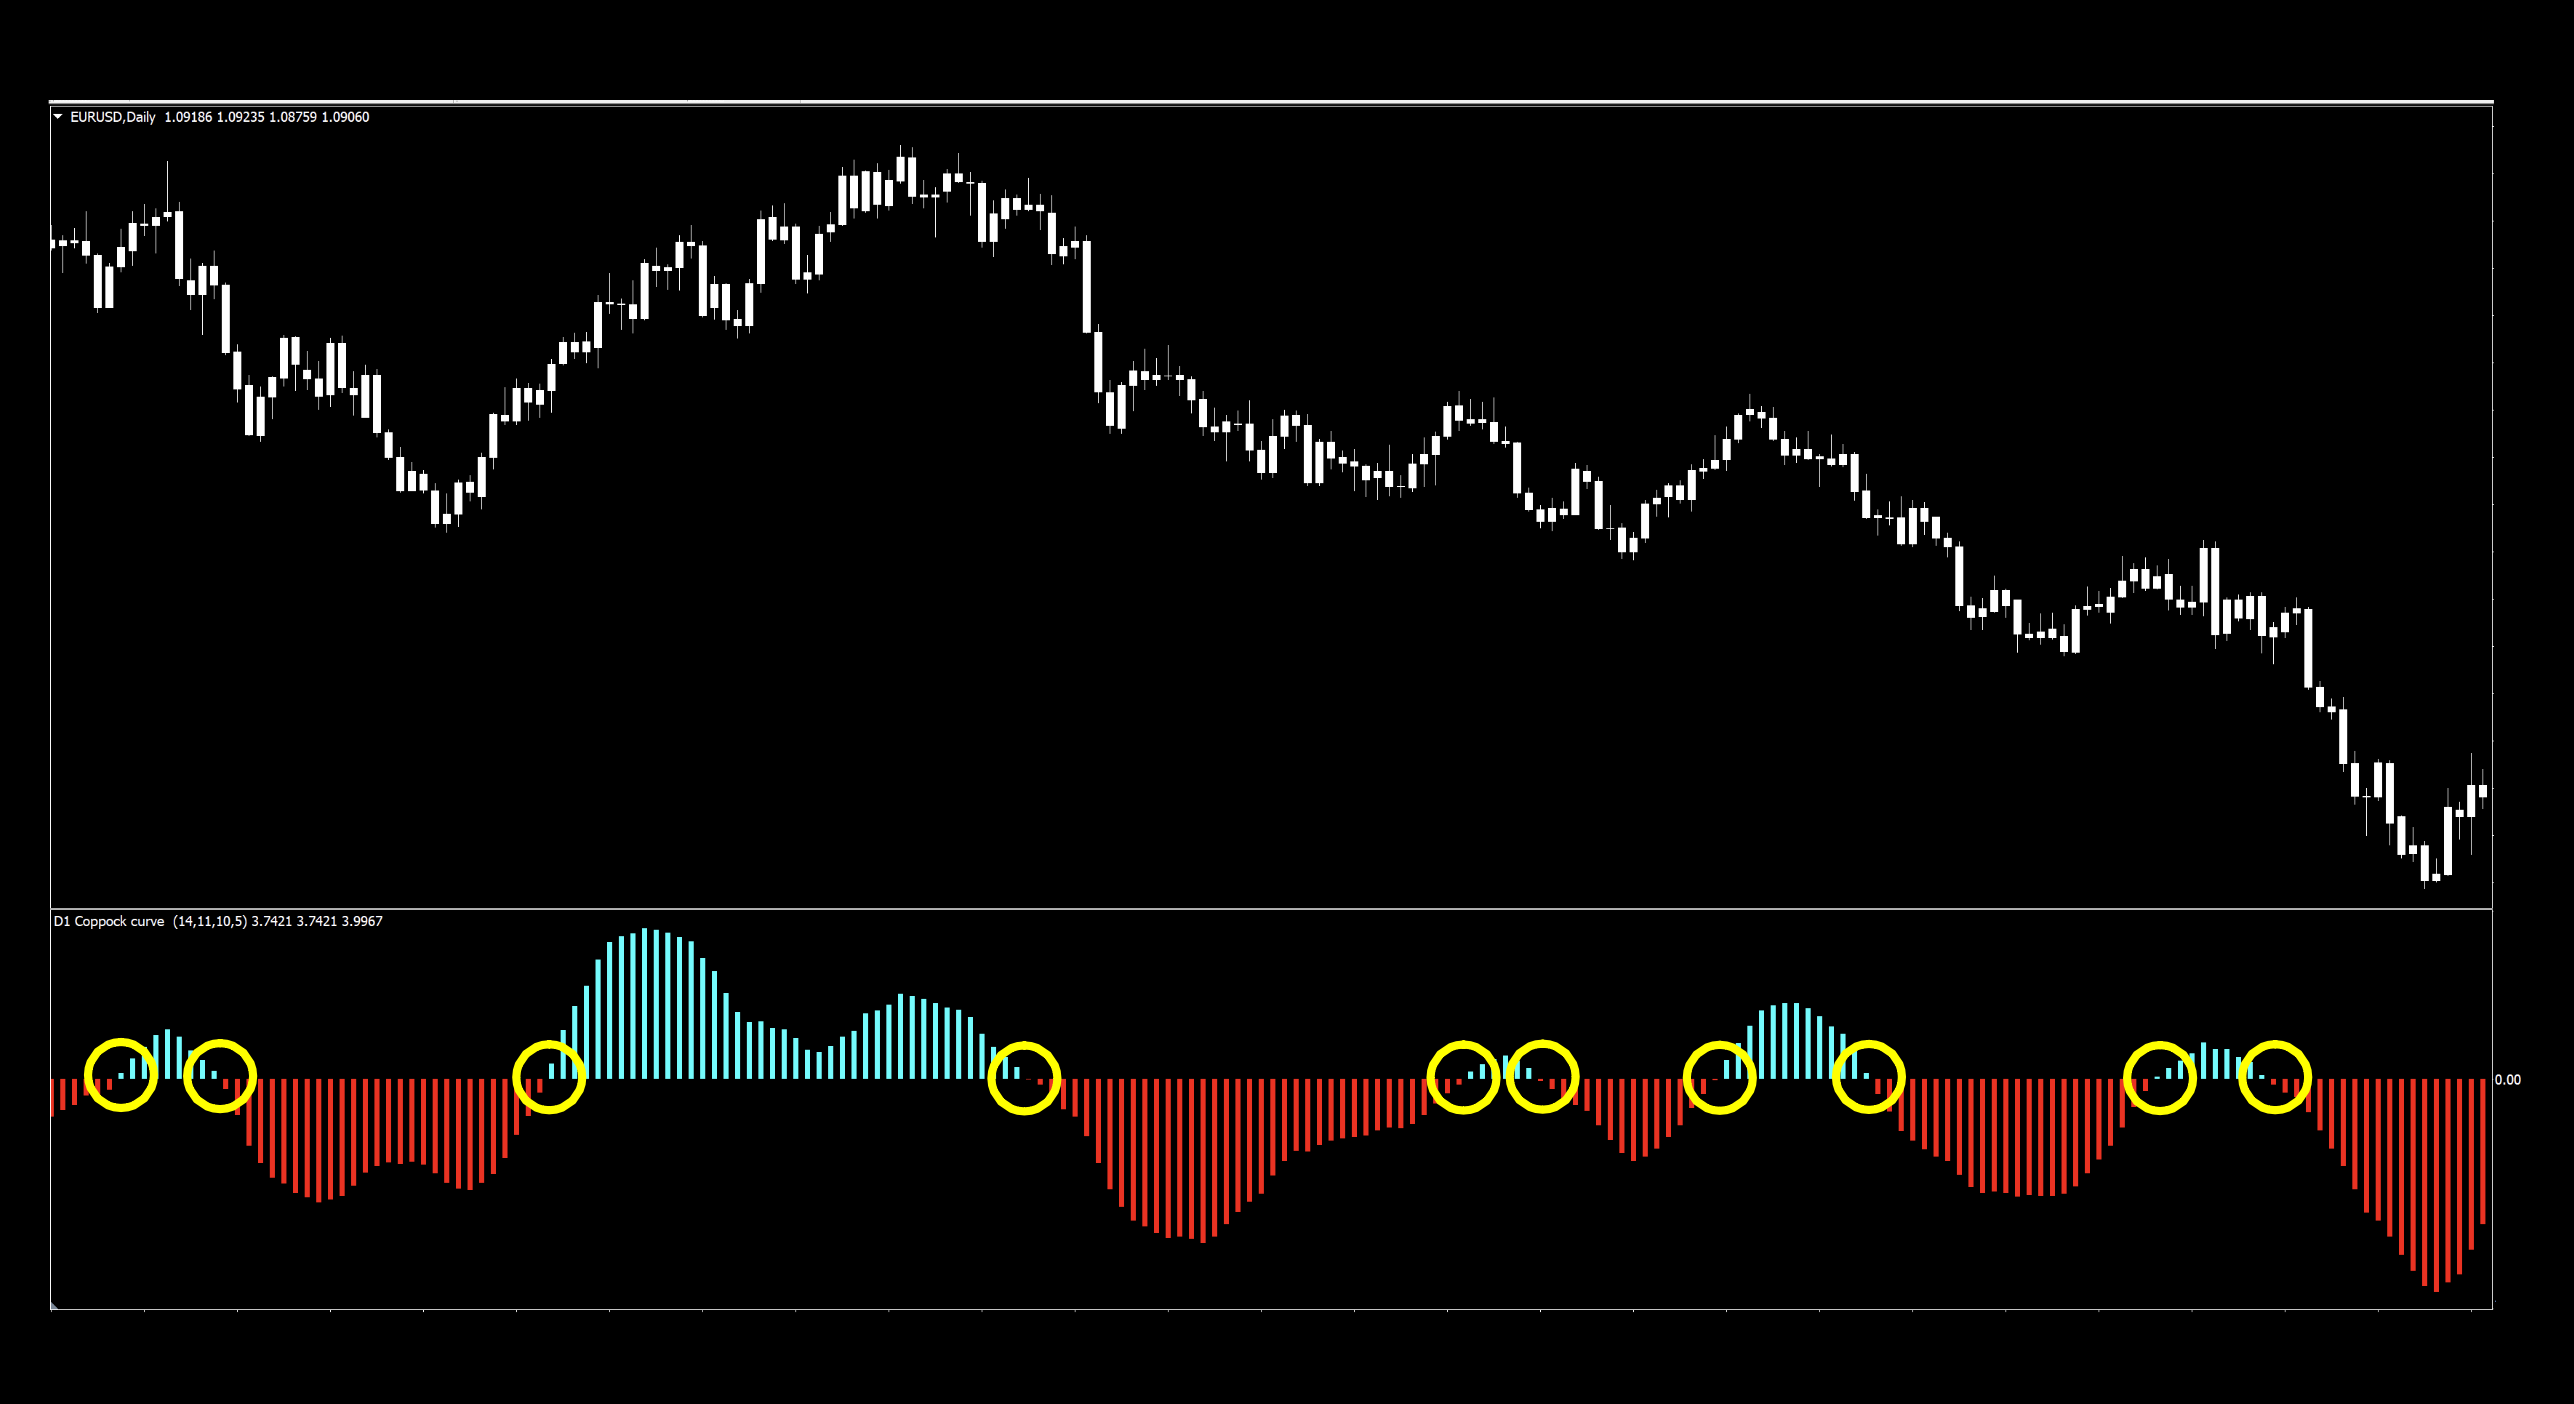
We made a few changes which definitely make for an easier view. Check this out…
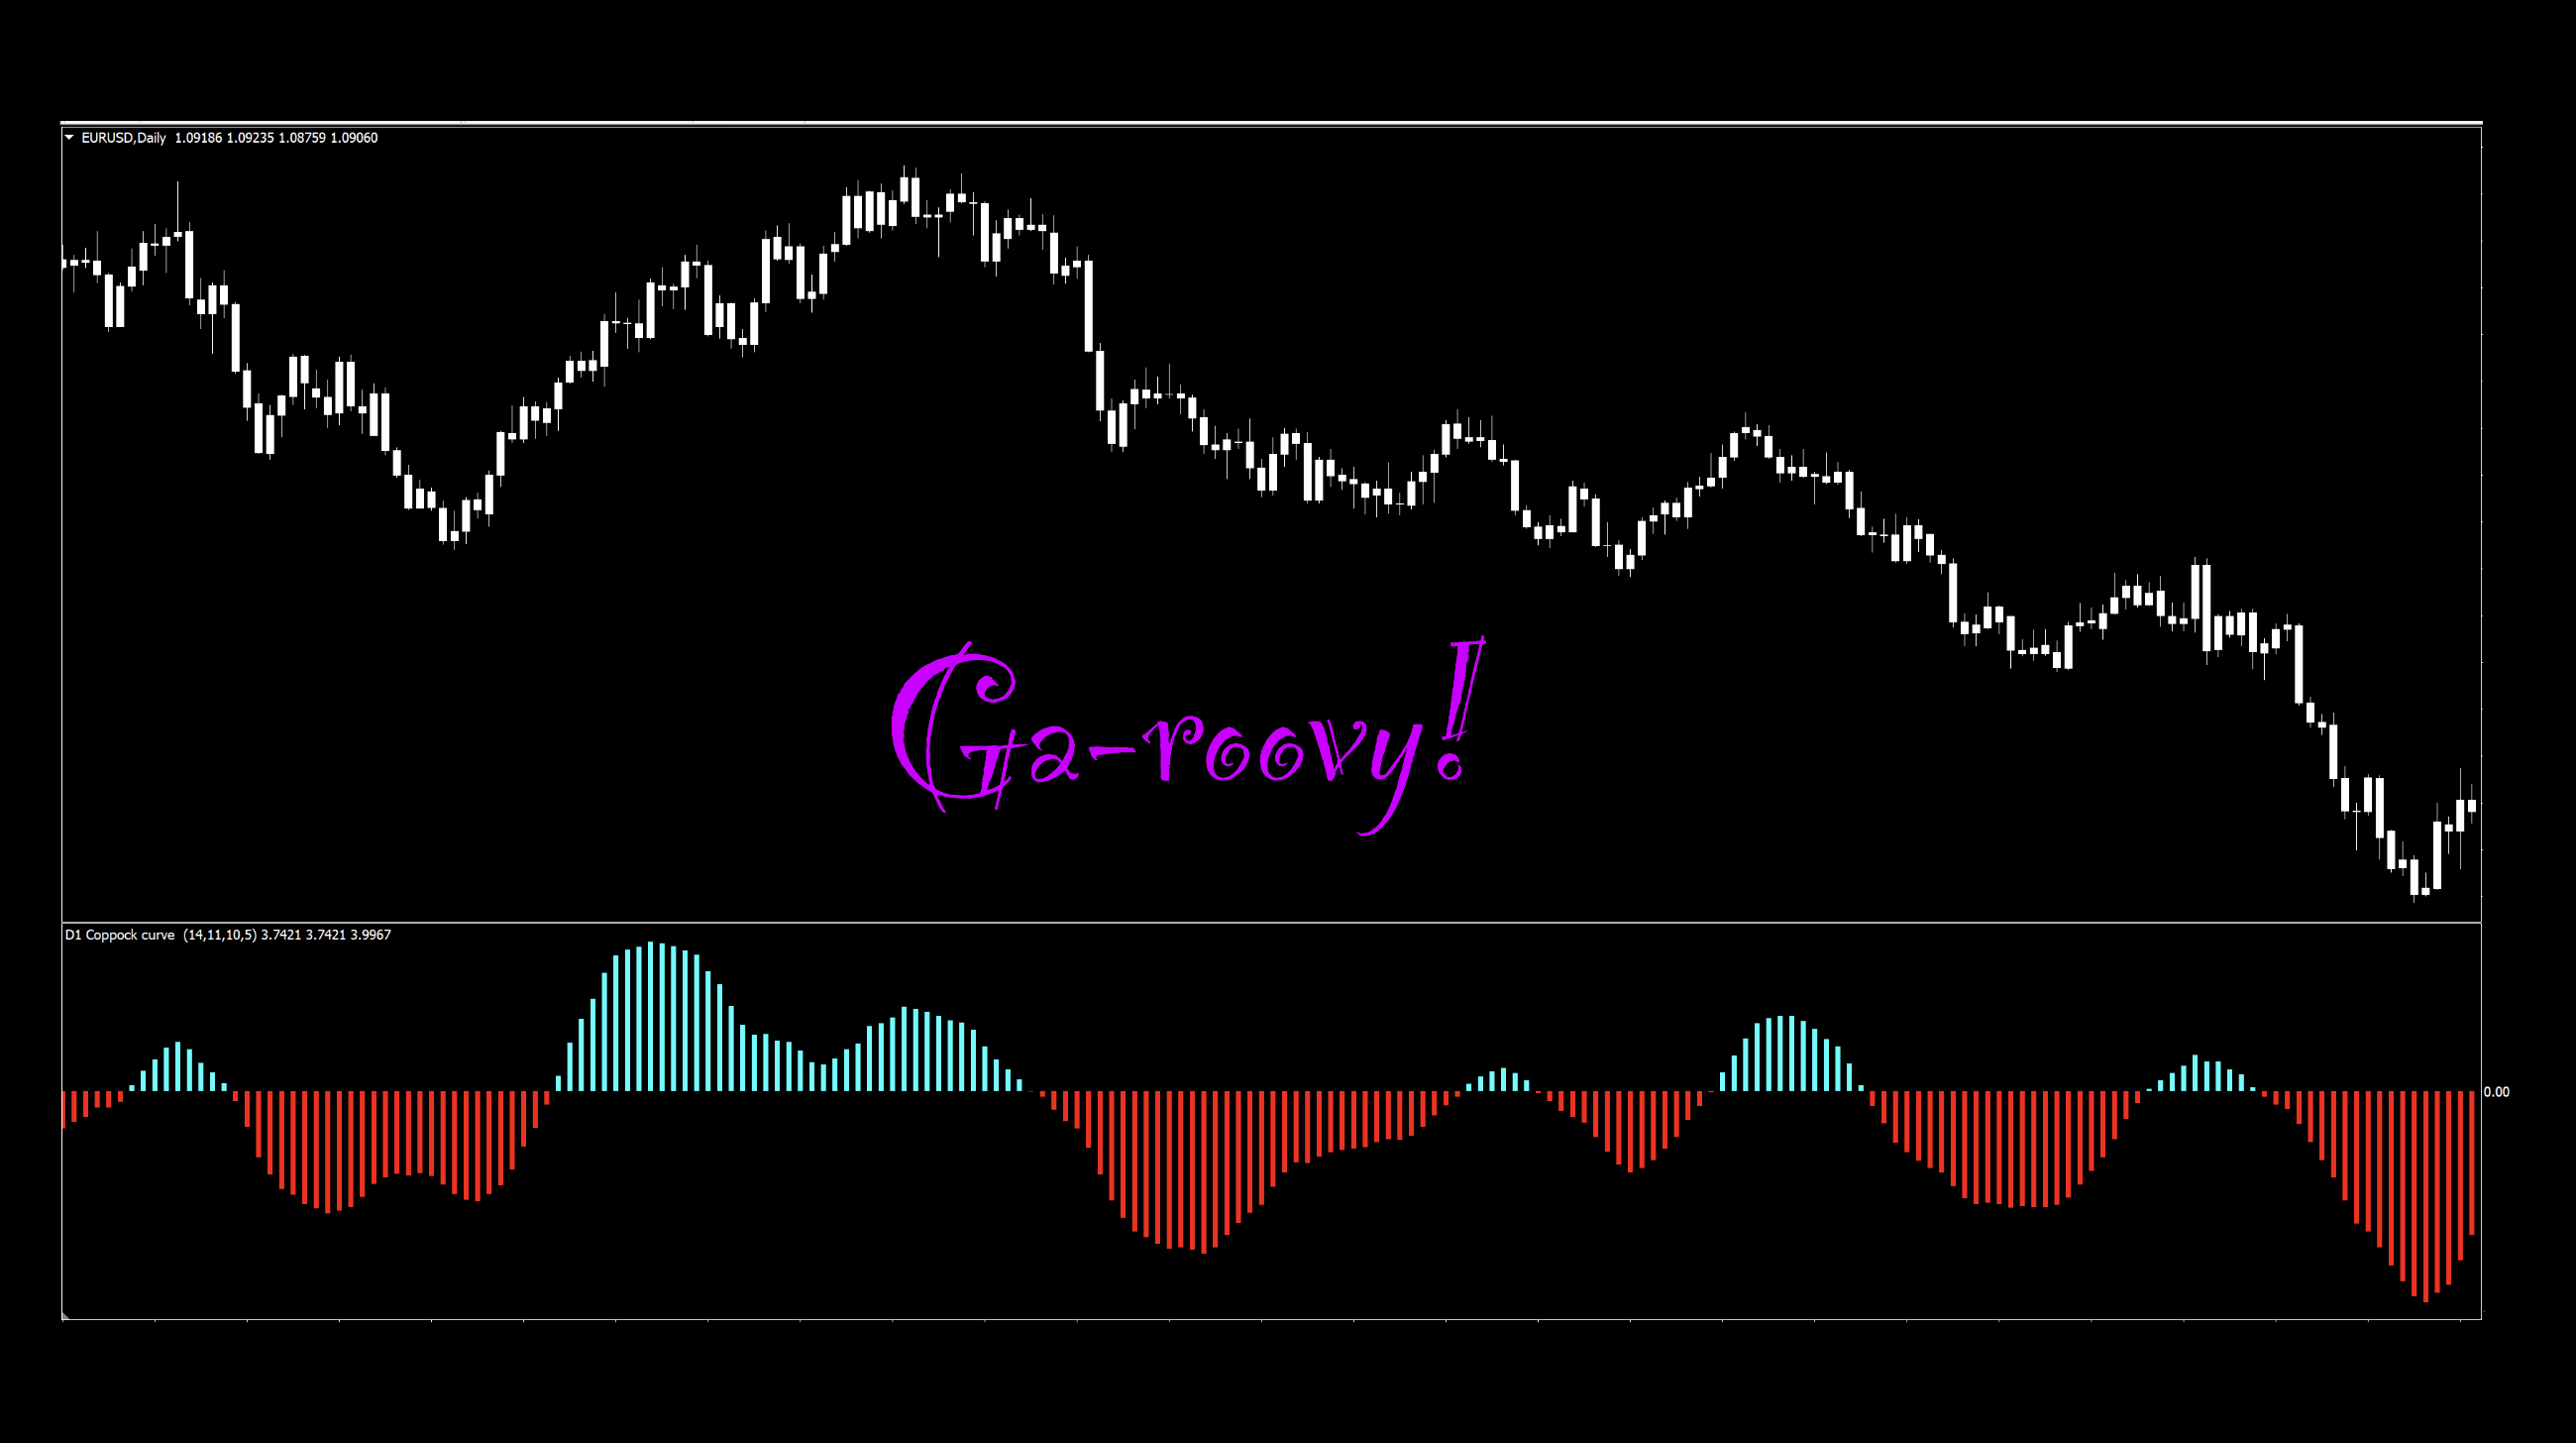
Better, right? Easy to see signals. Before we get to the signals, let’s take a peek at the settings.
The Coppock Curve indicator has two groups of settings. The first three after “Current time frame” apply to us. The second group won’t apply to us.
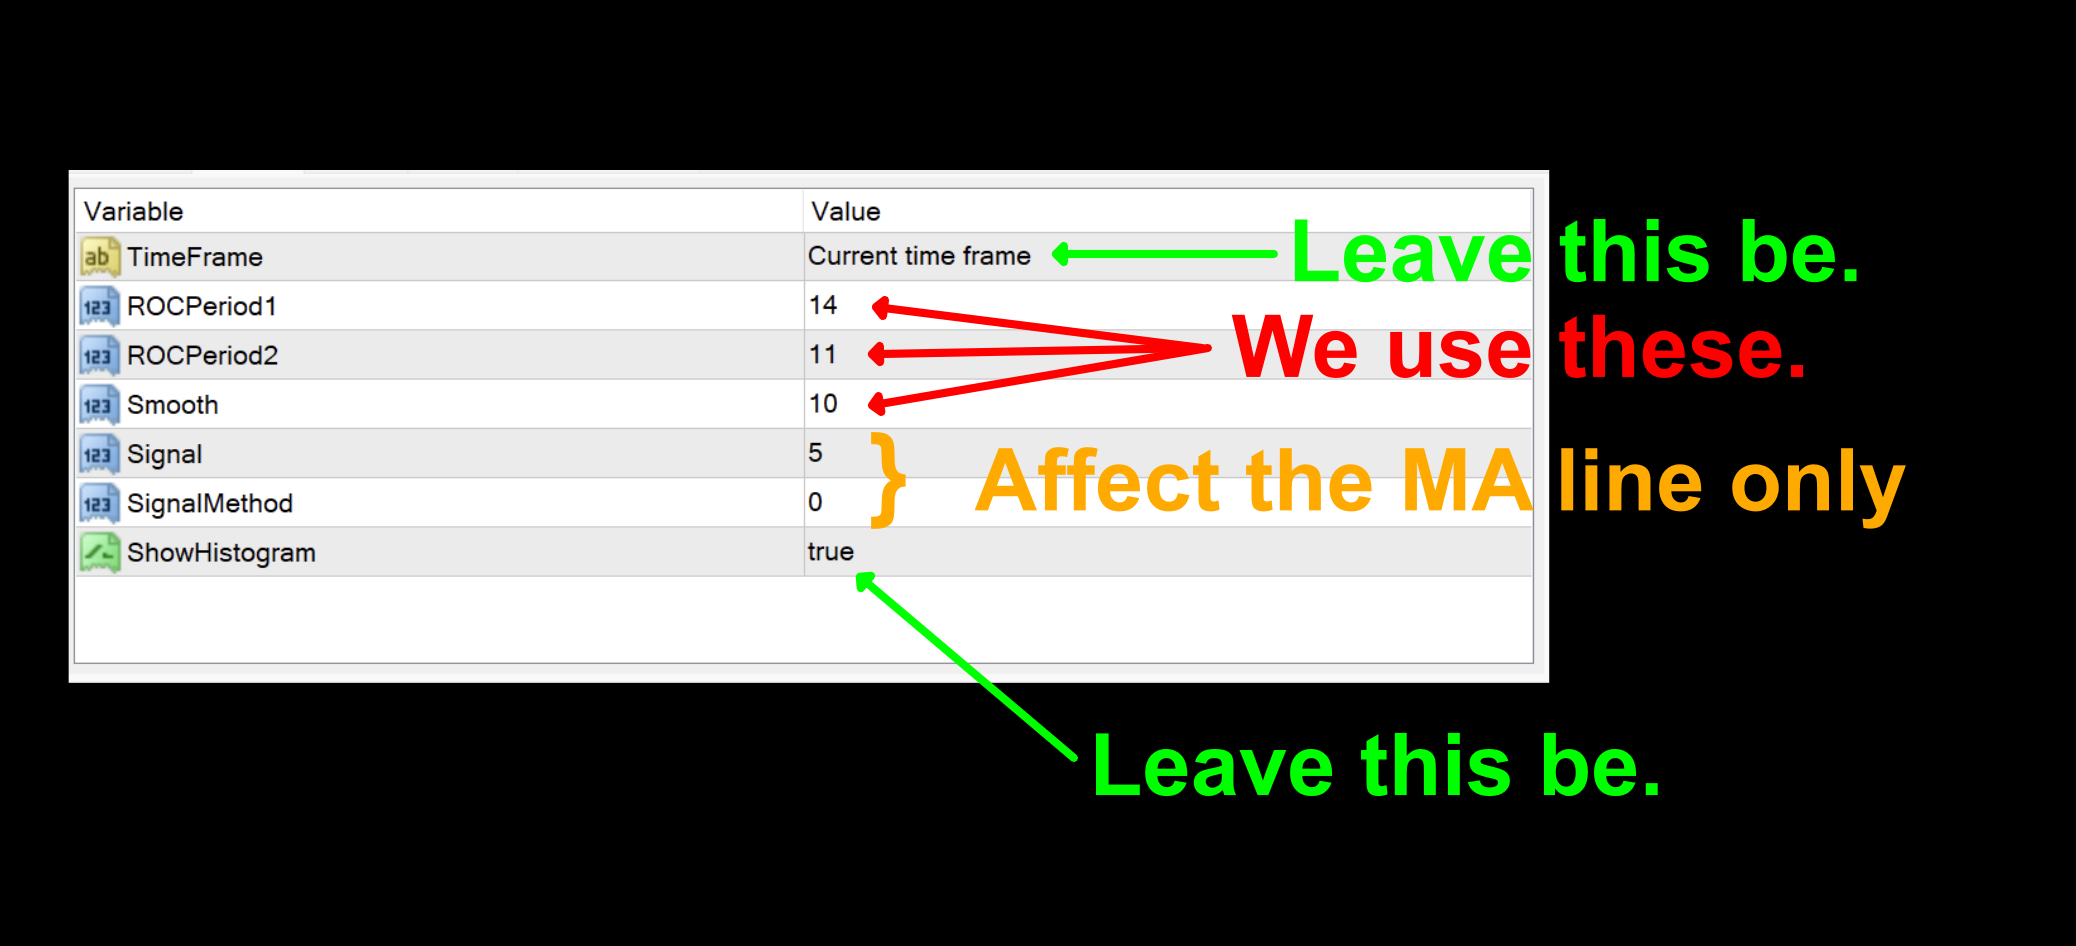
Settings
There are three settings we’re going to deal with. We’re also going to explain why the default settings are what they are.
ROCPeriod1: The Short ROC Period. The default setting is 14.
ROCPeriod2: The Long ROC Period. The default setting is 11.
Smooth: This is the WMA (weighted moving average) to help smooth things out. The default setting is 10 periods.
Caelum seu infernum
So why did Mr. Coppock use 11 and 14 periods for the short and long ROC? He was told by the Bishops from the Episcopalian Church that the average mourning period is 11 to 14 months. This was interpreted as the oscillator’s downtrend movement was akin to a mourning period. What a downer.
Advantages
* Clear signals using both above/below zero and color.
* Amplitude (height) of histogram from zero line is not considered, therefore no interpretation of momentum strength is necessary.
* Multiple settings provide room for adjustments, and hopefully some improvements to boot.
We’ll take a look at the signals on the default chart and see how Coppock Curve indicator presents in various market conditions.
How We Use It
Long signal – When the histogram crosses and closes above the zero line (blue). The entry occurs on the open of the next candle.
Short signal – When the histogram crosses and closes below the zero line (red). The entry occurs on the open of the next candle.
Testing…Testing…Testing…
Remember, comprehensive analysis is strongly suggested, and we advocate backwards and forward testing indicators or systems prior to trading actual funds. We propose conducting your tests on the following pairs.
EUR/USD
AUD/NZD
EUR/GBP
AUD/CAD
CHF/JPY
CAD/SGD
If it doesn’t work on these 6 pairs, chances are it won’t work on other pairs. This is not an absolute, but we’ve found this rule is reliable in most cases.
The markets we test our indicators are the:
EUR/USD (Euro/US Dollar)
BTC/USD (Bitcoin/US Dollar)
XAU/USD (Gold/US Dollar)
SPX500 (S&P500 Index)
Timeframes and Results
In our initial test, we’ll run the Coppock Curve indicator on the EUR/USD, BTC/USD, XAU/USD, and the SPX500 using the default settings across the daily and 4-hour timeframes on the MT4 strategy tester. We use the fast method of testing the indicator to get a general idea; however, you may also run the tick-by-tick data set for a more precise result (which takes considerably more time).
As No Nonsense Traders – and therefore Swing Traders, we will not examine shorter time frames in these studies. We will also run an additional test, using different values for the settings, to analyze which one may work better and examine the following results:
Total trades
Win/Loss ratio
ROI (return on investment)
There are other metrics included in the strategy tester report, which can be compared, but these three metrics provide the necessary gauge to make quick decisions as to the usefulness of a particular indicator and its settings.
Next, for comparison, we’ll explore the following;
Daily – 1 year
4-hour – 3 months
The reason exceptionally long (or short) testing periods are not included is due to changing market conditions, which might return irrelevant information. A balance of statistically significant data is necessary for accurate results.
And the Outcome…
Below are the spreadsheets illustrating the results from our tests.
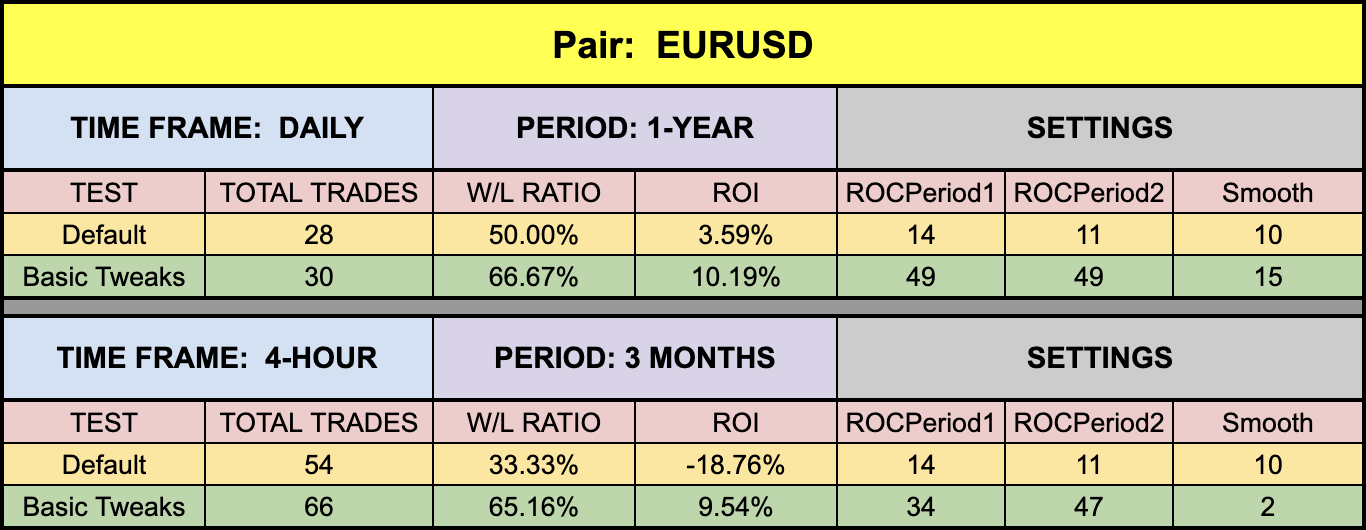
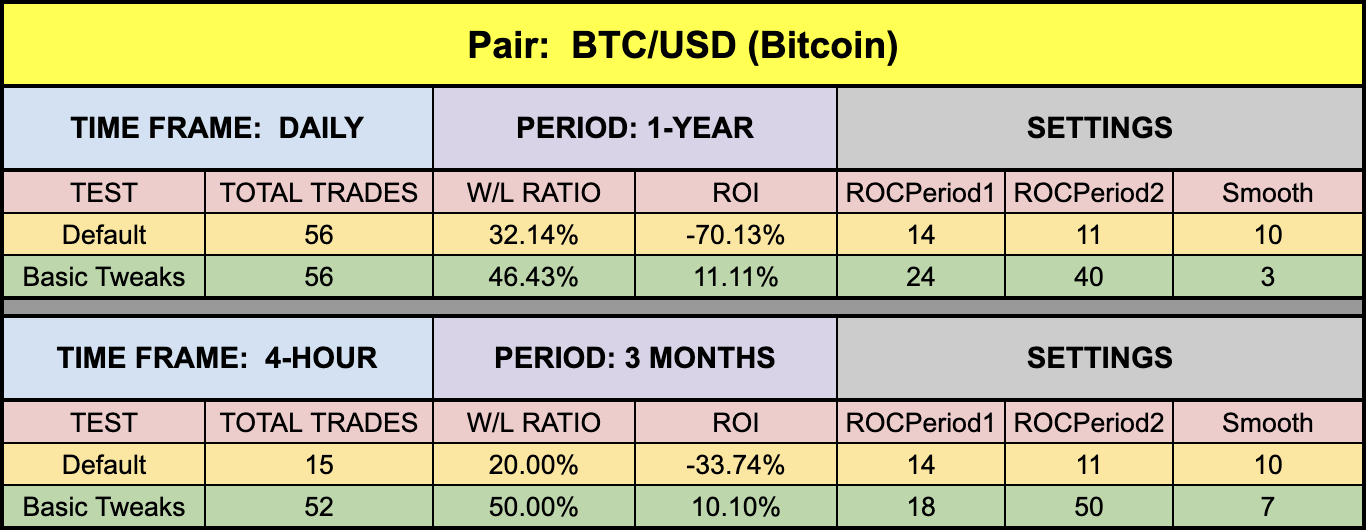
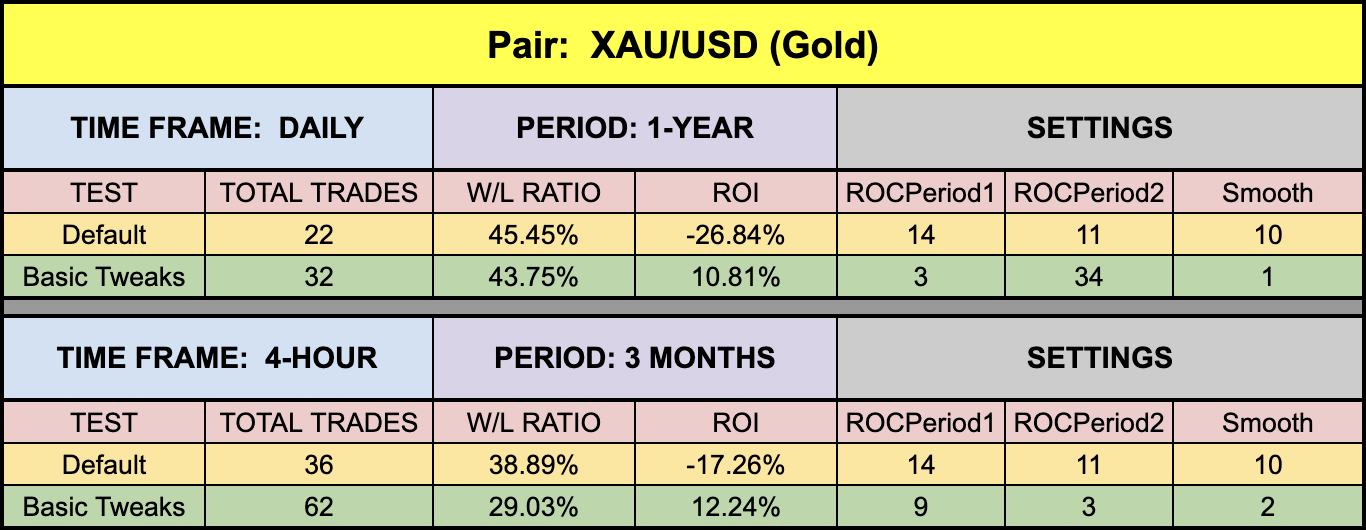
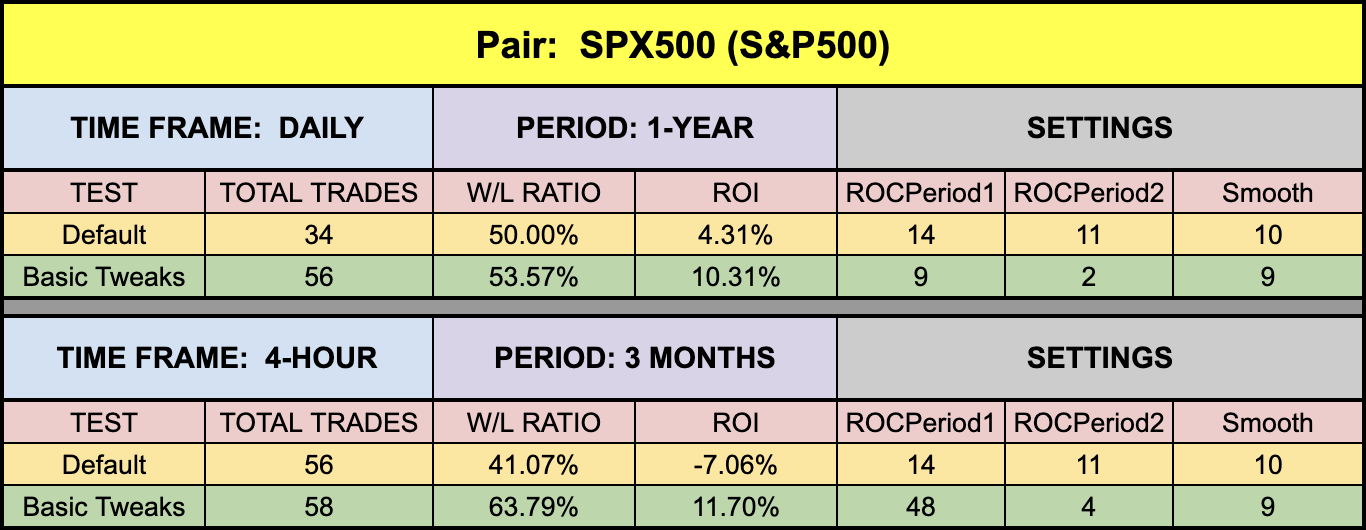
The green highlighted rows represent “basic tweaks” on the settings which returned better results. Are these the best? Not necessarily. Given that variables including testing date range and broker data are different from person to person, you may find better settings.
Trust In Yourself
Remember, the overall NNFX philosophy of taking profit, risk, and drawdown is that YOU are creating a system which YOU will be trading. Don’t let anybody else take that away from you. Part of the learning process is digging in and doing the work yourself. To learn more about these topics, check out the Advanced Course!
That being said, the results we post in these blogs should never be considered specific trading advice.
***Note: Remember, never use just this one indicator as your decision of whether to open or close a trade. It should be part of a system.
Money Management
If you are curious as to what money management is used on our tests; we have a certain way of determining wins and losses, which can be found in the Advanced Course. Our goal here is to determine how well the indicator reacts to price with respect to producing a long or short signal. Your system, with its risk profile, will dictate individual returns.
Resources
As we did with past indicator studies, we’ve made the Coppock Curve is available for download on our site from the indicator library. We will keep adding better indicators with each study for your use, at no charge. When you’re ready to get it, click HERE.
More to Come
There’s a lot more to come. We are excited to provide more trading tips in the near future. Sign up on our contacts page or subscribe to our YouTube channel. Receive early notifications as we continue to publish helpful, relevant, and informative Forex related material to support your quest to become a better trader.
And, now you are aware of another indicator that many traders don’t know or use.
Our only goal is to make you a better trader.
BTW – Any information communicated by Stonehill Forex Limited is solely for educational purposes. The information contained within the courses and on the website neither constitutes investment advice nor a general recommendation on investments. It is not intended to be and should not be interpreted as investment advice or a general recommendation on investment. Any person who places trades, orders or makes other types of trades and investments etc. is responsible for their own investment decisions and does so at their own risk. It is recommended that any person taking investment decisions consults with an independent financial advisor. Stonehill Forex Limited training courses and blogs are for educational purposes only, not a financial advisory service, and does not give financial advice or make general recommendations on investment.