Smoothie, Anybody?
As we did in our previous blog, we found a newer version of something that was a solid favorite with the trading community, and just maybe this version is better. The cool thing is that the original version of this one is also found as part of the “boxed set” of a freshly downloaded and installed version of MT4. Read on, friends…
Great Response
The video short we created of the indicator and inserted in last week’s blog was well received, so we’ve decided to make it a “thing” going forward. We appreciate the feedback. Remember, you can email us at stonehillindicator@gmail.com if you have suggestions, comments, or questions.
Cool Cat
In the 1950s, this bee’s knees of an indicator was developed by George Lane. Its name was the stochastic oscillator and is calculated by taking the closing price of a single period in relation to the high and low prices of that period over a span of time, typically 14 periods.
Back to the Future
We’re going to fast-forward a few decades where an amazing woman named Cynthia Kase, a world leader in technical analysis, technical market forecasting, and financial market software development founded Kase and Company, Inc., in 1992. She took this indicator and improved on it, where it was analyzed and explained in an article written by the Aspen Research Group in 2002 for further development. The first instance we can find where it was coded for MT4 was in 2010.
False Positives Prevented
The best explanation we could find was that this version is built on the basis of combining the last five bars into one, which in effect creates an effect that is five times larger, but displayed on the current time frame chart. This effect is one which is supposedly less prone to false positives; something we as traders can relate to and appreciate.
A Little Bit of This and That
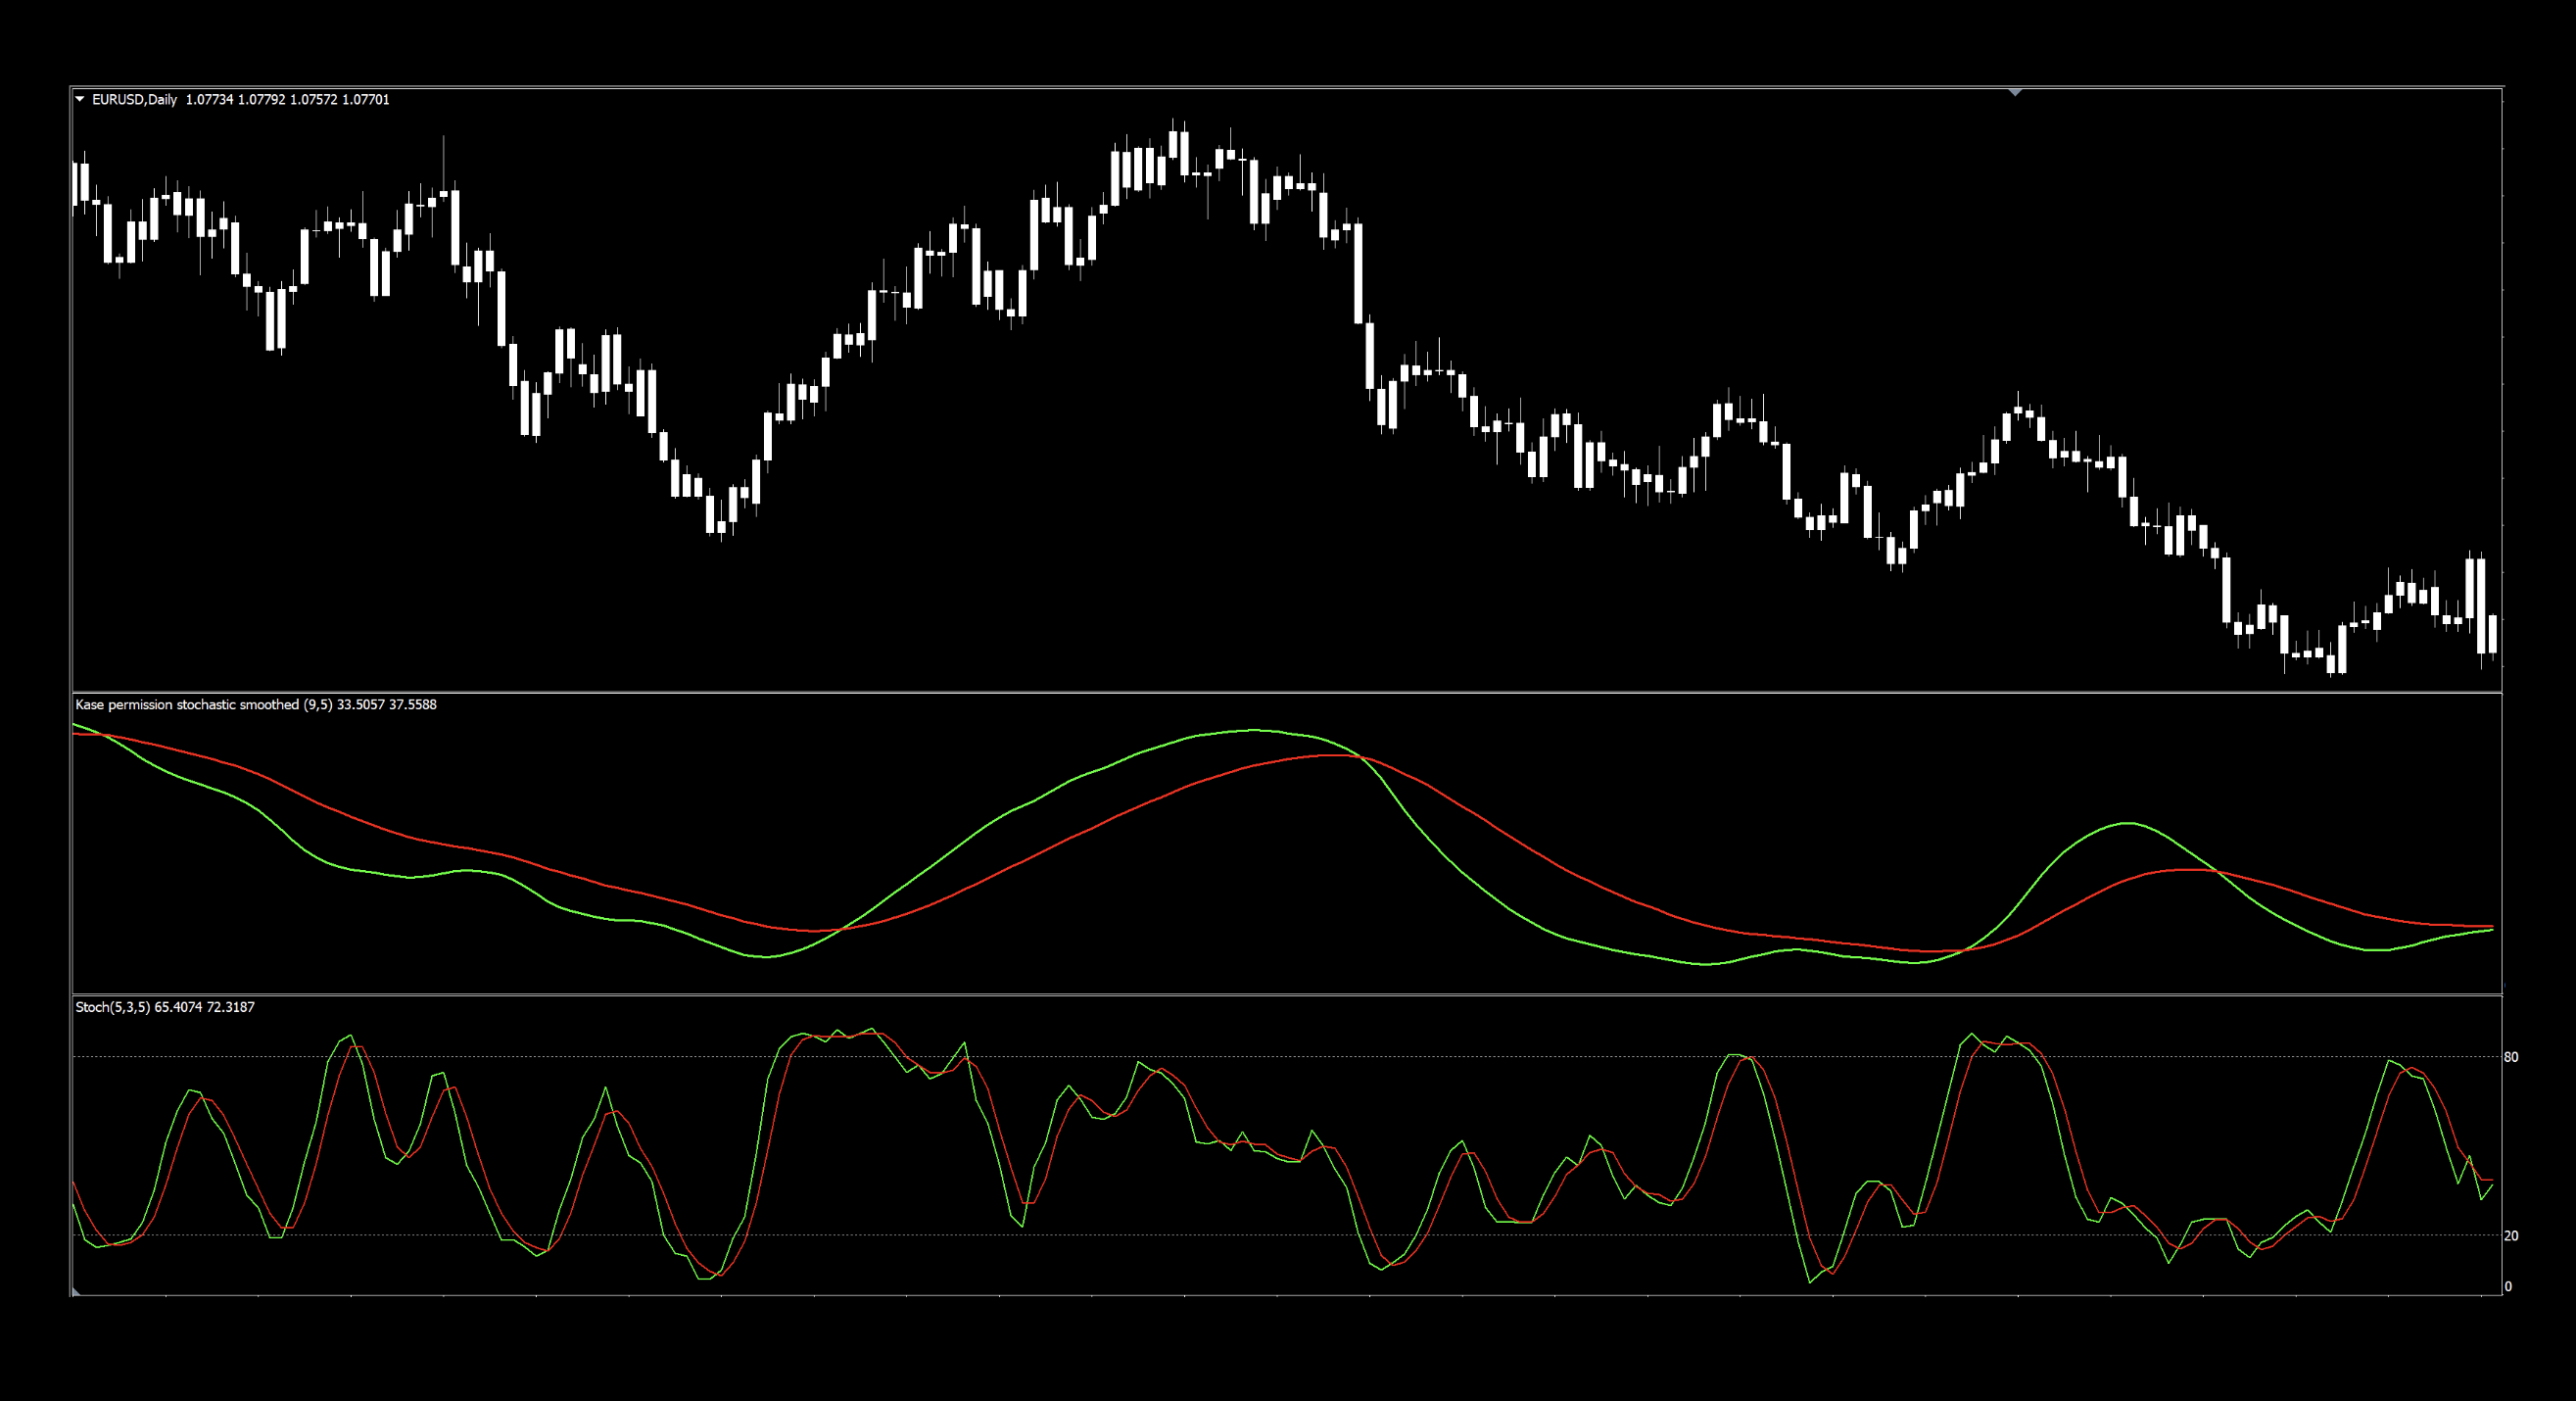
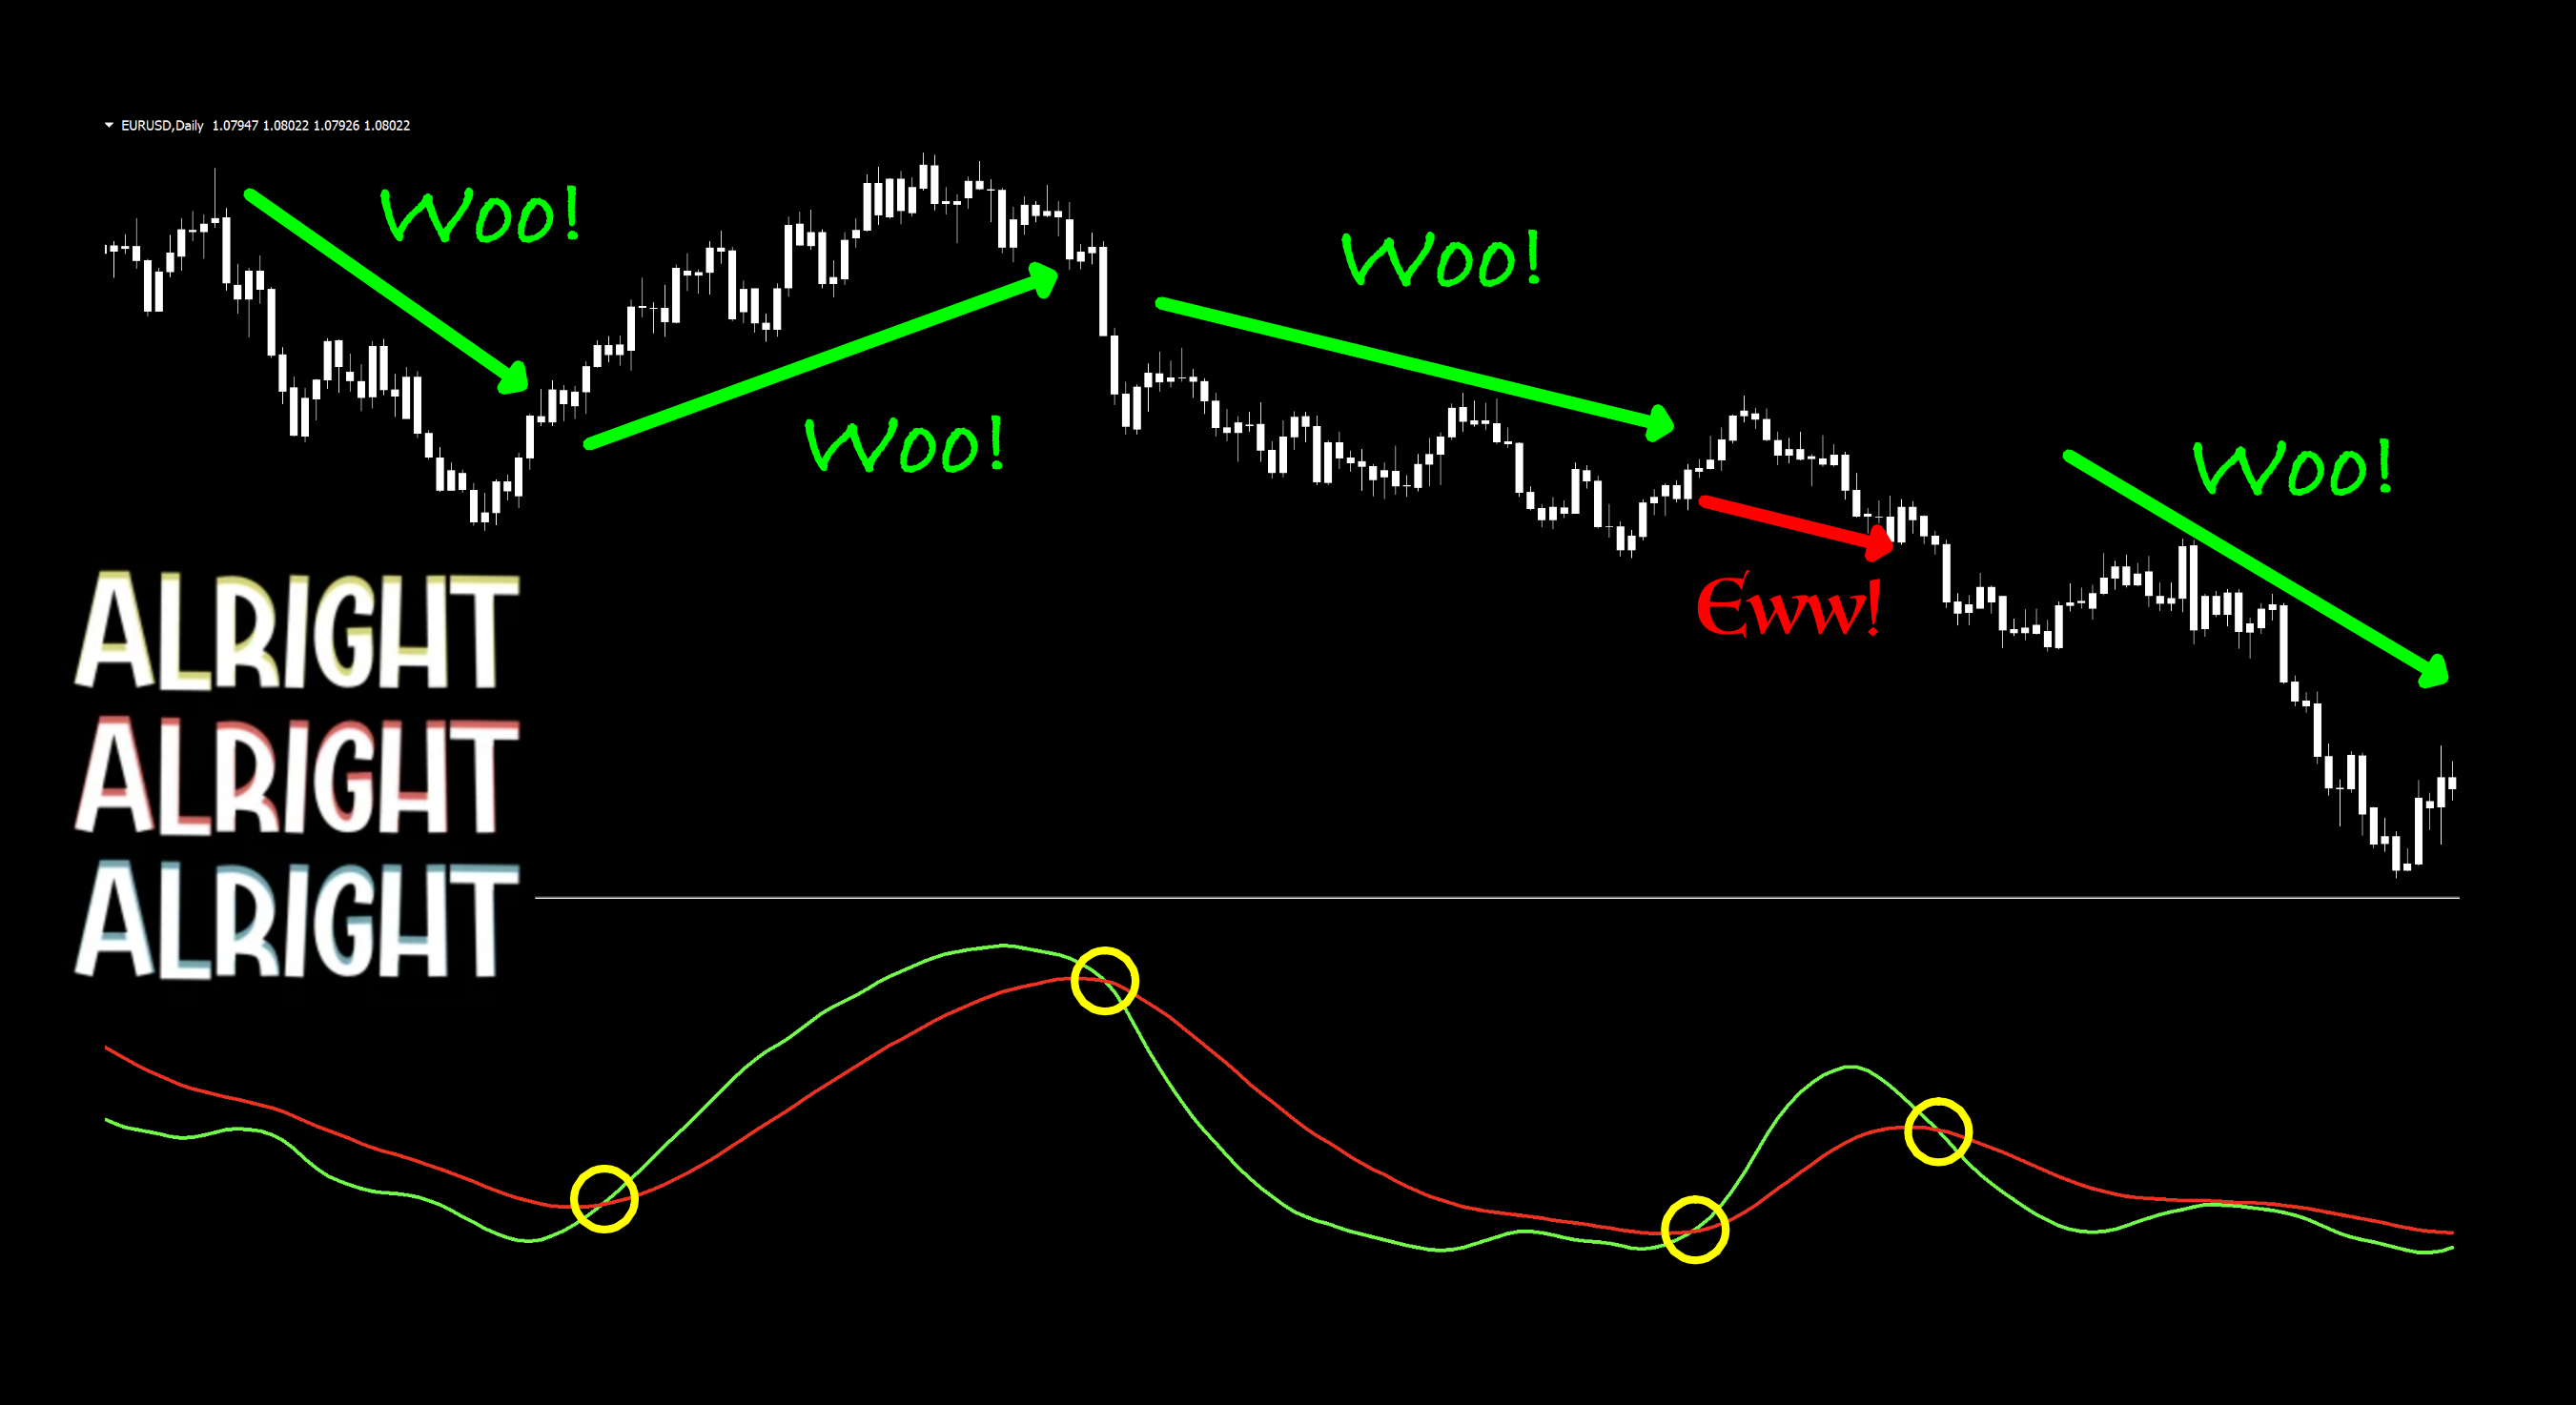
Below is a screenshot of what the original Stochastic (bottom) and the smoothed version (top) look like on the default settings. They definitely do not look alike. We’ll color the candles white so as not to bias ourselves to past history and focus our attention on the magic below the price.
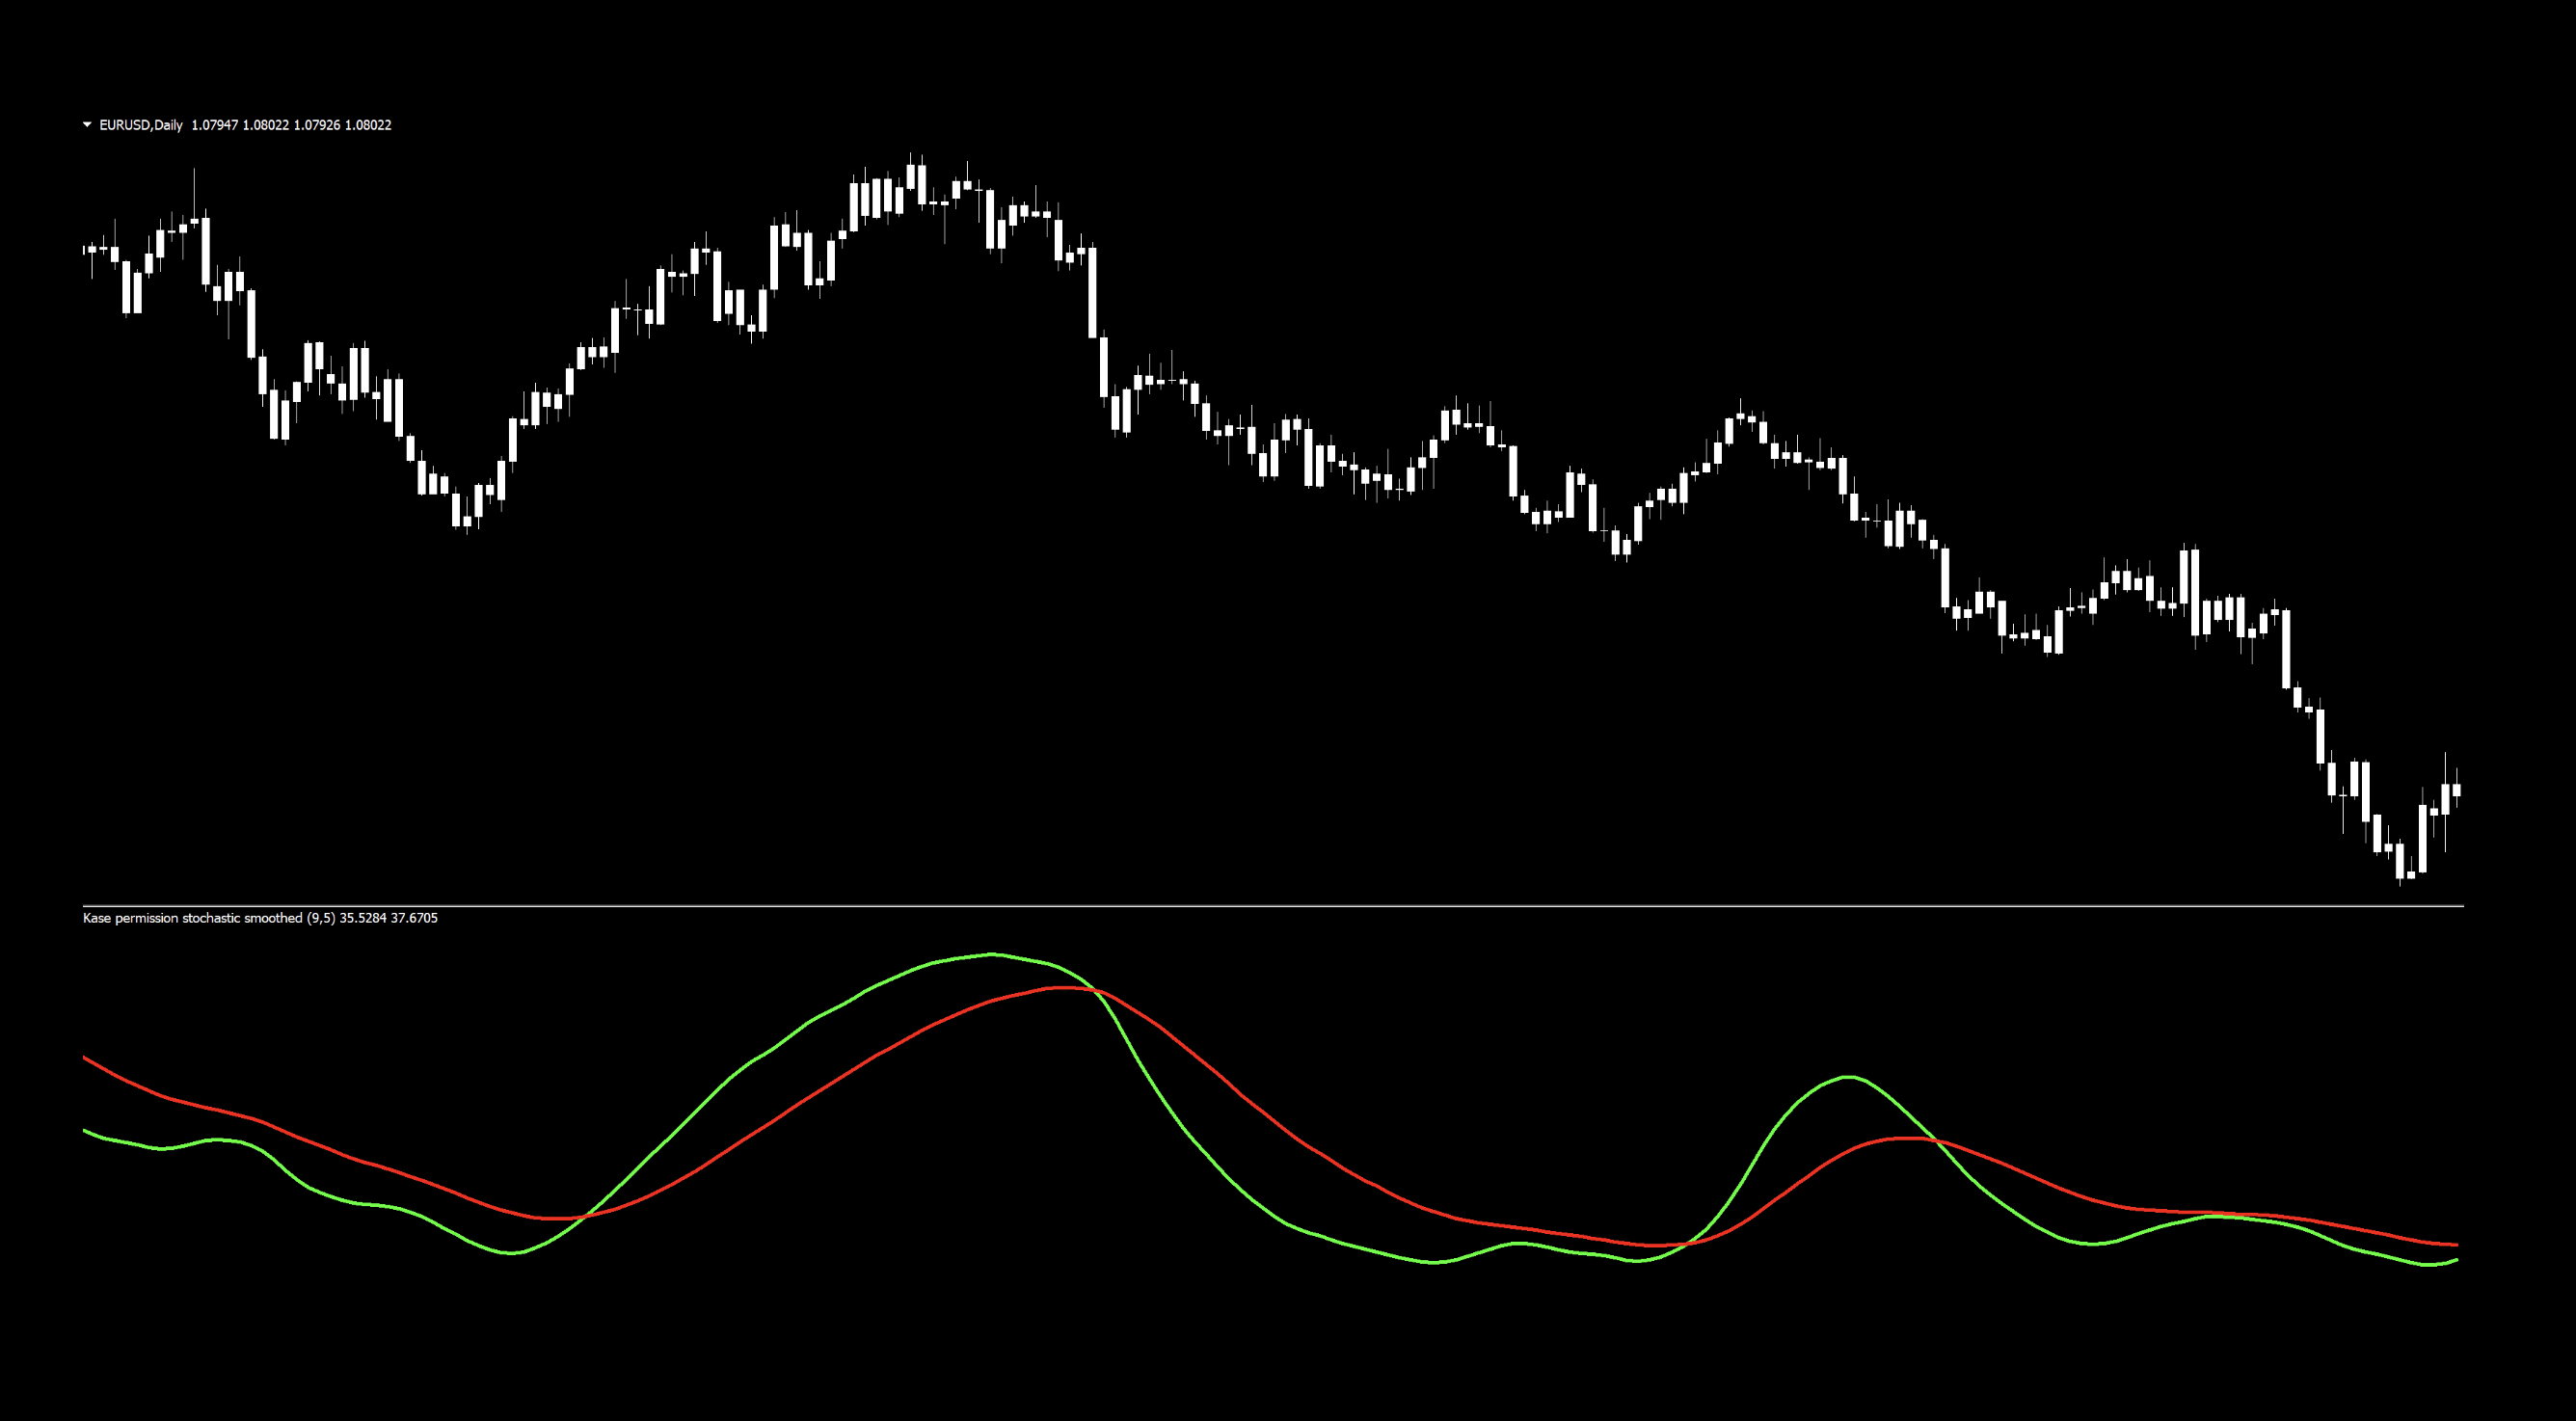
Here’s a better picture of the indicator by itself with price.
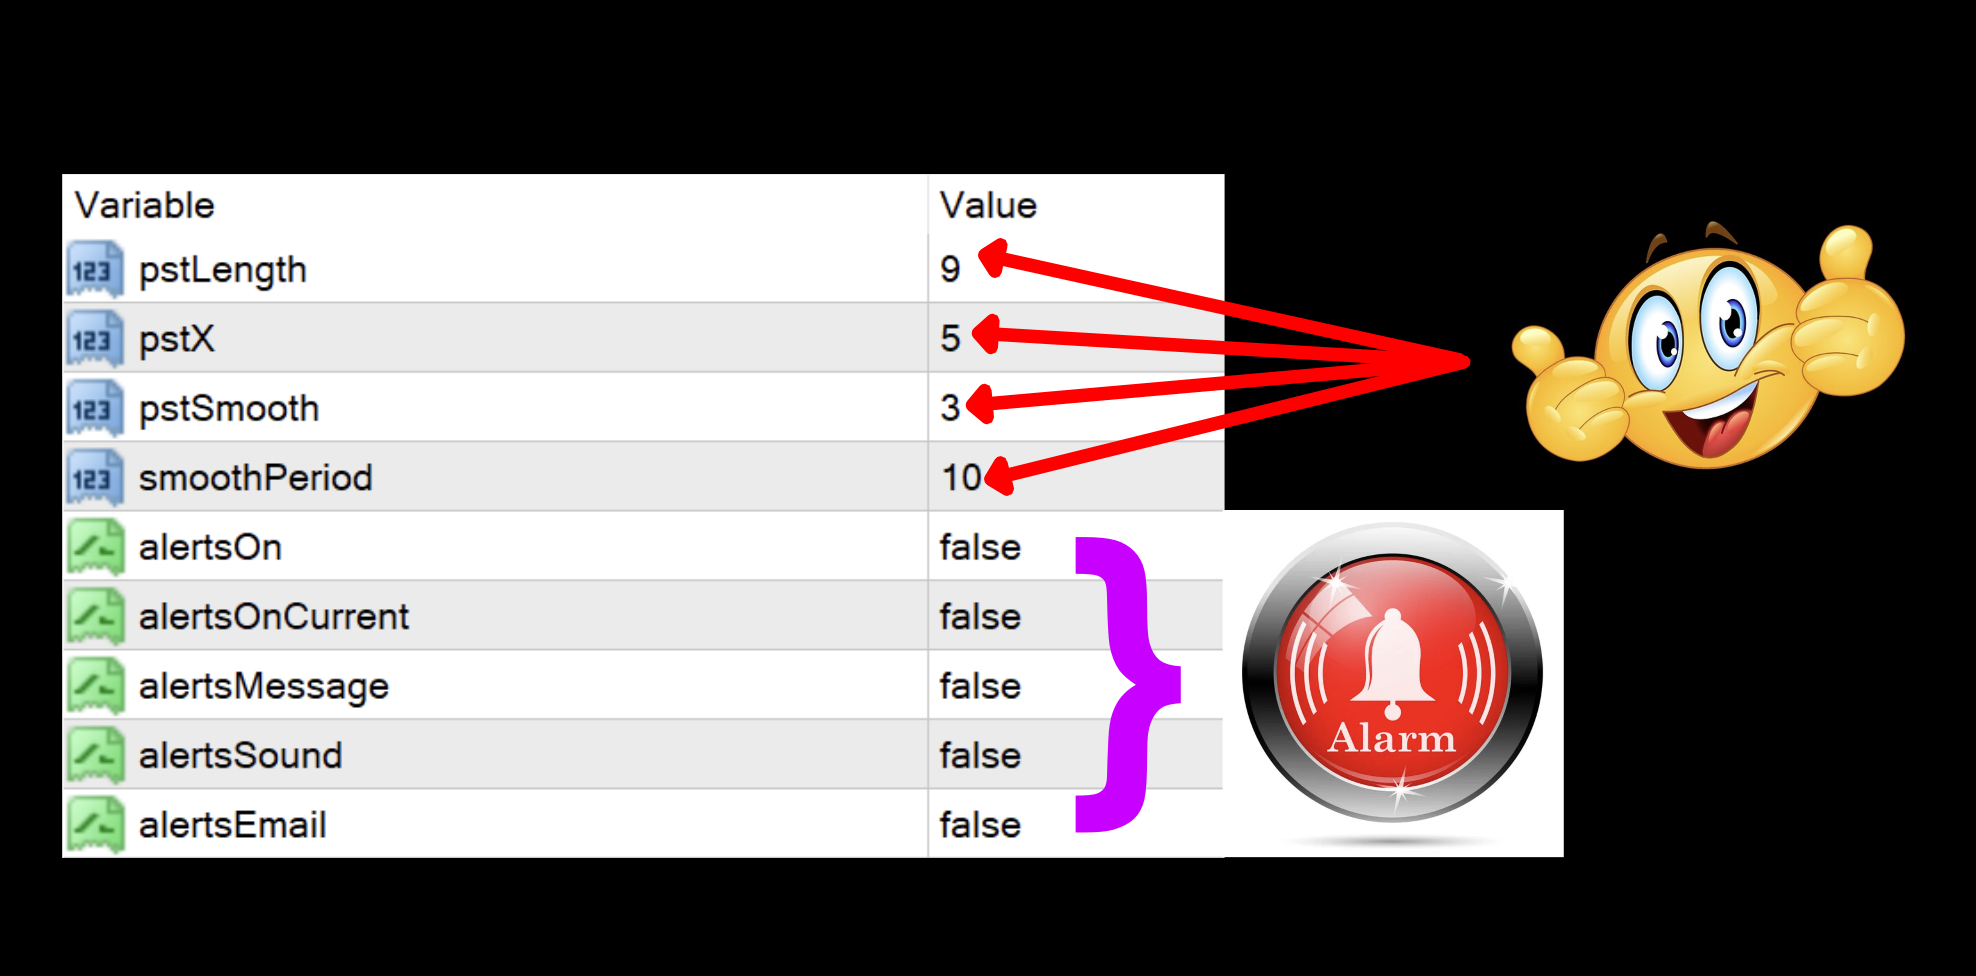
 The smoothed version has four variables in the setting menu among others which deal with various alerts, which can be toggled true/false to your heart’s desire.
Before we get into the settings, let’s watch a short video and see how this indicator reacts with price.
Settings
There are four settings we’ll use in this indicator, so testing should give you a good degree of flexibility when tweaking it for your algorithm.
pstLength: This is the stochastic calculation length. The default setting is 9.
pstX: The displacement in bars used to calculate stochastic values. The default setting is 5.
pstSmooth: The smooth coefficient used to EMA smooth the resulting stochastic signal lines. The default setting is 3.
smoothPeriod: The number of periods used to calculate the overall smoothing. The default setting is 10.
Advantages
* Takes a powerhouse indicator from seven decades ago and makes it easier to use.
* More control over signal generation.
* Built in alarms to give you various forms of notification.
* Might make a decent exit indicator.
We’ll take a look at the signals on the default chart and see what the new, smoother version offers.
How We Use It
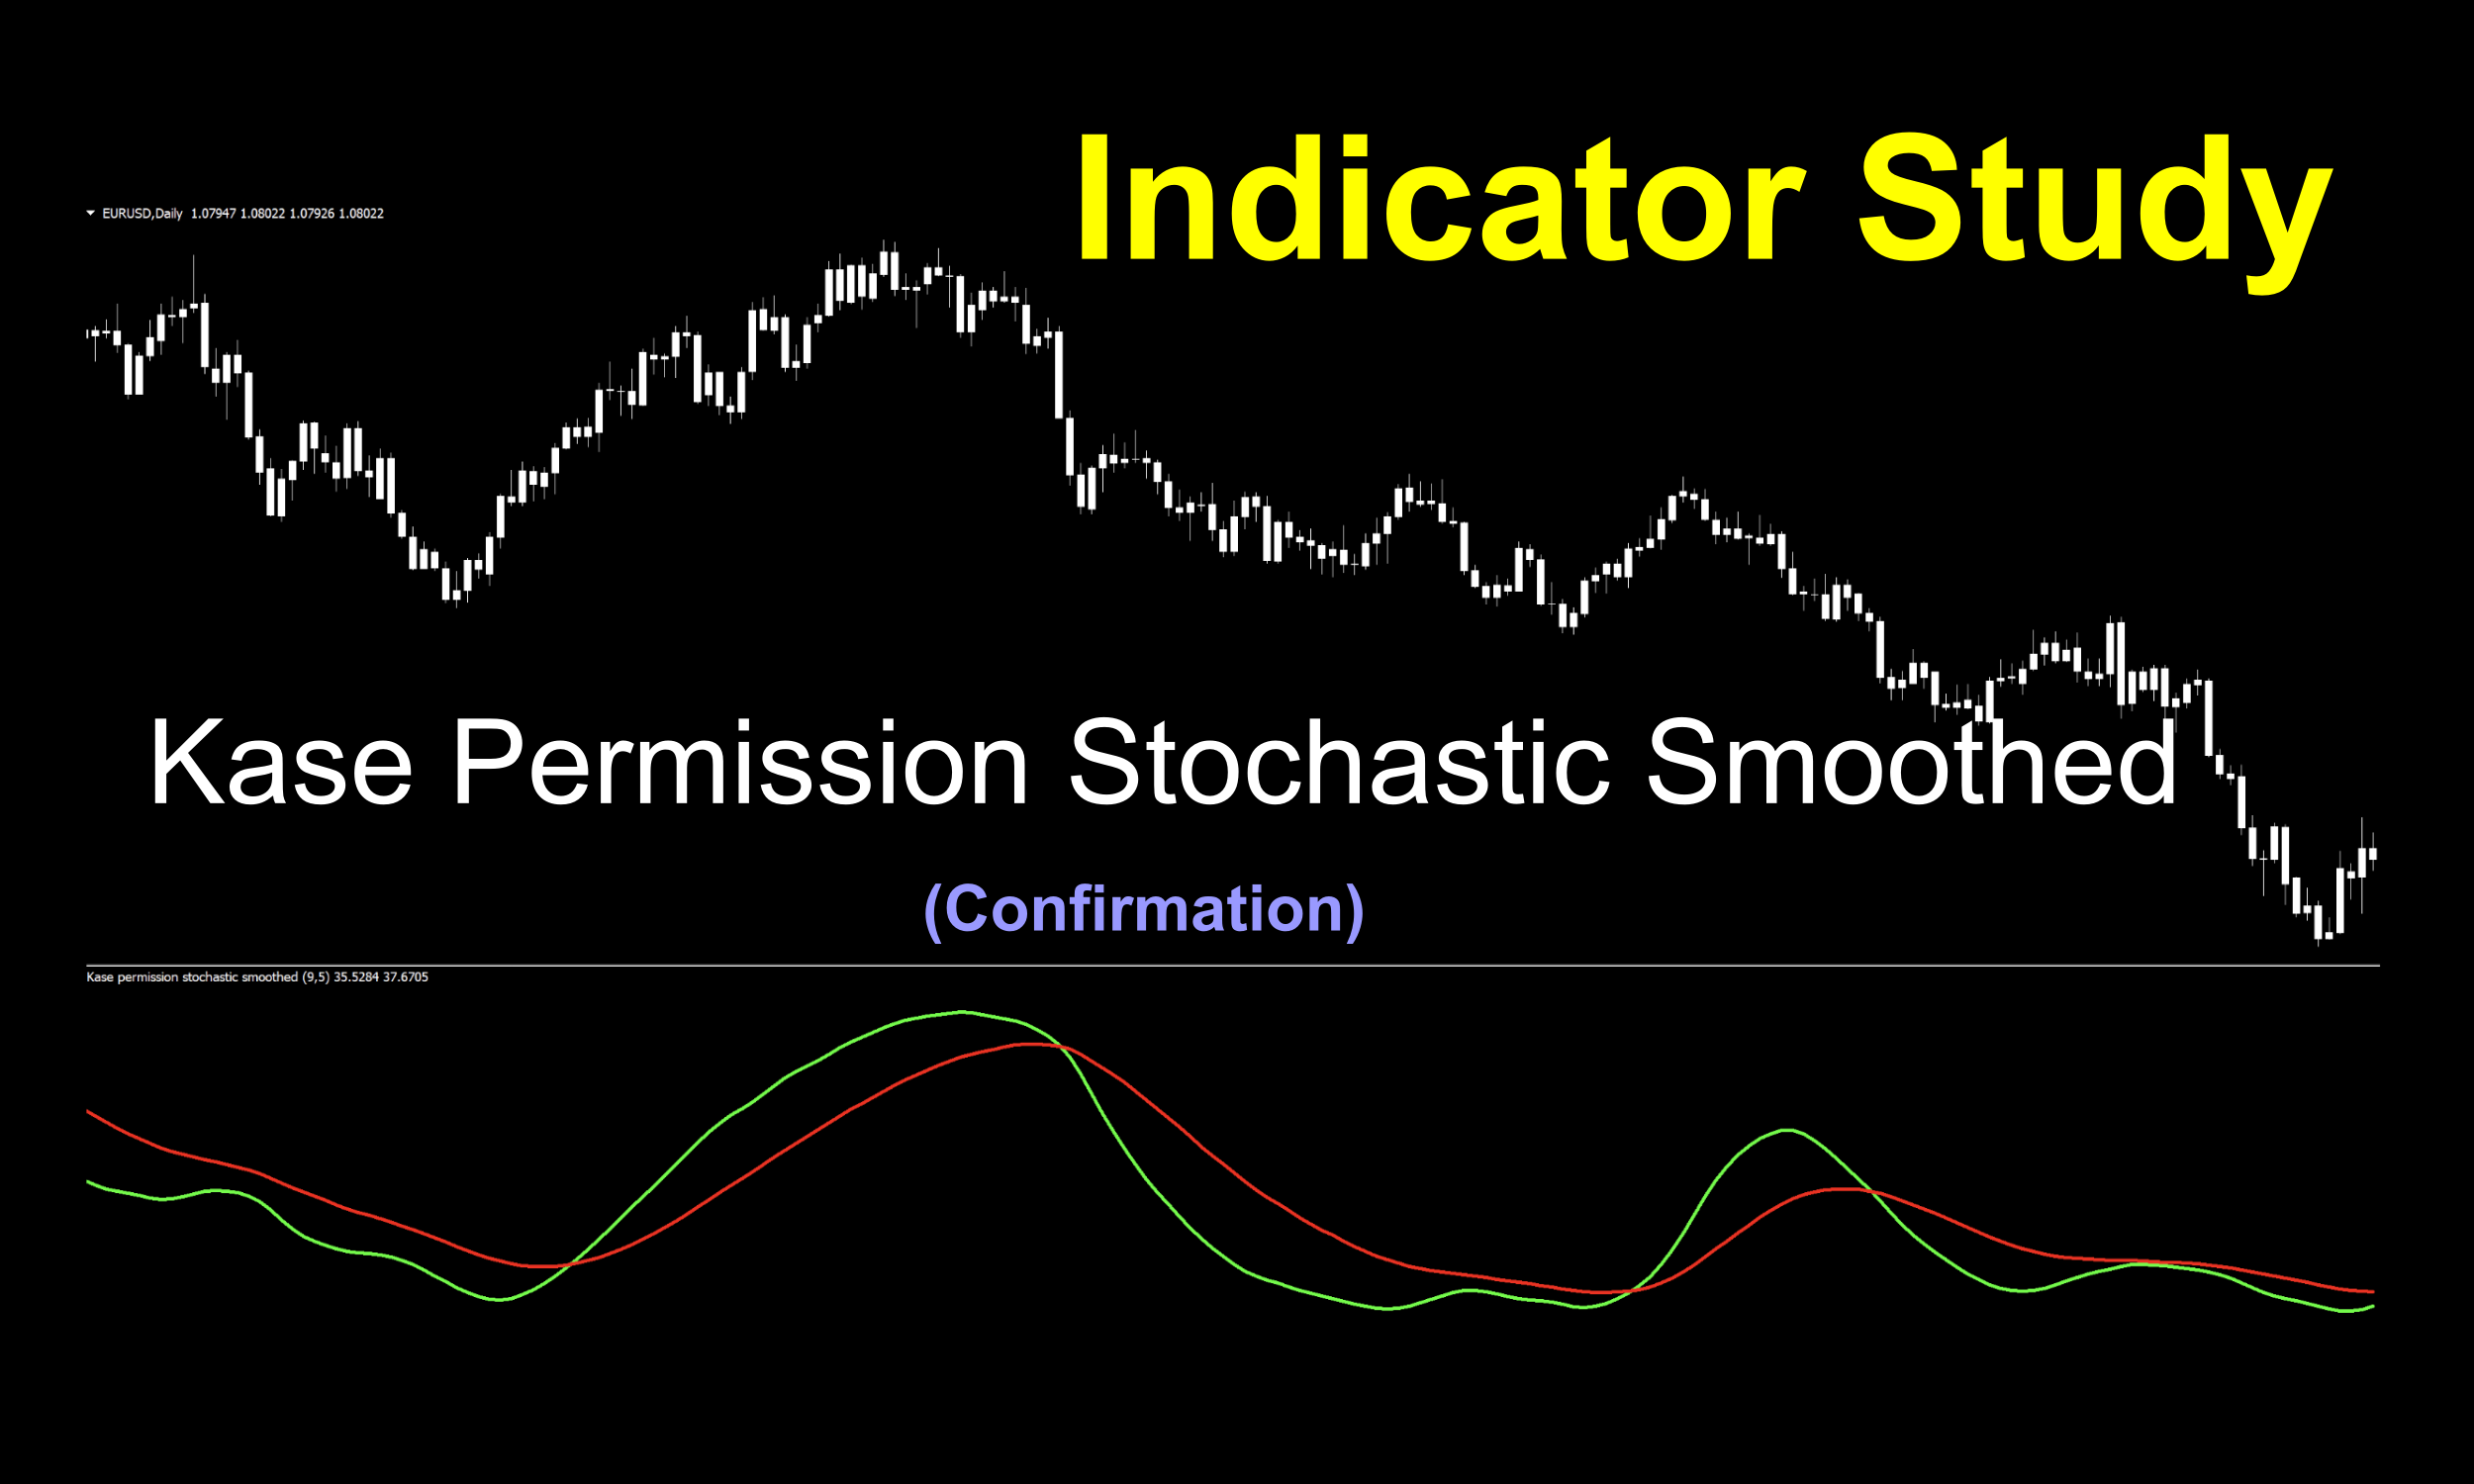
This confirmation indicator is pretty straight forward. A two line crossover, below chart, friend of the family.
Long signal – When the green line crosses and closes above the red line. The entry occurs on the open of the next candle.
Short signal – When the red line crosses and closes above the green line. The entry occurs on the open of the next candle.
Pay Your Dues
We acknowledge that the historic use of the classic indicator leaned more towards reversal, rather than trending. That being said, the use of overbought/oversold levels were in place to alert the user that a possible price reversal may be on the horizon.
Furthermore…
We, as trend, and strictly technical traders don’t subscribe to that notion and therefore don’t bother with those levels. You could use the indicator as a zero cross as well, picking one or the other signal lines to create a means for generating trade signals; but for our purposes, we’re going to compare apples to apples and consider it a two lines crossover, as the smoothed version presents quite nicely that way.
Testing…Testing…Testing…
Remember, comprehensive analysis is strongly suggested, and we advocate backwards and forward testing indicators or systems prior to trading actual funds. We propose conducting your tests on the following pairs.
EUR/USD
AUD/NZD
EUR/GBP
AUD/CAD
CHF/JPY
CAD/SGD
If it doesn’t work on these 6 pairs, chances are it won’t work on other pairs. This is not an absolute, but we’ve found this rule is reliable in most cases.
The markets we test our indicators are the:
EUR/USD (Euro/US Dollar)
BTC/USD (Bitcoin/US Dollar)
XAU/USD (Gold/US Dollar)
SPX500 (S&P500 Index)
Timeframes and Results
In our initial test, we’ll run the Kase Permission Stochastic Smoothed indicator on the EUR/USD, BTC/USD, XAU/USD, and the SPX500 using the default settings across the daily and 4-hour timeframes on the MT4 strategy tester. We use the fast method of testing the indicator to get a general idea; however, you may also run the tick-by-tick data set for a more precise result (which takes considerably more time).
As No Nonsense Traders – and therefore Swing Traders, we will not examine shorter time frames in these studies. We will also run an additional test, using different values for the settings, to analyze which one may work better and examine the following results:
Total trades
Win/Loss ratio
ROI (return on investment)
There are other metrics included in the strategy tester report, which can be compared, but these three metrics provide the necessary gauge to make quick decisions as to the usefulness of a particular indicator and its settings.
Next, for comparison, we’ll explore the following;
Daily – 1 year
4-hour – 3 months
The reason exceptionally long (or short) testing periods are not included is due to changing market conditions, which might return irrelevant information. A balance of statistically significant data is necessary for accurate results.
And the Outcome…
Below are the spreadsheets illustrating the results from our tests.
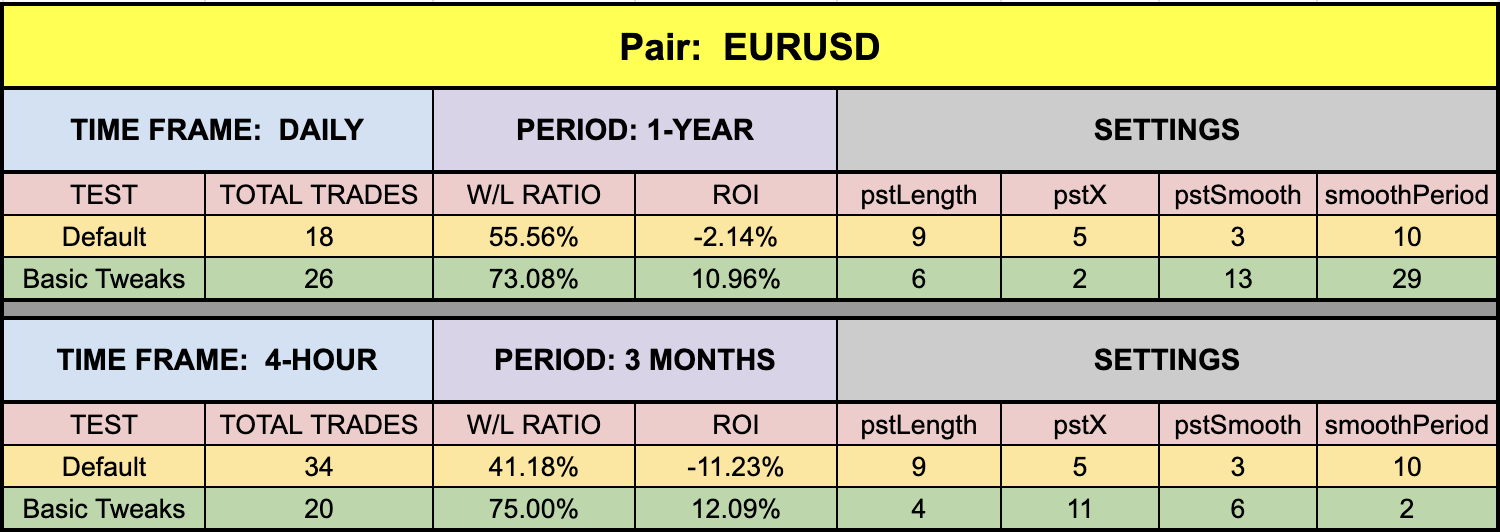
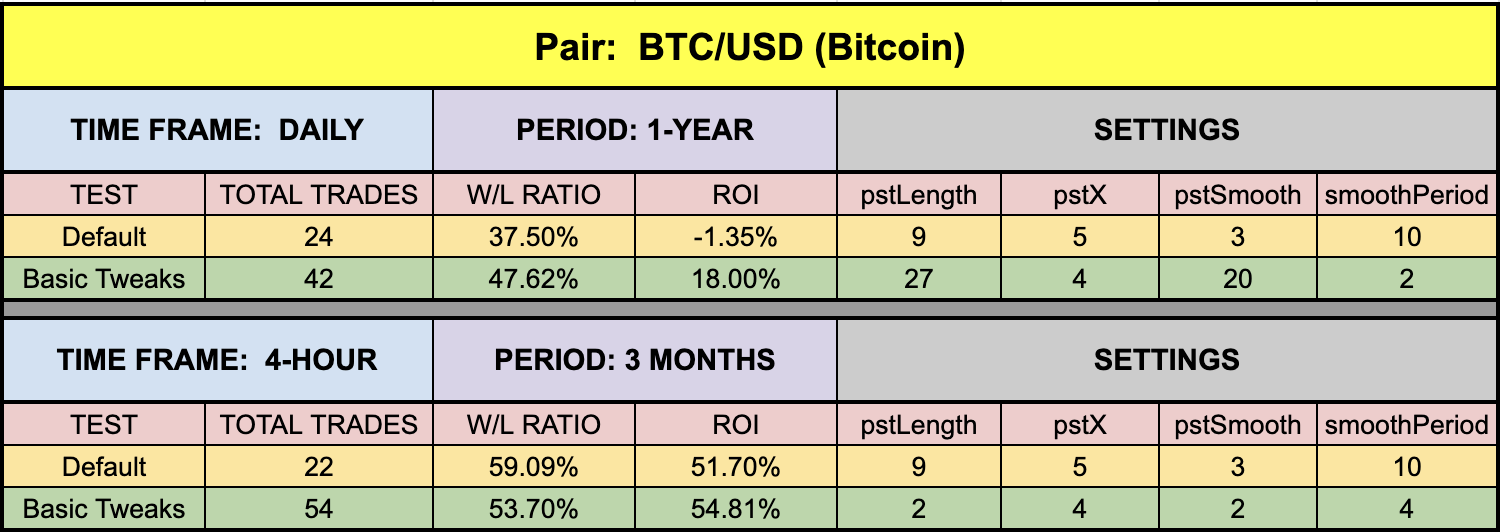
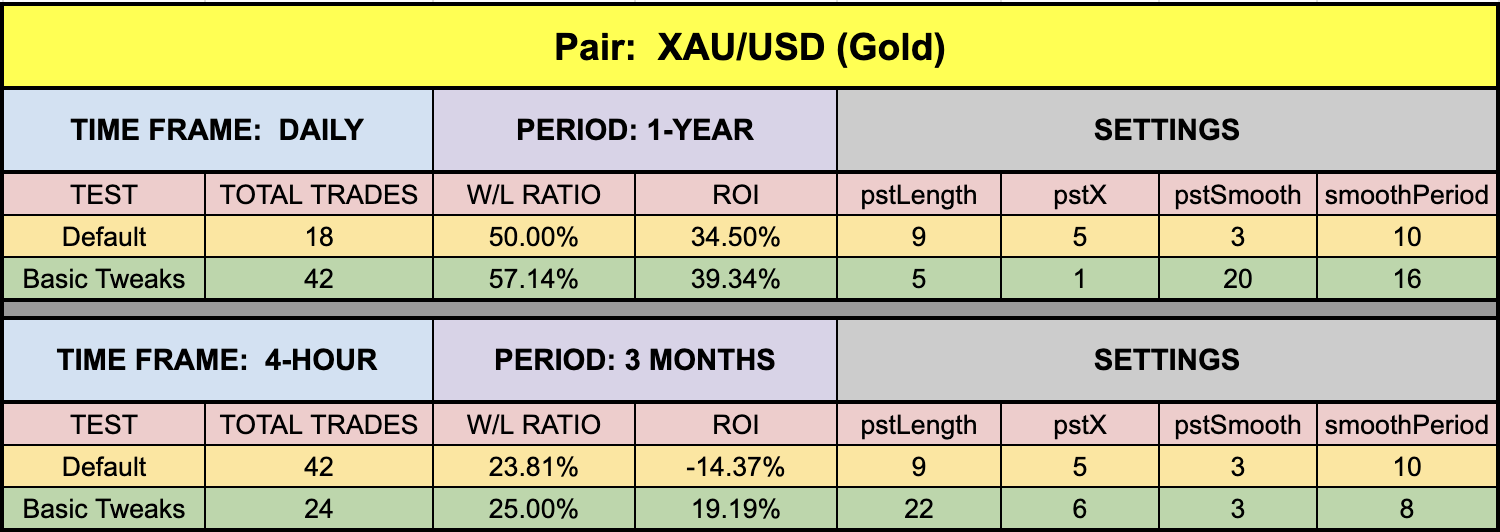
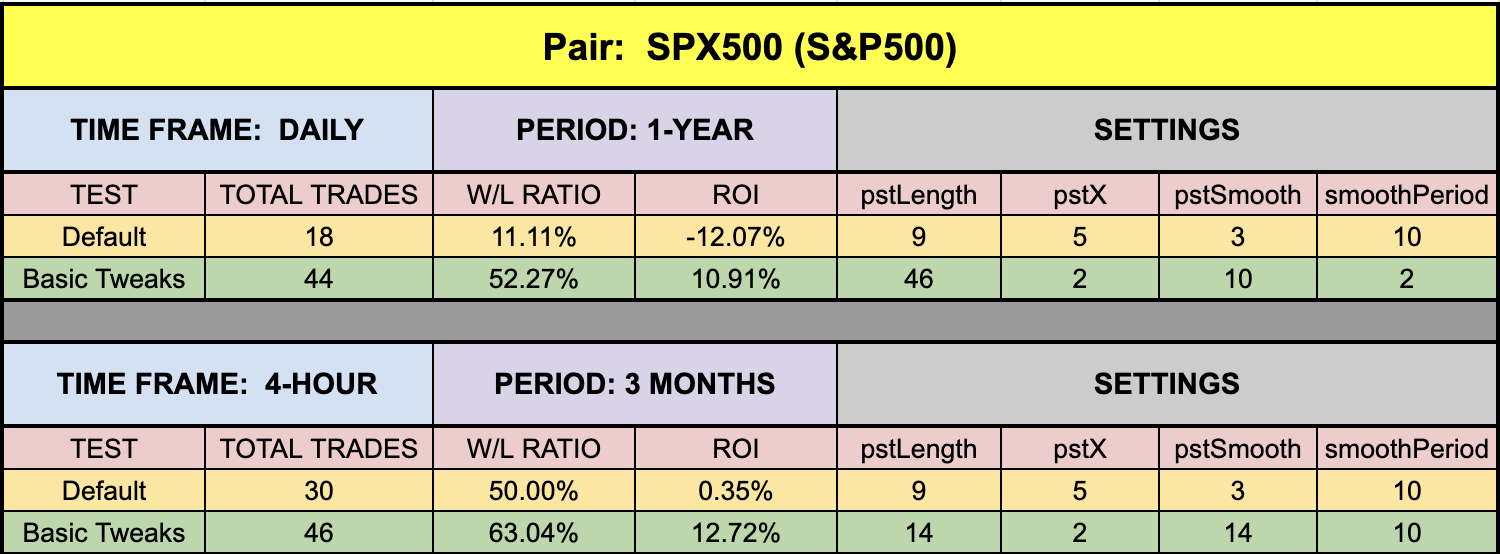
The green highlighted rows represent “basic tweaks” on the settings which returned better results. Are these the best? Not necessarily. Given that variables including testing date range and broker data are different from person to person, you may find better settings.
Trust In Yourself
Remember, the overall NNFX philosophy of taking profit, risk, and drawdown is that YOU are creating a system which YOU will be trading. Don’t let anybody else take that away from you. Part of the learning process is digging in and doing the work yourself. To learn more about these topics, check out the Advanced Course!
That being said, the results we post in these blogs should never be considered specific trading advice.
***Note: Remember, never use just this one indicator as your decision of whether to open or close a trade. It should be part of a system.
Money Management
If you are curious as to what money management is used on our tests; we have a certain way of determining wins and losses, which can be found in the Advanced Course. Our goal here is to determine how well the indicator reacts to price with respect to producing a long or short signal. Your system, with its risk profile, will dictate individual returns.
Resources
As we did with past indicator studies, we’ve made the Kase Permission Stochastic Smoothed is available for download on our site from the indicator library. We will keep adding better indicators with each study for your use, at no charge. When you’re ready to get it, click HERE.
More to Come
There’s a lot more to come. We are excited to provide more trading tips in the near future. Sign up on our contacts page or subscribe to our YouTube channel. Receive early notifications as we continue to publish helpful, relevant, and informative Forex related material to support your quest to become a better trader.
And, now you are aware of another indicator that many traders don’t know or use.
Our only goal is to make you a better trader.
BTW – Any information communicated by Stonehill Forex Limited is solely for educational purposes. The information contained within the courses and on the website neither constitutes investment advice nor a general recommendation on investments. It is not intended to be and should not be interpreted as investment advice or a general recommendation on investment. Any person who places trades, orders or makes other types of trades and investments etc. is responsible for their own investment decisions and does so at their own risk. It is recommended that any person taking investment decisions consults with an independent financial advisor. Stonehill Forex Limited training courses and blogs are for educational purposes only, not a financial advisory service, and does not give financial advice or make general recommendations on investment.