Geometric Mean Moving Average as a Baseline Indicator
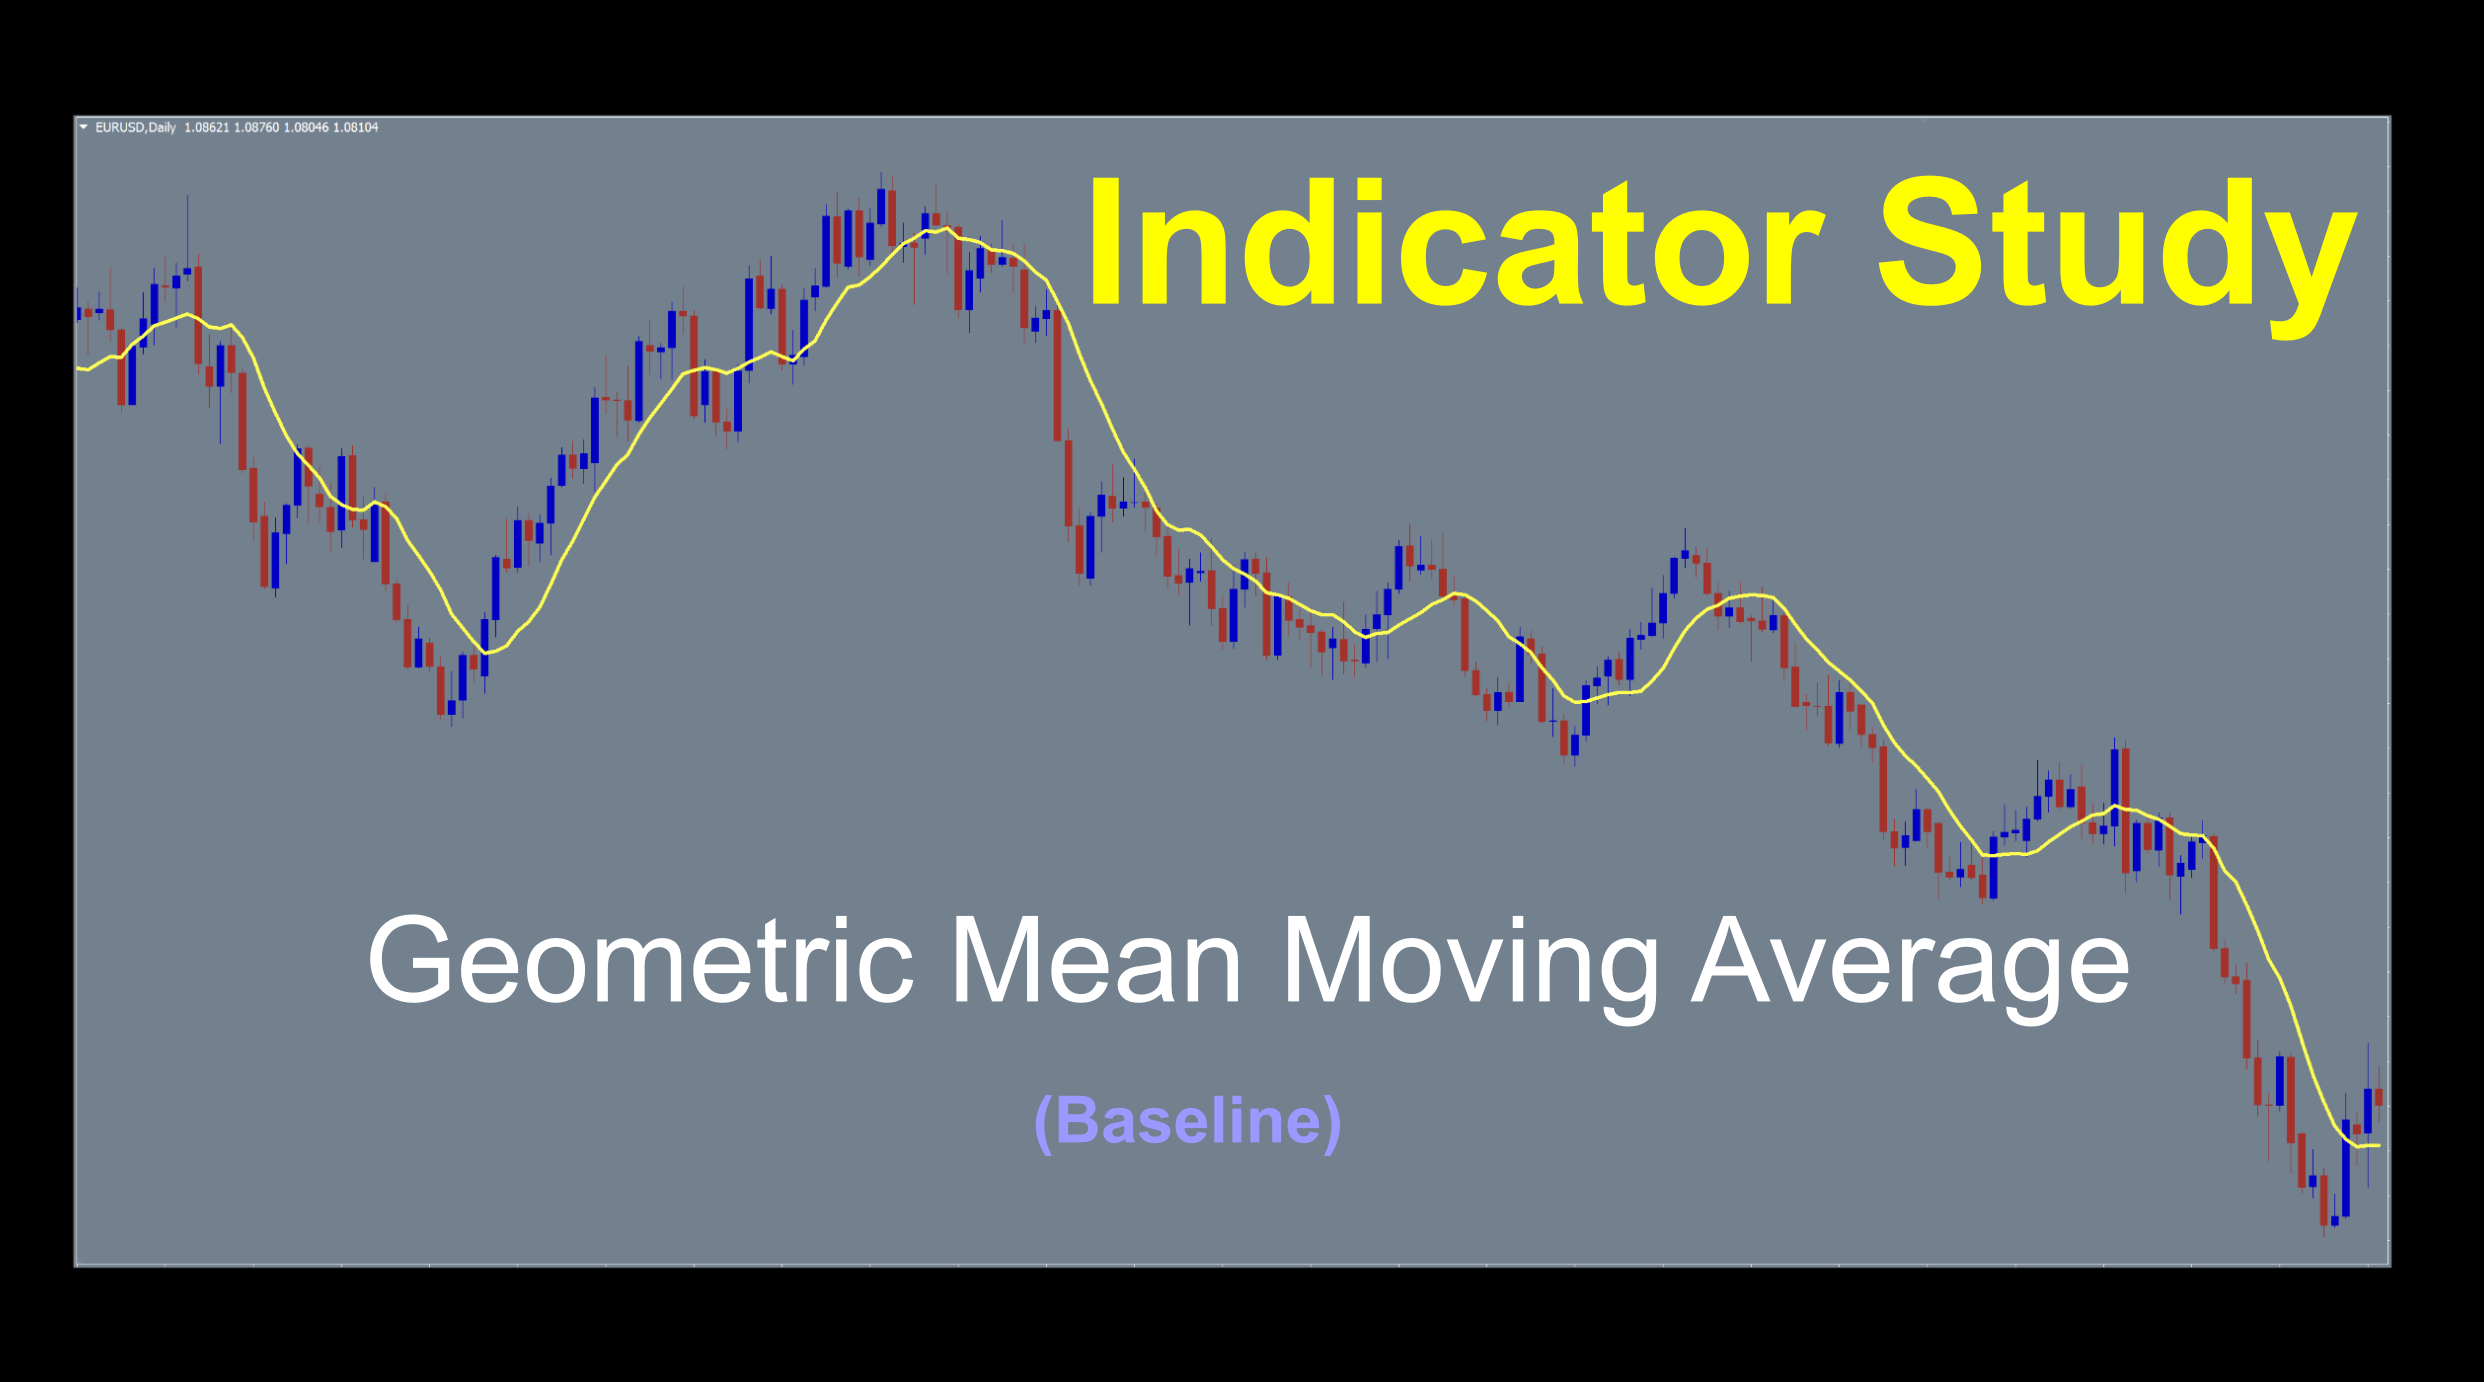
Geometric Mean Moving Average If you’d like to follow along with the e-book version of the blog, click on the play button in the audio player below (at the bottom of the page). Sounds Very Technical The title of this week’s indicator has a very technical sounding name. Ironically, the math is not very complicated, … Read more