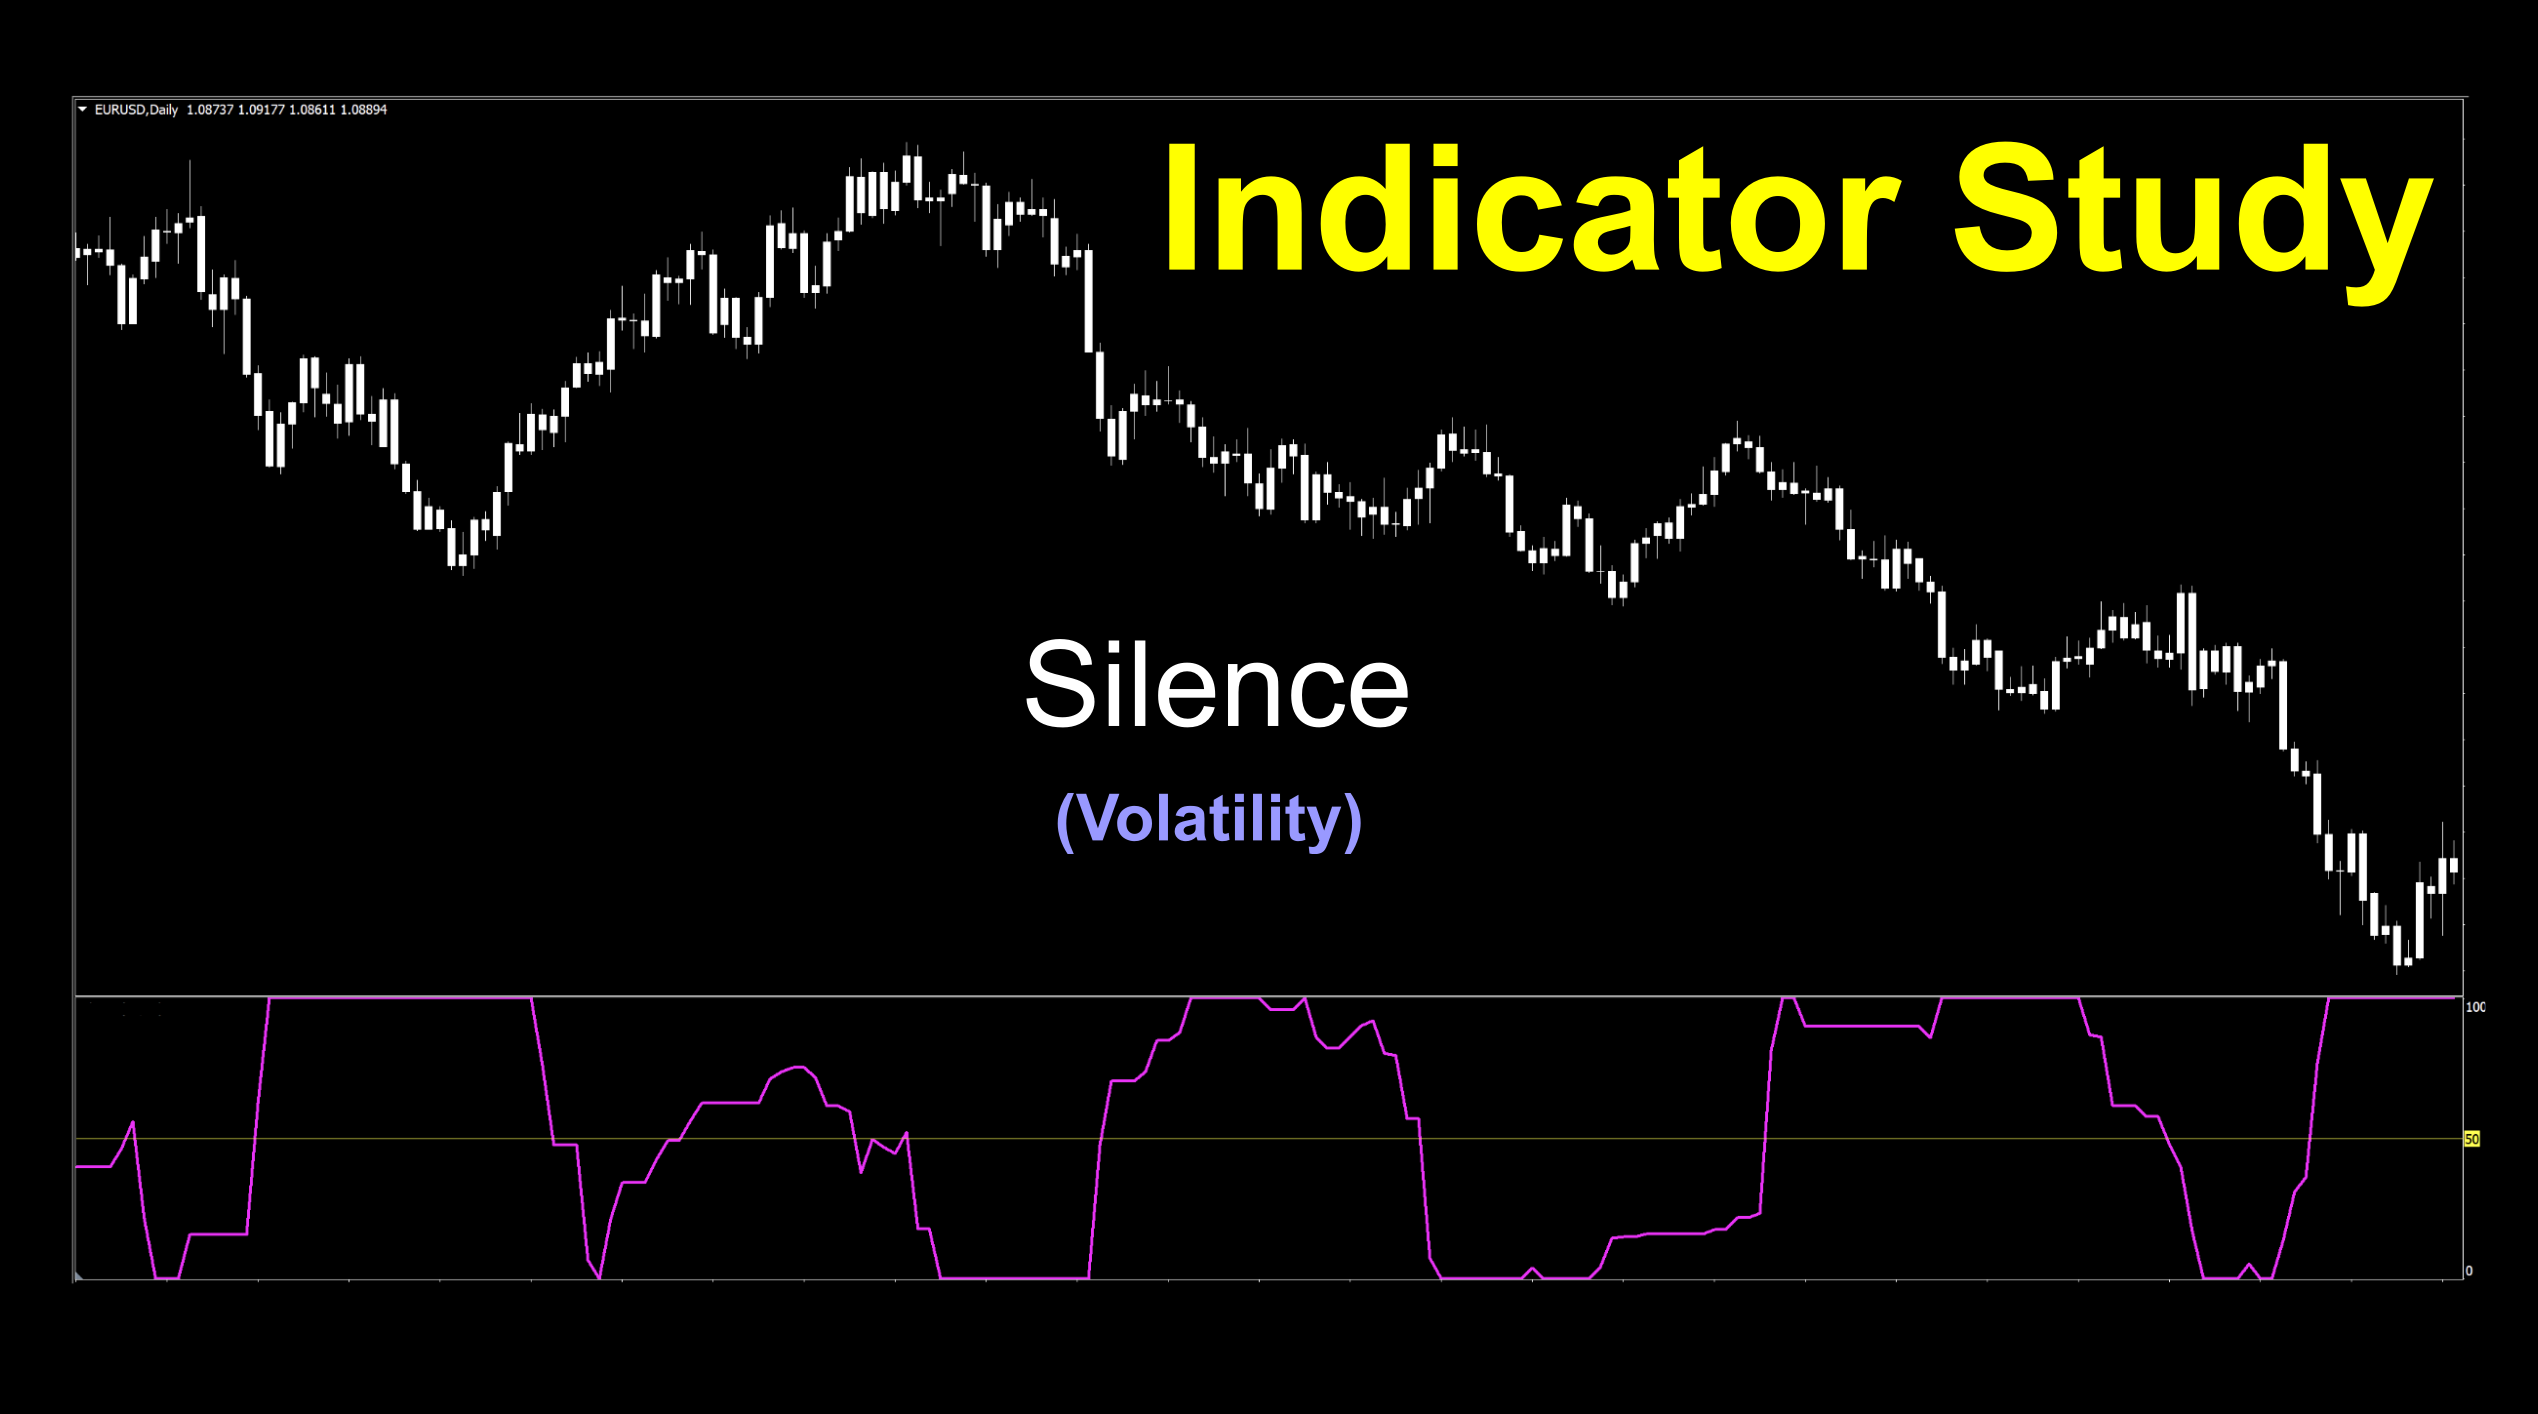
The Sound of Silence
Silence is golden…isn’t that what they say? In the rather noisy world we all currently live in, silence is often appreciated, and occasionally difficult to find. Fortunately for us, we have an indicator generously suggested by a user this week which happens to carry that title. We’re not sure why, but we were very interested in it. Let’s all put our hands together for Matt S. for his contribution. Thank you, sir! Let’s learn more, shall we?
 On Your Mark
We initially recorded our data stream using both lines but realized later that it was somewhat difficult to see the volatility signal line, so we removed one of the lines (you’ll see what we’re talking about further down in the blog) and reshot the video for something a little easier to see. As we did in the testing, we added an SMA (Simple Moving Average) 14 period for a baseline to run both our tests and the video.
You Do You Boo
We had to pair the indicator with something…anything in order to create signals. Obviously, there are many other indicators to pair this one with to get a multitude of results. We’ll address a little later on in the blog as well.
So Much Generosity
We’re very appreciative of our community. Taking the time to email us and even include the indicator is more than we could ask for. As we’ve mentioned; the weirder, the better. I mean, how much fun is it testing any indicator that might bring you more profits, right? But when it’s a real oddball, the enthusiasm goes through the roof. After all, aren’t we all just a little bit nerdy anyway? Keep sending those sublime and spectacular ideas to stonehillindicator@gmail.com, we’re counting on you.
Quiet Down
We alluded to the name of this week’s indicator earlier, and we can now confirm that it is indeed called Silence. That’s it. That’s the name. Not a lot about it but from what we can tell, it came from a Russian coder named Trofimov Evgeniy Vitalyevich in 2009. All the comments in the MetaEditor were gibberish, so unfortunately, we don’t have much to go on.
Classification Conundrum
We were deciding on how to classify this indicator. It was initially suggested as an “ugly” volume indicator, but we feel that it fits better in the volatility category; which by the way can fill the volume portion of your algorithm, should you decide to place it there. The premise is that it can provide a signal when the market begins to transitions from a flat, low volatility market to a trending market with sufficient volatility. We’ll get into how to use it further down.
Busy Bee
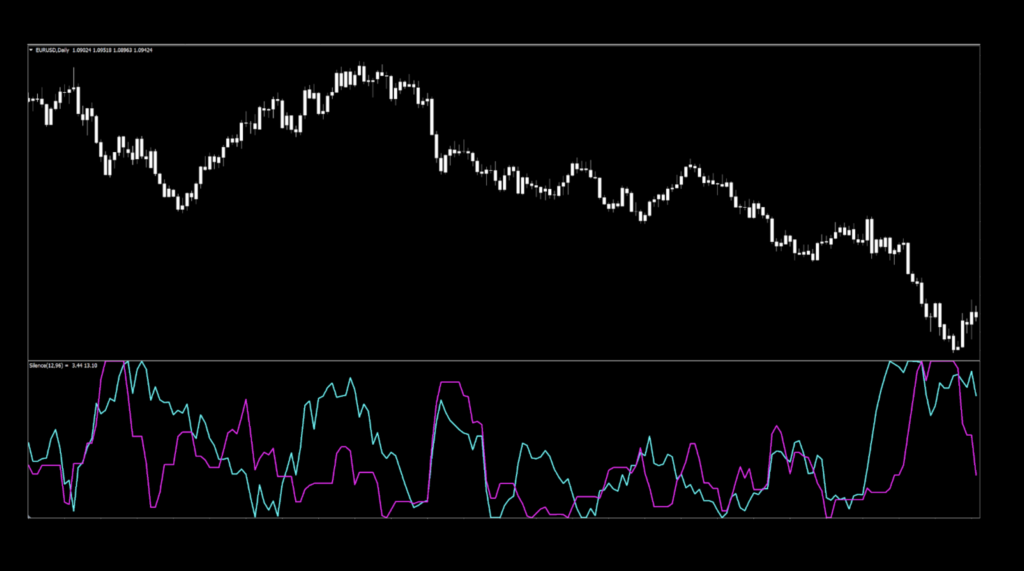
The default view looks very “busy”, but we’ll break it down for you shortly. The stock colors were blue and red, but very dim and difficult to see, so naturally we made them bright and happy. We also noticed that the signal lines appear to bump up against the constraints of the indicator window. Don’t worry about it as it doesn’t affect us, or identifying the signals. Of course, we changed the candles to a nice frosty white to keep you focused on the indicator. Onward…
MyPeriod: This number change both lines. The higher the number, fewer signals are displayed, effectively smoothing out the signal line. The default number is 12.
BuffSize: This setting affects both lines, but to a lesser degree, whereby the amplitude (height) of the signal lines is exaggerated or reduced. The default value is 96.
Advantages
* Provides indication of sufficient market volatility.
* Settings can modulate the degree of volatility for signal identification.
* Can be quickly tweaked.
How We Use It
The purpose of this indicator is to identify sufficient volatility in the market – similar to a volume indicator. It does NOT provide long or short signals. The original intent was a two lines cross where the red line (volatility) crossed and closed above the blue line (aggressiveness), this is accepted as the start of a trend.
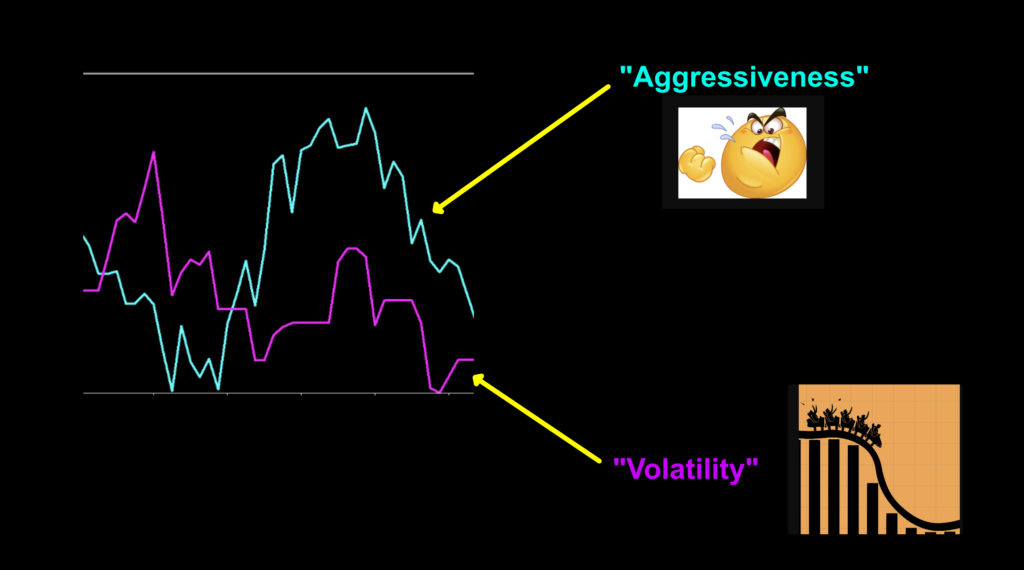
B.E. Aggressive
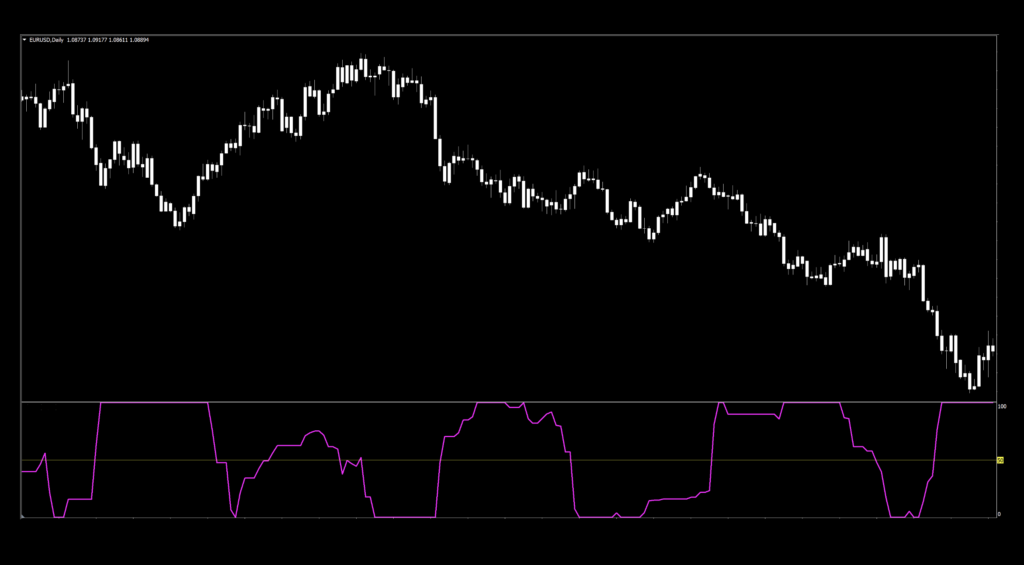
However, we found that it created a lot of confusion and so many signals, so what did we do? We changed it. What did we change it to? Great question. We changed it to a mid-line cross. In this instance, that midline is 50 and got rid of the blue (aggressiveness) line. So, now it looks like this.
We Ain’t Done
Remember, you need to change your way of thinking for this indicator. In most instances, we’re conditioned to look for “long” and “short” signals. Not this time. Make sure your brain understands that we’re looking for “Yes – trade”, or “No – wait”. That’s the reason for a volume/volatility indicator. We’re only interested in a trade if the volatility signal line crosses and closes at the 50 line. Fuel for your trade.
What We Did
That being said, we need to put something else on the chart. We added a random color change confirmation indicator on the chart to make things easy to see. Whatever you’re using in your algorithm is fine for comparison. After all, you need a place to start. Let’s take a look at it now…and identify the signals.
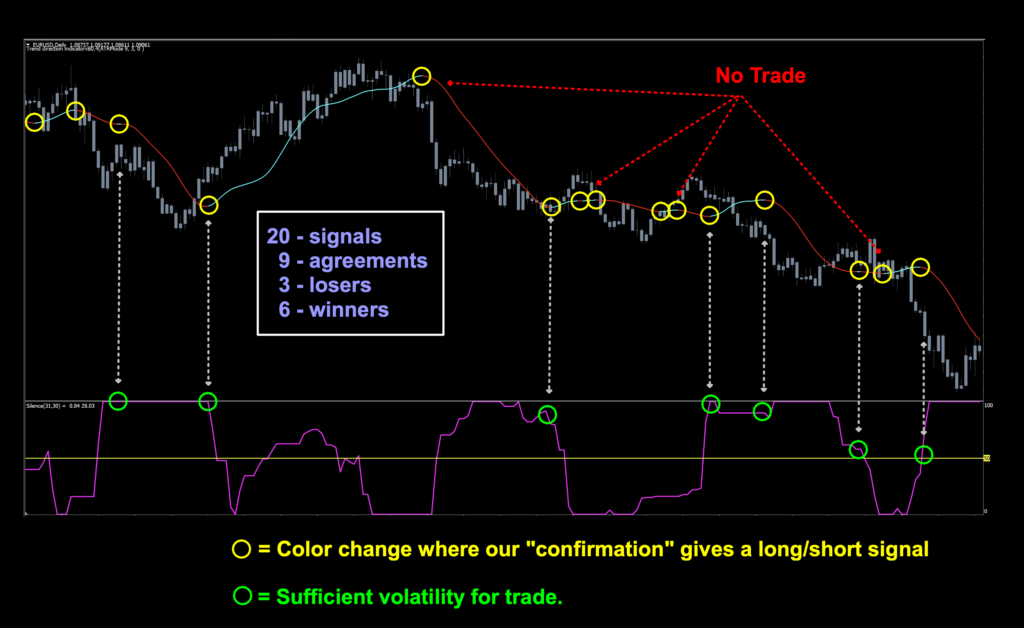
Check Yourself
There were a total of 20 signals; a few were one candle color changes, so we counted them as well. There were 9 instances where the color change and volatility were in agreement and of those bunch, three of them would have been small losses and the remaining six would have been winners. Make sure you’re clear on this, once your algorithm gives you a long or short signal, the last thing you do is check the volatility indicator for confirmation. Remember, it’s a trade/no trade decision…not a long/short signal.
It’s Alright, It’s Okay
Now that we’re moving into the testing phase, we’re going to use a simple moving average to compare our volatility indicator. We won’t change the settings of the moving average, just the indicator’s variables. Why did we choose something different for testing? It really does not matter. We had to use something and since everybody has their own favorites, our choice becomes somewhat irrelevant. Our point is that the volatility indicator was able to provide good yes/no signals to return acceptable numbers. Let’s find out how it does.
Big Tests Today
If you’re new to these studies, we recommend looking at some of the older blogs to understand how we conduct our testing.
The six pairs we recommend testing are…
EUR/USD
AUD/NZD
EUR/GBP
AUD/CAD
CHF/JPY
CAD/SGD
The markets we test our indicators are the:
EUR/USD (Euro/US Dollar)
BTC/USD (Bitcoin/US Dollar)
XAU/USD (Gold/US Dollar)
SPX500 (S&P500 Index)
Timeframes and Results
We’ll run the Silence indicator on the EUR/USD, BTC/USD, XAU/USD, and the SPX500 using the default and tweaked settings across the daily and 4-hour timeframes on the MT4 strategy tester.
We focus on three metrics;
Total trades
Win/Loss ratio
ROI (return on investment)
Results Worth Writing Home About
Below, you’ll find the testing results from our efforts.
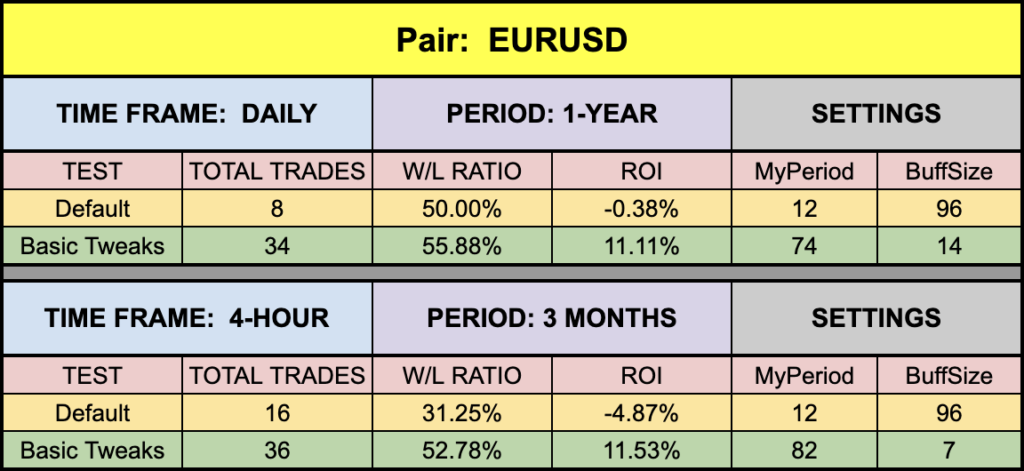
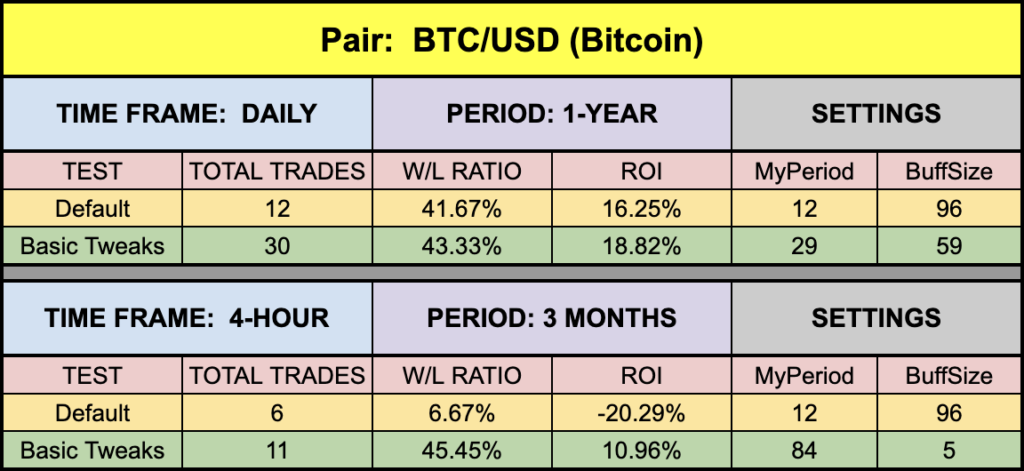
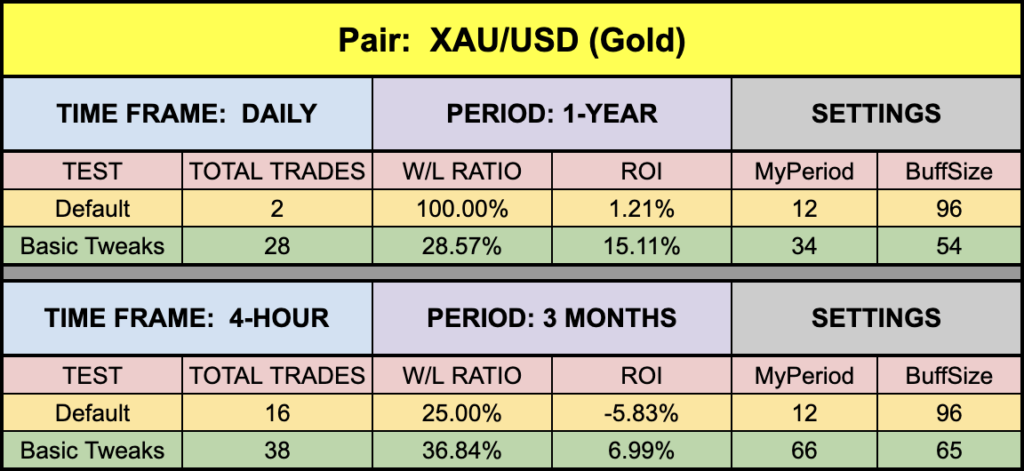
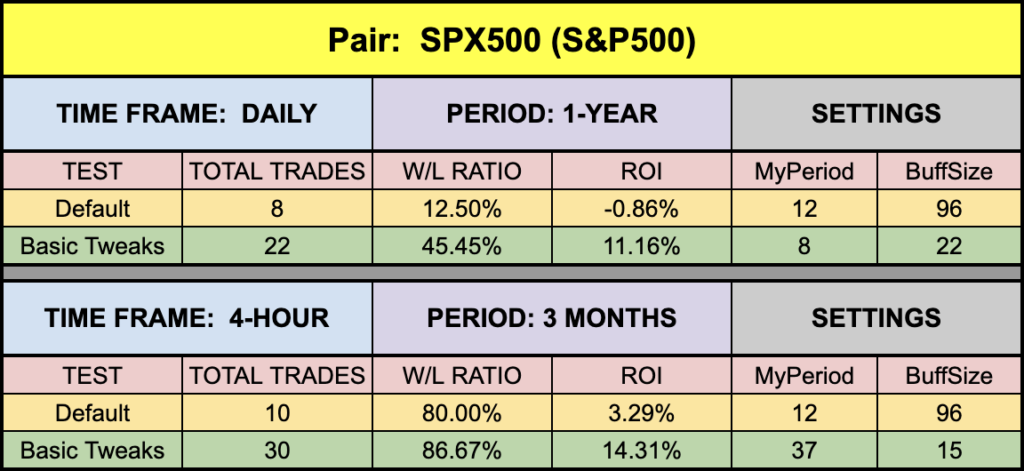
Solid
Numbers were pretty solid across the board here. We were pretty happy with the results. This was an interesting research project and we genuinely appreciate the suggestion. Hopefully this indicator finds its way into your trading toolbox.
Money Management
Money management is based on the NNFX risk profile. That information can be learned in the Advanced Course.
Resources
We’ve made the Silence indicator available for download on our site from the indicator library. When you’re ready to get it, click HERE.
We’re Here For You
Make sure you’re signed up for the latest digests. If you’d like to see what we talked about the last digest, email dan@stonehillforex.com with the title “Latest Digest Please” and we’ll send it off to you within 24 hours. And you’ll also want to subscribe to our YouTube channel for the technical analysis videos. Don’t forget Facebook and Quora, where we answer questions relating to Forex.
Our only goal is to make you a better trader.
BTW – Any information communicated by Stonehill Forex Limited is solely for educational purposes. The information contained within the courses and on the website neither constitutes investment advice nor a general recommendation on investments. It is not intended to be and should not be interpreted as investment advice or a general recommendation on investment. Any person who places trades, orders or makes other types of trades and investments etc. is responsible for their own investment decisions and does so at their own risk. It is recommended that any person taking investment decisions consults with an independent financial advisor. Stonehill Forex Limited training courses and blogs are for educational purposes only, not a financial advisory service, and does not give financial advice or make general recommendations on investment.