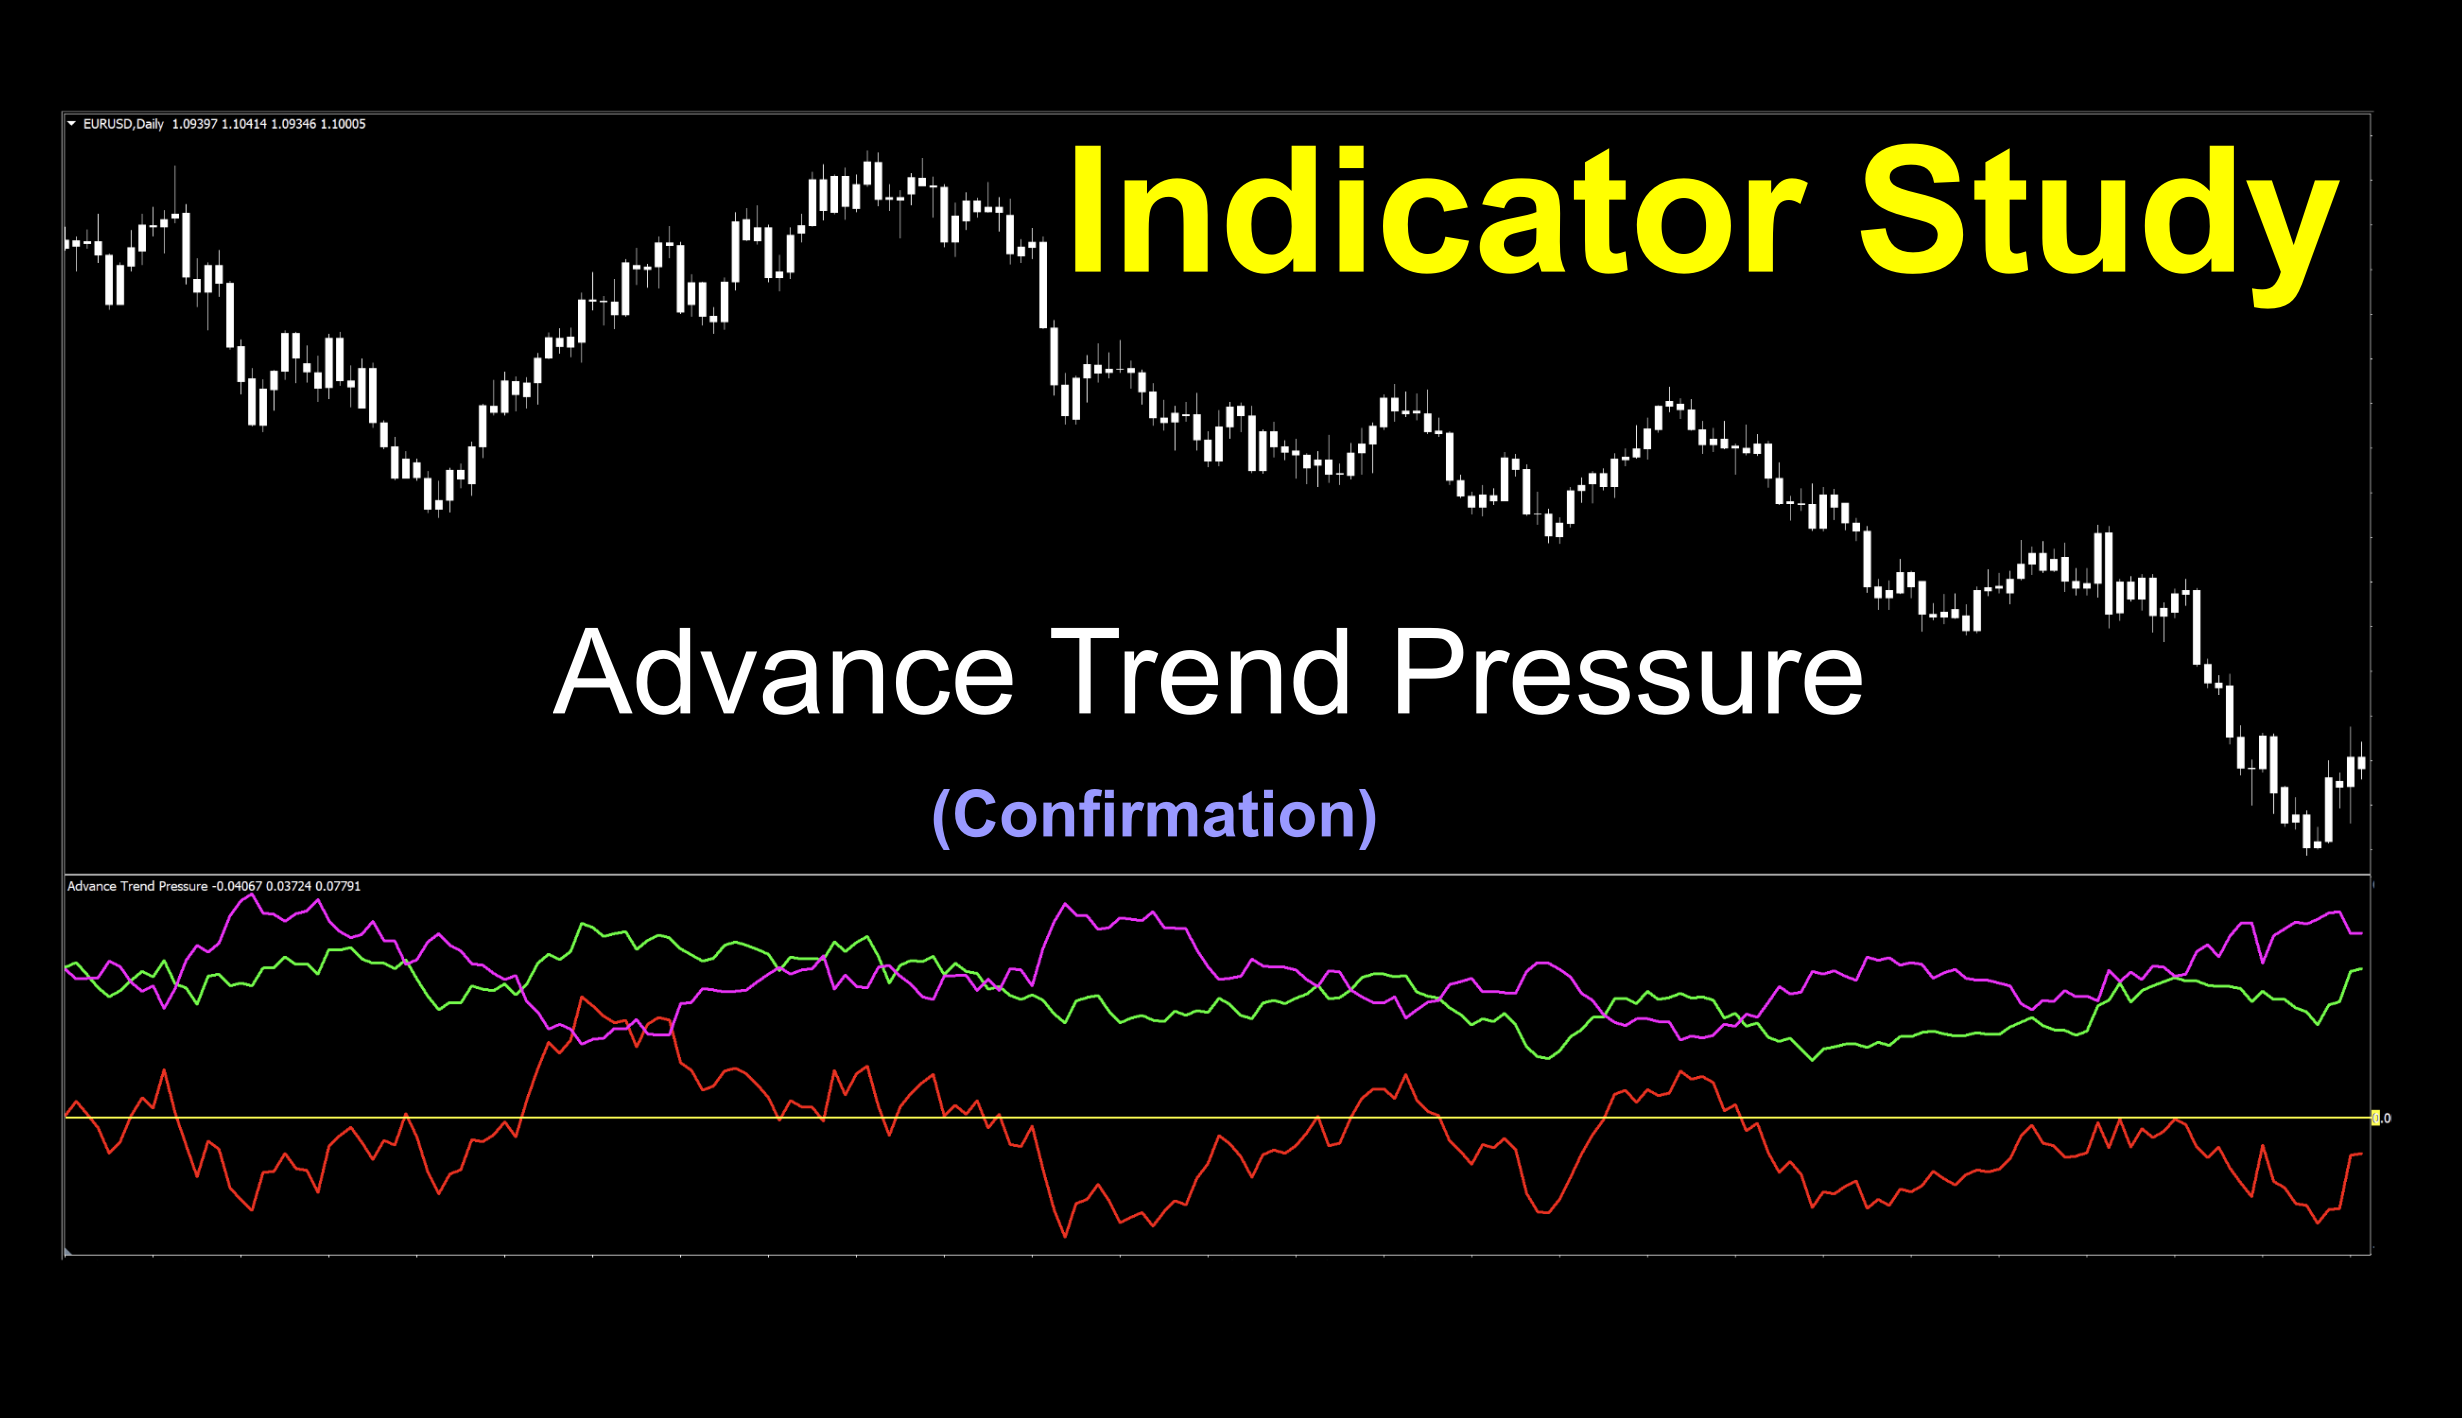
Advance Trend Pressure
If you’d like to follow along with the e-book version of the blog, click on the play button in the audio player below (at the bottom of the page).

Very Funny
After last week’s indicator called the Dollar Pile, we couldn’t resist profiling an indicator this week with a certain name. For those of you are not native English speakers, our attempt at humor is completely justifiable. We’ll make reference to this further on down in the blog.
Double The Fun
A bonus feature of this week’s blog is that it can be viewed as two completely different types of indicators; a zero cross, a two lines cross…or a combination view; i.e., double your pleasure, double your fun. We’ll go through settings and default views, so you’ll understand what we’re talking about.
Double Vision
We’re going to run with a similar play on words, given the chance. When we recorded the data stream, we put up the indicator in both of its formats; however, as two separate windows to keep the view clear for easier analysis. This way, you can decide for yourself which version you prefer on your chart. We ran out the recording a little longer this time, approximately twelve hours, to ensure that we captured some decent market activity. Take a gander at the video, then return to the blog for the rest of it before heading off to work independently.
Ramping Up
They just keep coming in. We’re very grateful. We had a lot of emails this past week with all kinds of suggestions. Furthermore, we’ve received indicators with strange names, origins and even stranger math. Exactly what we’re after. After all, there was a point to the dirty dozen. So much so, that it got its own module in the Advanced Course. Why rely on indicators created for markets we don’t trade. Keep them coming. Send your brain nuggets to stonehillindicator@gmail.com, so we can keep our indicator pool filled to the brim for future blogs.
Juvenile Humor
Now that we’ve got some of the weighty business out of the way, we’ll get onto a little brevity before returning to the serious business of trading. This week’s indicator has the abbreviated name of TP. Did you make the connection? Kind of hard not too, right? We wondered if there was snickering during the coding process.

But…in actuality, the abbreviation is short for Trend Pressure, or its full name, Advance Trend Pressure. Which in itself is kind of amusing considering how simple the math is. An MT4 coder devised this based on a .lua file in 2011 and is calculated using the following formulas;
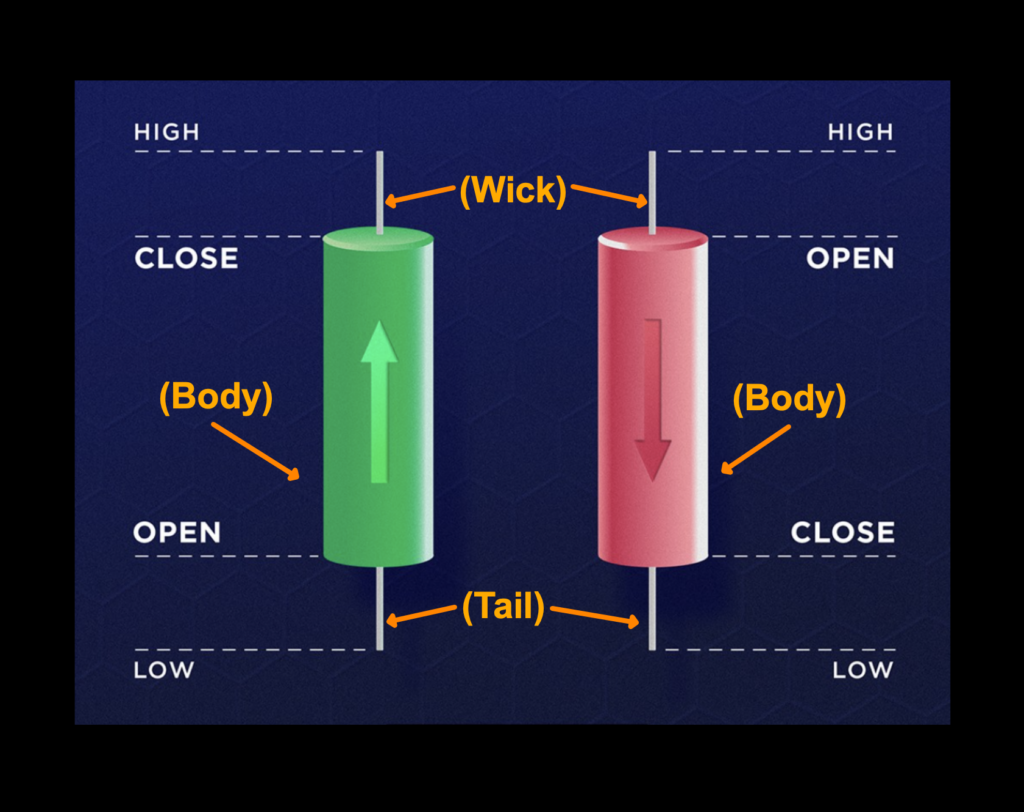
Uptrend: Close-Open, High-Close and Open-Close price.
Downtrend: Open-Close, High-Open and Close-Low prices.
Simply stated, the indicator uses the size and direction of candlestick bodies, including the amplitude of each candle’s wick and tail.
*What is a LUA file?
Source code written in “LUA”, a programming language designed for extending or adding functionality to software applications. Many .lua indicators have been recoded into .ex4 and .mq4 files over the years for the MetaTrader platform.
Simple Starts
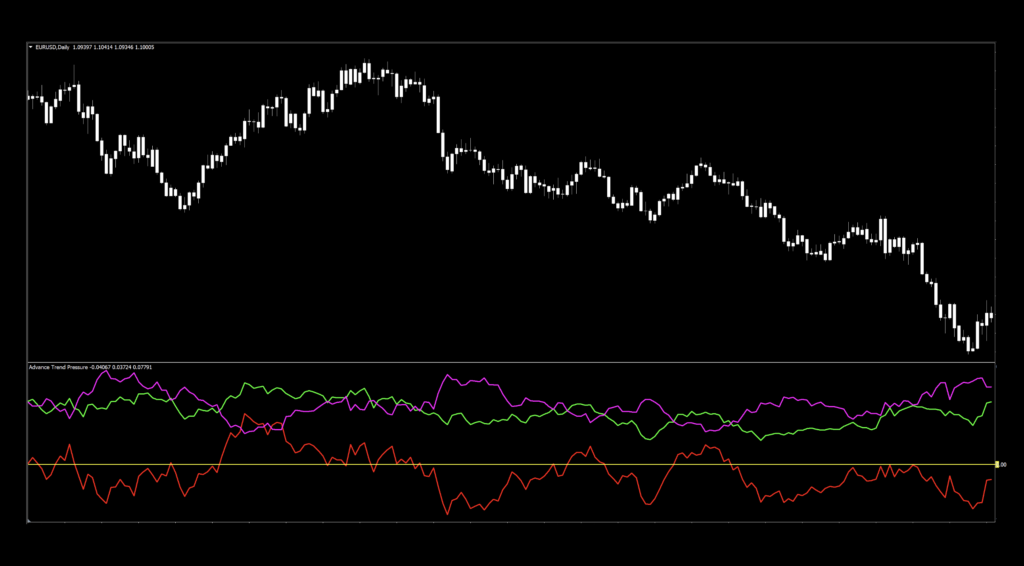
For the chart view, we won’t blast you with both barrels just yet. We’ll begin with the zero cross version to get acquainted. The default colors are pretty dim, so we brightened them up somewhat, and changed the color of the signal line for easier viewing, and of course, added the zero line. Candles are white to keep your line of sight on what’s important here…the indicator.
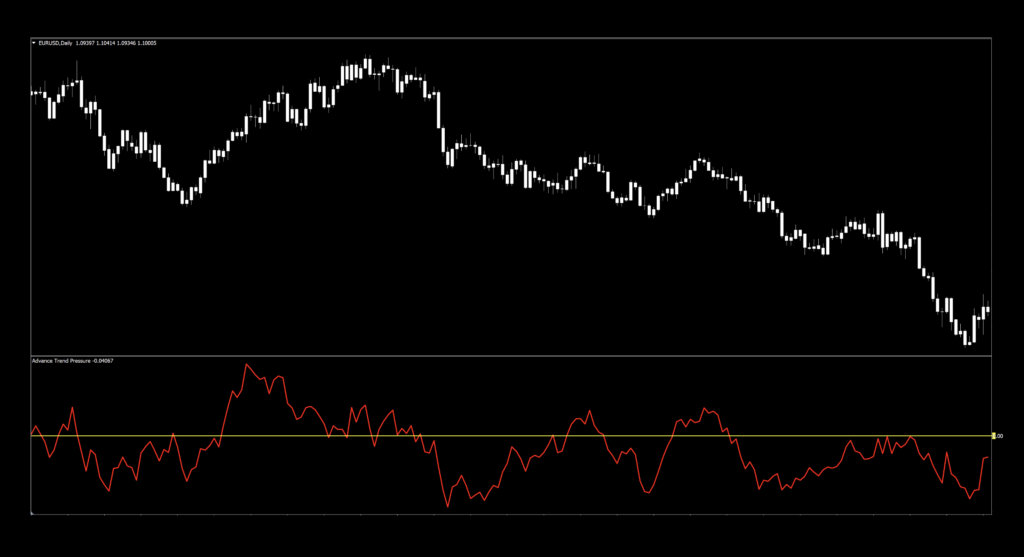
Pretty straight forward…but, there is a setting which toggles the double barrel view. We’ll show you the settings first, so you know where we’re coming from.
Settings
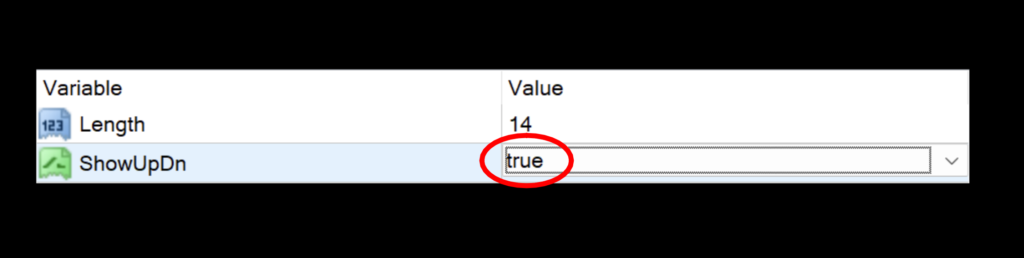
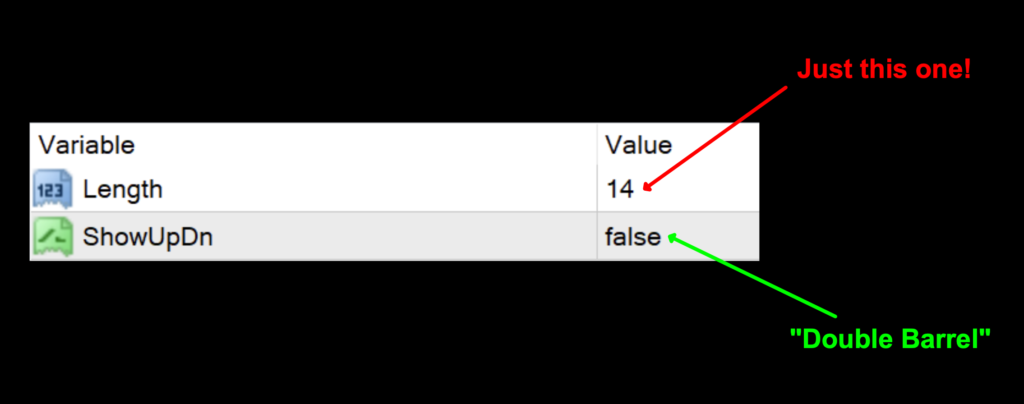 The “ShowUpDn” is where we get the dual view. By toggling it as shown below, you’ll see what we mean.
Ta-Da
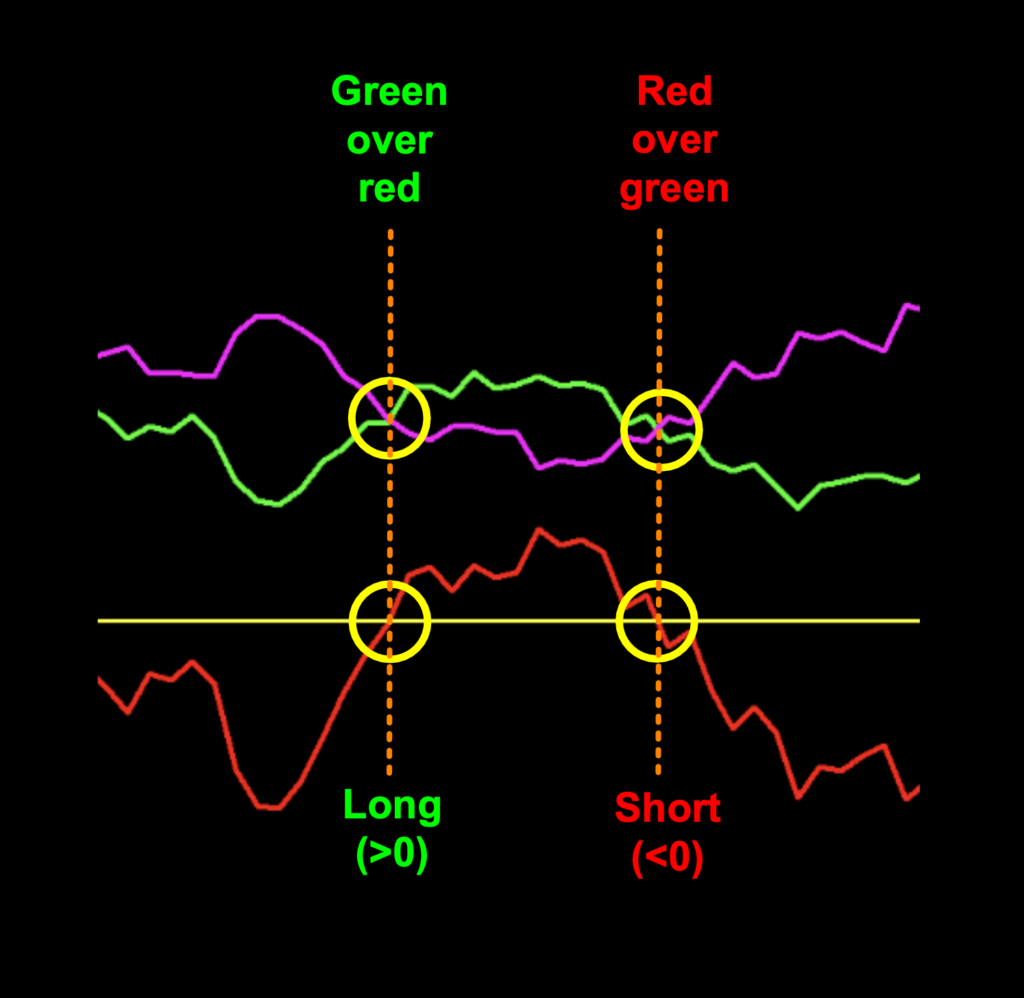
What is this showing us? Exactly the same thing. We admit changing colors for better visibility, but if you mark off the zero cross, you’ll see a coinciding two lines cross reflecting the same signal; i.e;
Zero line cross ABOVE zero = green crosses ABOVE red.
Zero line cross BELOW zero = red crosses ABOVE green.
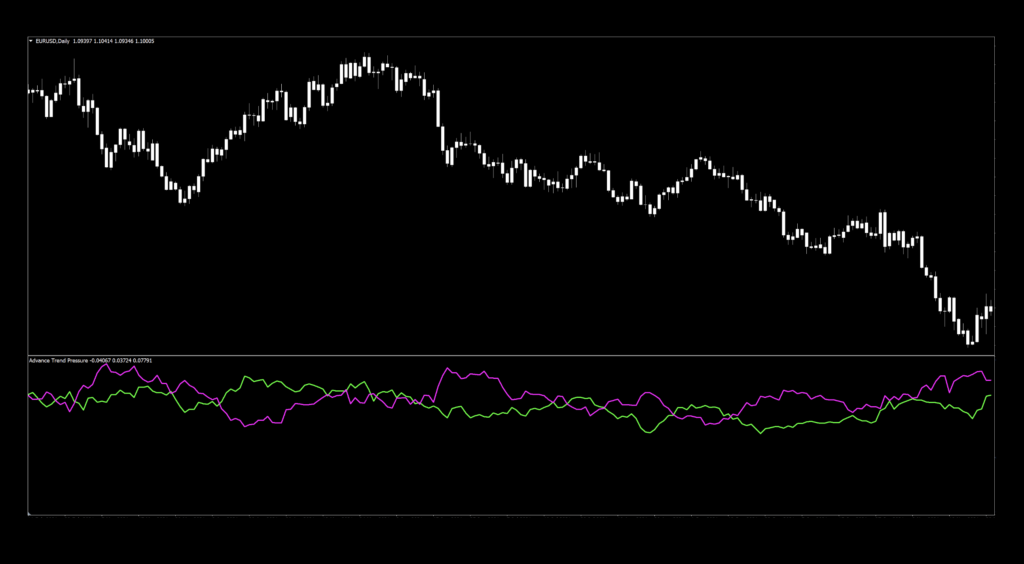
If you’re partial to the two line cross version, this is what it would look like:
Length: The number of periods used to calculate the signal. The default value is 14.
Advantages
* Only one setting for quick testing.
* Choice of visual signal identification.
* Reacts quickly to change in trend.
How We Use It
I think we’ve made it clear, but for those of you who like our format…this is for you.
Long signal: (zero cross) When the signal line crosses and closes above the zero line. Entry is on the open of the next period. (two line cross) When the green crosses over the red, entry is made on the open of the next signal.
Short signal: (zero cross) When the signal line crosses and closes below the zero line. Entry is on the open of the next period. (two line cross) When the red crosses over the green, entry is made on the open of the next signal.
The Mark-Up
Now that we’re done with the mandatory business, we’ll get to the fun stuff; the mark-up and testing. For all fans, we’ll leave both versions on the chart and draw lines through the signals towards price to keep things simple.
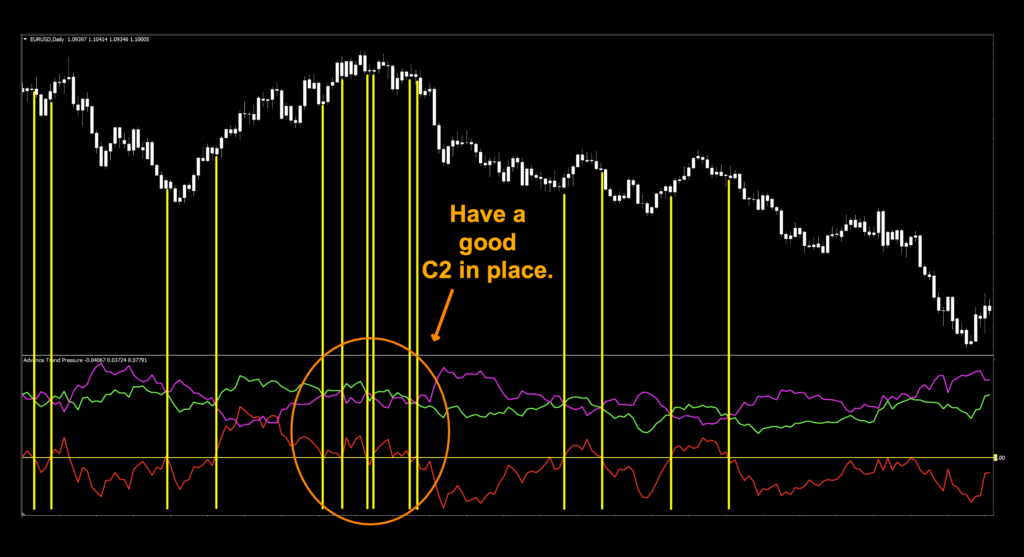
Quick Reaction
In the default view, you can see how changes in price will create multiple signals, as noted in the circled area. What do we always advocate? Never use a signal indicator, no matter how amazing it may seem, and always follow them rules. There was a mix of trades in this screenshot; including a couple of small losses, but some pretty killer runs where you would have booked some tidy profits. Remember, losses are part of the game. Minimize them, learn from them, and move on.
We’ve got the Tests
If you’re new to these studies, we recommend looking at some of the older blogs to understand how we conduct our testing.
The six pairs we recommend testing are…
EUR/USD
AUD/NZD
EUR/GBP
AUD/CAD
CHF/JPY
CAD/SGD
The markets we test our indicators are the:
EUR/USD (Euro/US Dollar)
BTC/USD (Bitcoin/US Dollar)
XAU/USD (Gold/US Dollar)
SPX500 (S&P500 Index)
Timeframes and Results
We’ll run the Advance Trend Pressure indicator on the EUR/USD, BTC/USD, XAU/USD, and the SPX500 using the default and tweaked settings across the daily and 4-hour timeframes on the MT4 strategy tester.
We focus on three metrics;
Total trades
Win/Loss ratio
ROI (return on investment)
Results Make The World Go Around
Below, you’ll find the testing results.
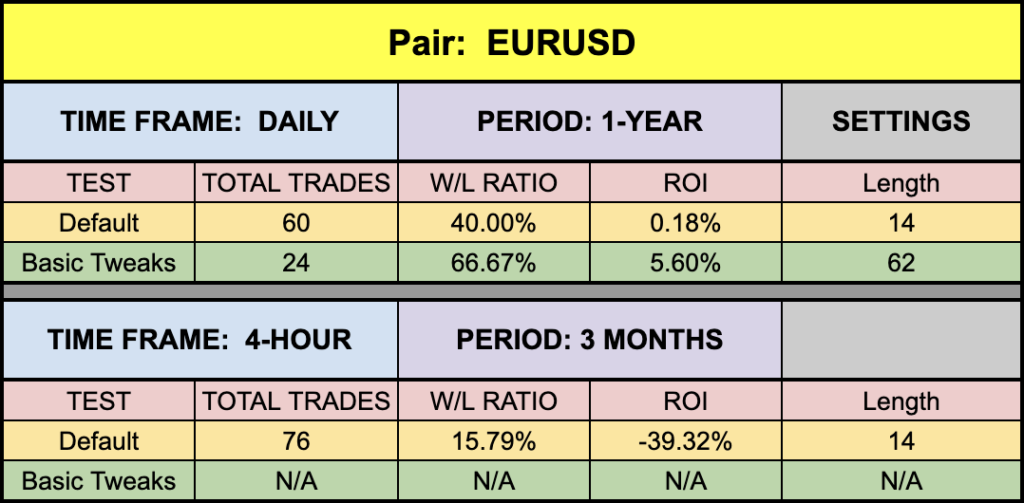

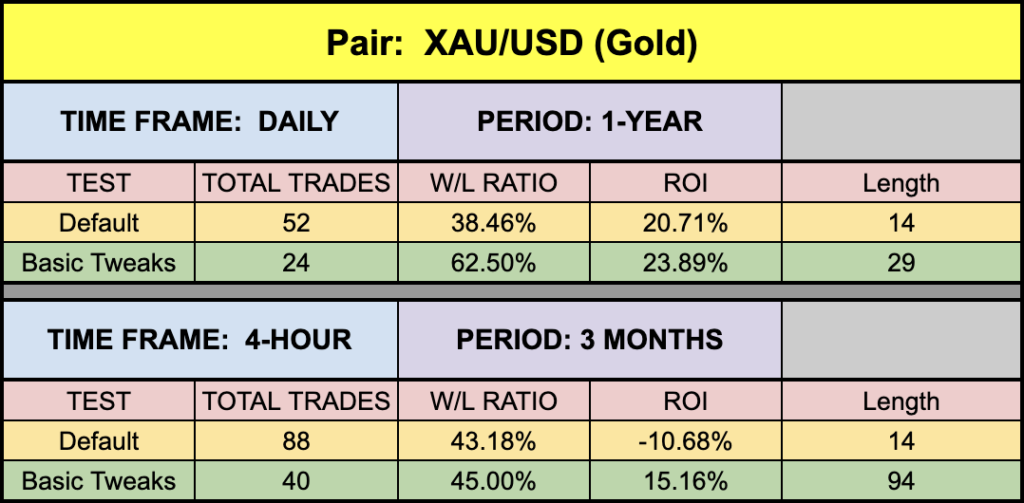
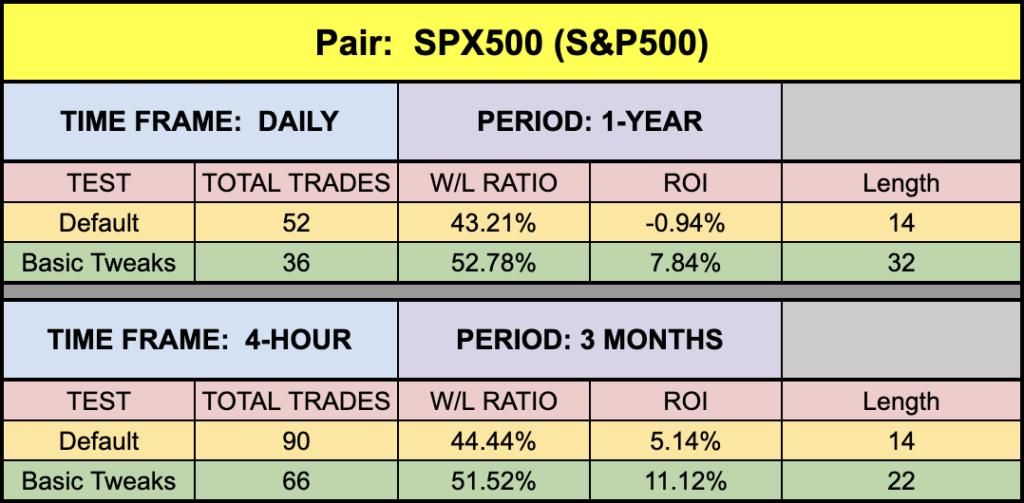
Sorry Euro
On everything except the 4-hour Euro, we were able to find better settings. It happens. But, we had some pretty solid numbers elsewhere. Of course, XAU was this week’s winner but think about what the indicator is doing. It reacts very quickly to price’s behavior. A move backed with strong momentum and heavy volume is going to post great numbers. It’s just the nature of the markets. Don’t get mired down trading a few “favorites”. Look through all 36 pairs. Find those opportunities. Let them come to you, then book those profits. You got this!
Money Management
Money management is based on the NNFX risk profile. That information can be learned in the Advanced Course.
Resources
We’ve made the Advance Trend Pressure indicator available for download on our site from the indicator library. When you’re ready to get it, click HERE.
We’re Here For You
Please ensure you sign up on our contacts page for the latest digests. If you’d like a copy of the most recent digest, email dan@stonehillforex.com with the title “Latest Digest Please” and we’ll send it off to you withing 24 hours. Of course, you’ll want to subscribe to our YouTube channel for the technical analysis videos. Don’t forget, we’ve got a page on Facebook and a space on Quora, where we answer questions relating to Forex.
Our only goal is to make you a better trader.
BTW – Any information communicated by Stonehill Forex Limited is solely for educational purposes. The information contained within the courses and on the website neither constitutes investment advice nor a general recommendation on investments. It is not intended to be and should not be interpreted as investment advice or a general recommendation on investment. Any person who places trades, orders or makes other types of trades and investments etc. is responsible for their own investment decisions and does so at their own risk. It is recommended that any person taking investment decisions consults with an independent financial advisor. Stonehill Forex Limited training courses and blogs are for educational purposes only, not a financial advisory service, and does not give financial advice or make general recommendations on investment.