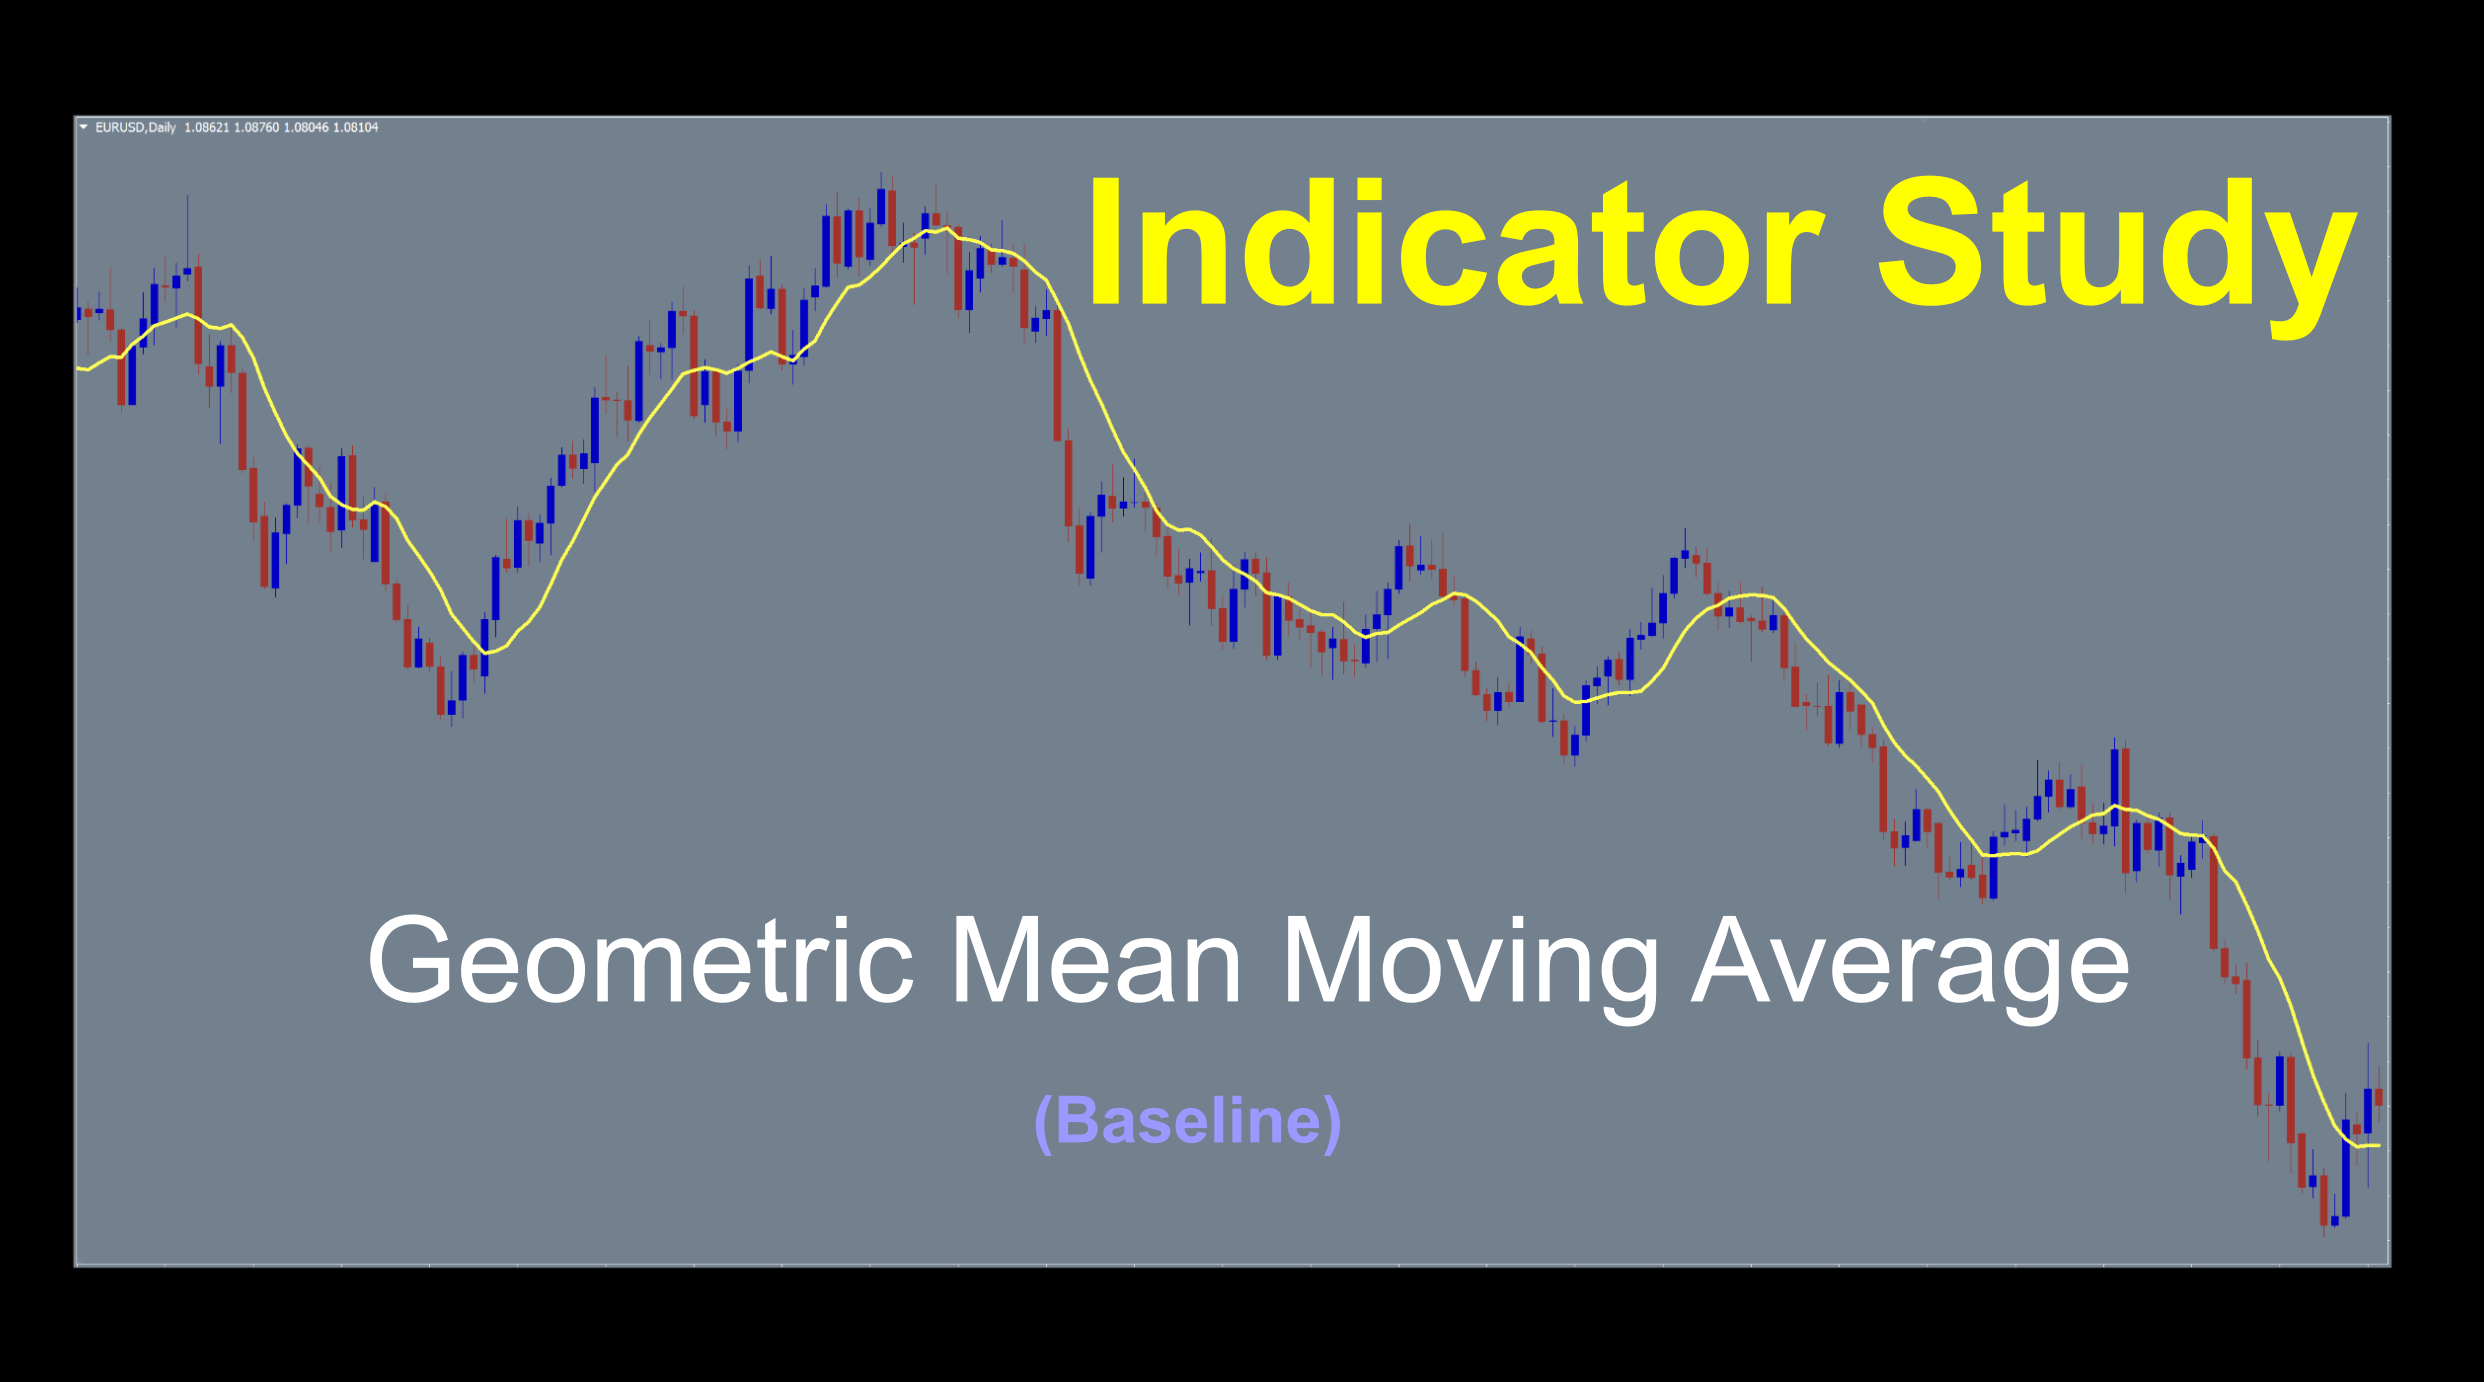
Geometric Mean Moving Average
If you’d like to follow along with the e-book version of the blog, click on the play button in the audio player below (at the bottom of the page).

Sounds Very Technical
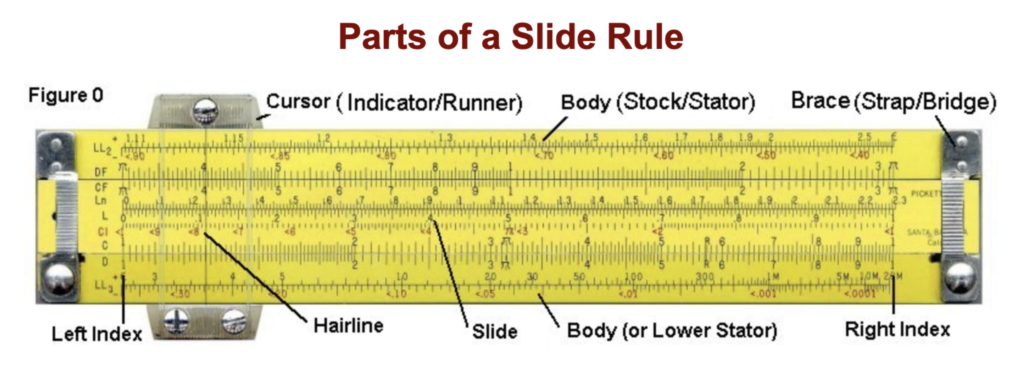
The title of this week’s indicator has a very technical sounding name. Ironically, the math is not very complicated, although I’d be remiss to dismiss it as something easily (and repeatedly) calculated blistering fast when plotting the signal line. Once again, let’s all give a collective thanks to the tiny microprocessor, and the fact that we’re alive to use it to our advantage. After all, the alternative of working slide rule arithmetic would kind of suck.
Midweek Shenanigans
We’re recording our data stream mid-week, the same week as last week’s confirmation indicator. We’re not breaking any rules, right? That being the case, we recorded two sessions of the indicator; one with standard settings and a shorter clip with altered settings to help novice traders learn how baselines work. After all, mixing things up for diversity keeps things interesting in what should really be a boring endeavor.
Boring Endeavor?
Forex trading is boring? What sacrilege is he speaking of? Fair question. We occasionally plug some trading psychology into the indicator series, and this seemed like a good time to bring up a little something. Let me repeat.
Forex Trading Should be Boring
Let me clarify that statement. Algorithmic trading is a series of decisions that follow something called “Boolean Logic”. If something happens (or doesn’t), then something else happens (or doesn’t). Simple binary decisions – yes/no, true/false using three operators; AND, OR, and NOT. It sounds a little odd, but just think of a decision tree.
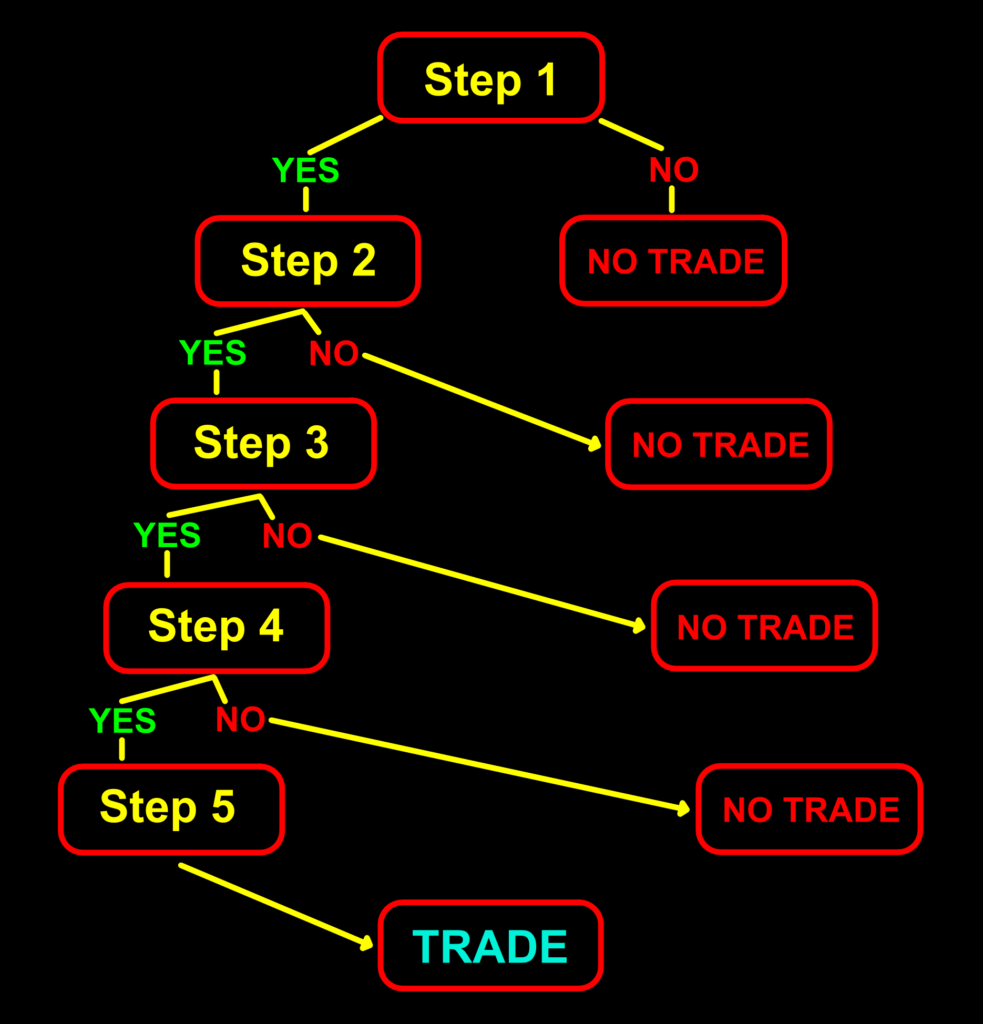
That’s an algorithm, or a process with specific rules for problem-solving operations. Substitute the parts of your algorithm into those little red boxes and voilà, you have your logic statements for making trades. I don’t see any emotions lurking in those boxes, do you? This week’s video is a little longer because we’re spending a few moments on something significant. We’ll keep it light and breezy, but you don’t want to miss it.
You’re So Kind
We’re getting indicators each week, and we appreciate it. Some contributors even check for repainting, which is a nice bonus as we’re finding many we test are, in fact, repainting indicators. As we mentioned in the digest, we are collecting them to create an ongoing blog as a kind of public service announcement. In the meantime, keep sending your findings for the indicator profile series. VP and I examine each one. The email address is stonehillindicator@gmail.com, and as always, thanks for your efforts.
Lifestyles of the Geometric Crowd
This week, we’re looking at a baseline called Geometric Mean Moving Average. The indicator was coded in 2012 at the request of a trader who wanted to use the geometric mean calculation of price as a signal line for trend identification. Cool idea. We actually have the equation for the slide ruler gang.
GMA = [P1 x P2 x P3 …x Pn]1/n
Where:
P1, P2, … Pn = price data for each period
n = the number of periods
An Older Version of the Matrix
The geometric mean calculation is nothing new. In fact, it’s quite archaic. One of the greats discovered it. You may know his name. Hint…he’s Greek. Get it yet? If not, this brainiac is none other than the ancient Greek philosopher Pythagoras. Remember the Pythagorean Theorem from high school trigonometry? Same guy.

What’s the difference
What is the difference between a regular moving average and a geometric mean moving average? Glad you asked. A regular moving average adds data, where the geometric mean moving average multiplies data. This gives a much quicker reacting moving average for quicker trend identification.
Changes in Attitude
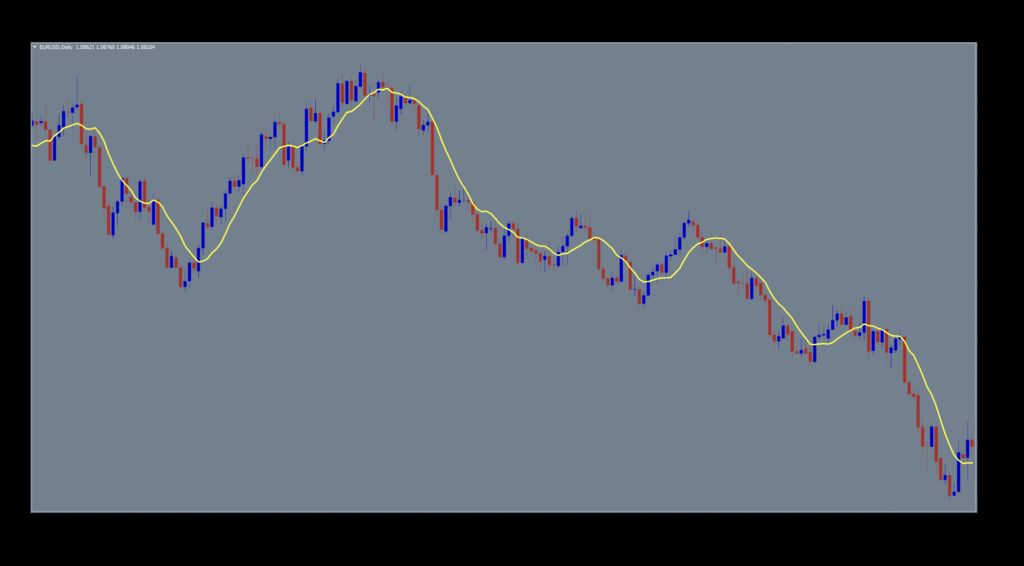
The visuals for this look a little different from our usual display. We changed the background from black to gray, changed the signal line to a thicker yellow, and made our candles darker shades of blue and red to assist with trade entry signal identification.
Settings
There are only two settings for this indicator, and we use both.
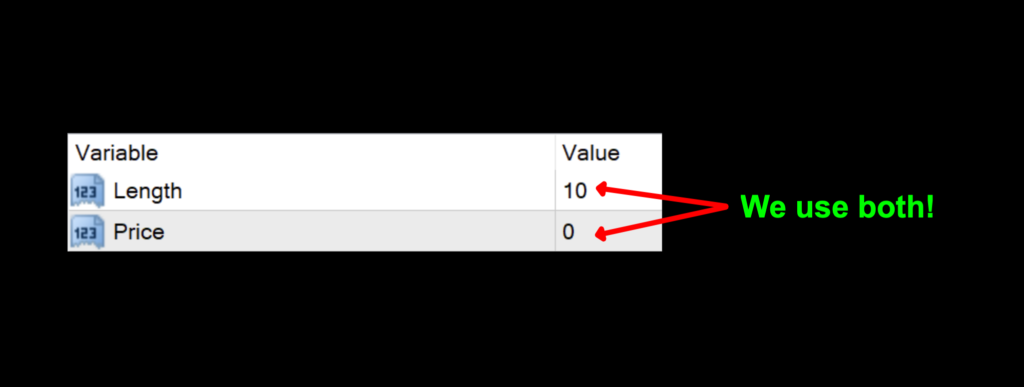
Length: This value determines the number of periods used for the overall calculations. The default value is 10.
Price: The data set used by the price data in the moving average calculation where 0 – Close, 1 – Open, 2 – High, 3 – Low, 4 – Median, 5 – Typical, and 6 – Weighted. The default value is 0 – Close.
Advantages
* We love moving averages. They’re usually one of the first indicators we learn as novice traders.
* Easy to test, only two settings.
* Reacts quickly to change in price.
How we use it.
We want to clarify something specific to the NNFX system. There are three possible trade actions;
OPENING A TRADE
CLOSING A TRADE
MAINTAINING A TRADE
One of these three actions need to happen in the last 30 minutes prior to the close. This is when you make your trading decisions, and not actually wait for the close at 1700 EST, because we trade on the daily time frame.
Long signal: When price crosses above the signal line. Entry is in the last 30 minutes of the trading day.
Short signal: When price crosses below the signal line. Entry is in the last 30 minutes of the trading day.
Mind the Circles
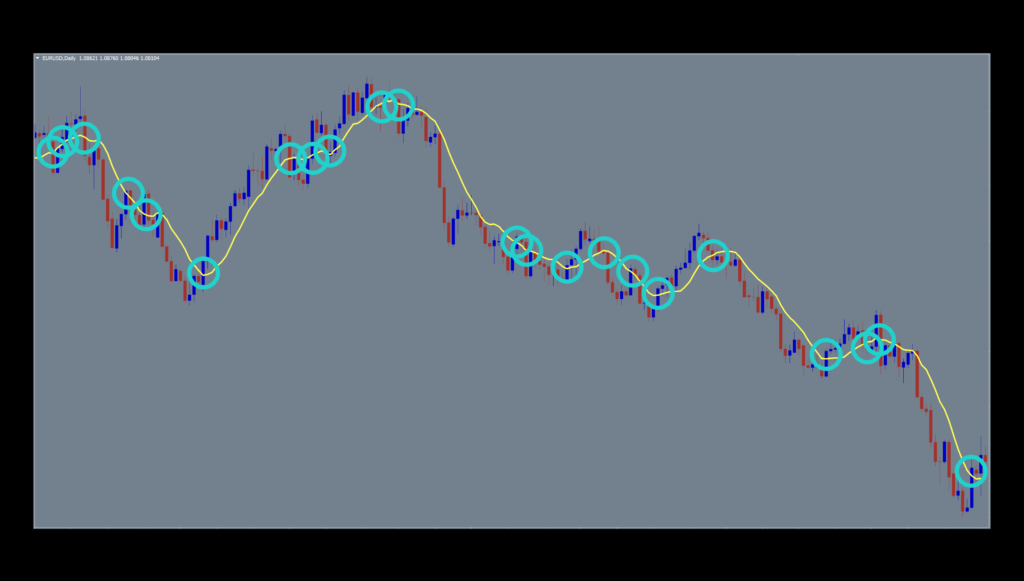
We stayed with the default settings, as usual. One thing that really stands out is how many signals are generated when price lacks significant volatility and flattens. This is where your algorithm would filter out some of the false signals, preventing losses. And we all know that reducing losses can be better than winning.
Testing Going On Here
If you’re new to these studies, we recommend looking at some of the older blogs to understand how we conduct our testing.
The six pairs we recommend testing are…
EUR/USD
AUD/NZD
EUR/GBP
AUD/CAD
CHF/JPY
CAD/SGD
The markets we test our indicators are the:
EUR/USD (Euro/US Dollar)
BTC/USD (Bitcoin/US Dollar)
XAU/USD (Gold/US Dollar)
SPX500 (S&P500 Index)
Timeframes and Results
We’ll run the Geometric Mean Moving Average indicator on the EUR/USD, BTC/USD, XAU/USD, and the SPX500 using the default and tweaked settings across the daily and 4-hour timeframes on the MT4 strategy tester.
We focus on three metrics;
Total trades
Win/Loss ratio
ROI (return on investment)
Results For Your Review
Below are the results from our testing endeavors.
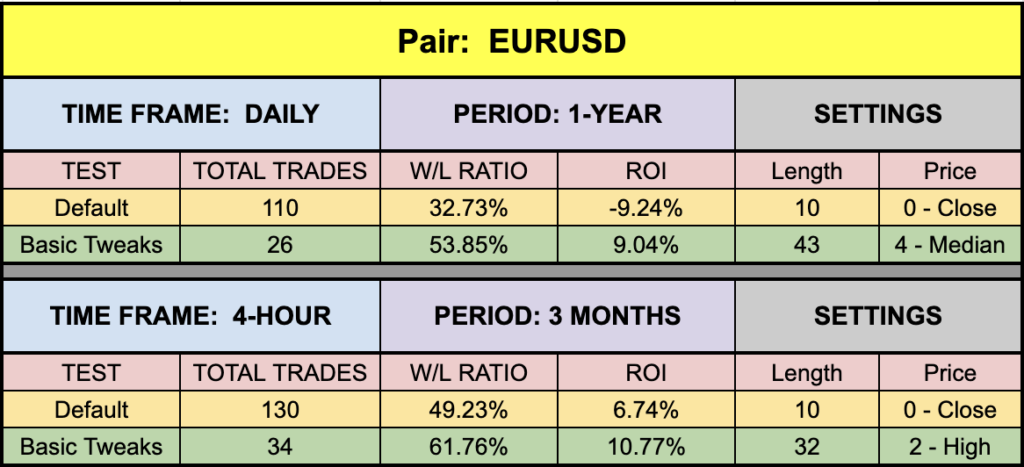
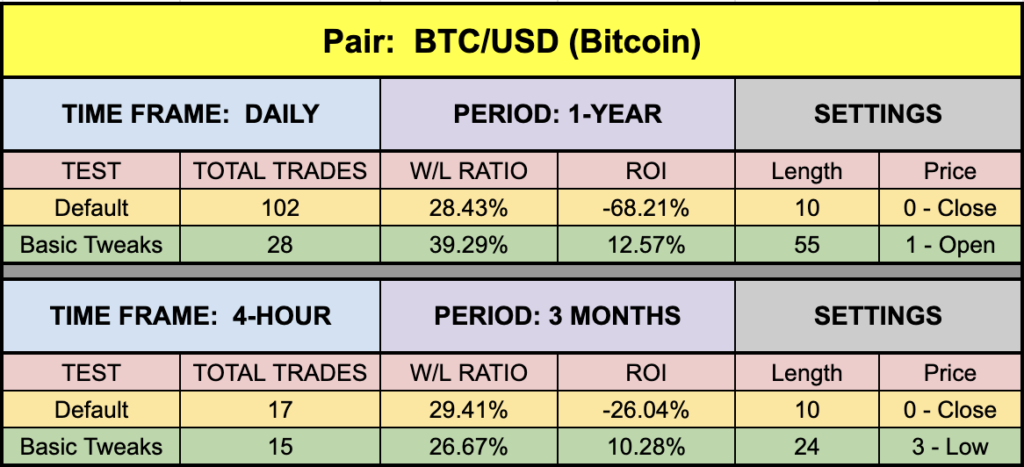
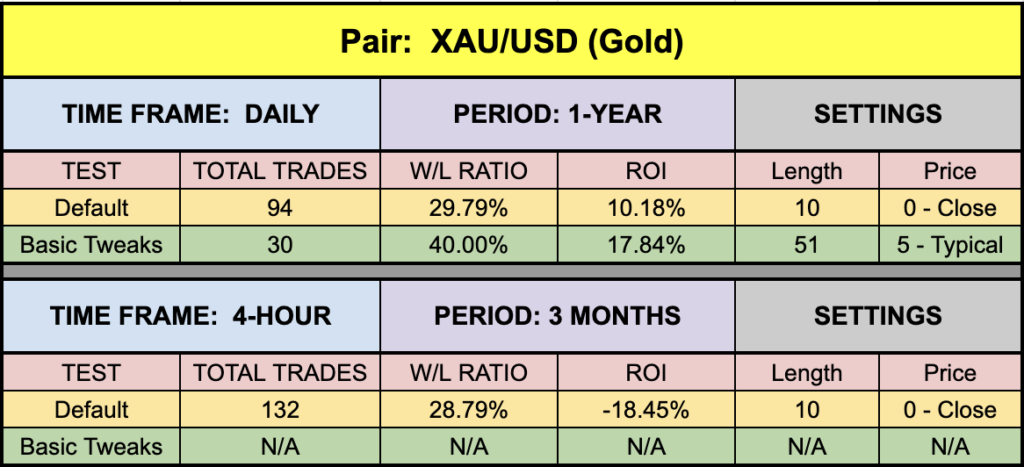
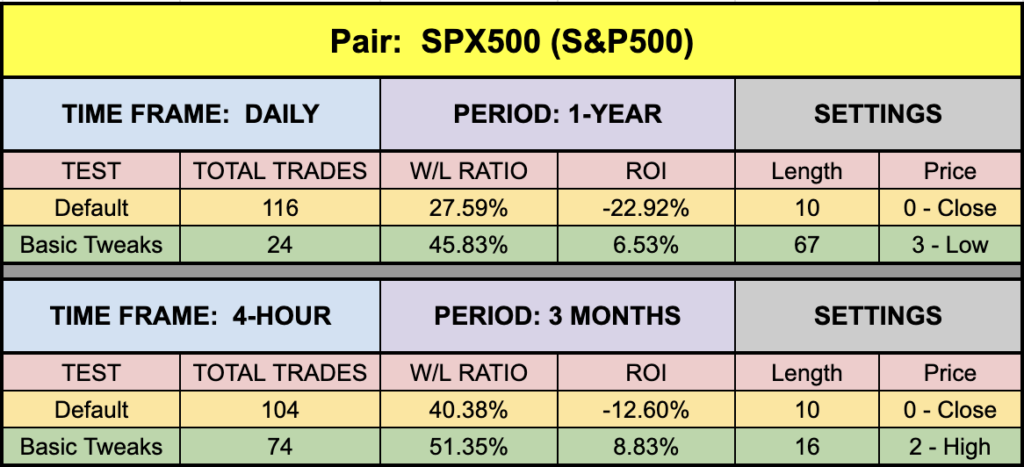
Elevated Occurrences
The first thing we noticed is how many signals were given on the default settings, save the 4-hour BTC. This really wasn’t a surprise, considering that the indicator naturally reacts quickly to price action. In every circumstance, we had to “slow” down the indicator’s math to get better results. Unfortunately, for 4-hour gold, there were no combinations using our criteria during the testing period which resulted in a positive return. That’s fine, we move on.
Money Management
Money management is based on the NNFX risk profile. That information can be learned in the Advanced Course.
Resources
We’ve made the Geometric Mean Moving Average indicator available for download on our site from the indicator library, for free. When you’re ready to get it, click HERE.
We’re Here For You
Make sure you’re signed up for the latest digests. If you’d like to see what we talked about the last digest, email dan@stonehillforex.com with the title “Latest Digest Please” and we’ll send it off to you within 24 hours. We will have the next one coming out soon as we approach the end of the month. Don’t miss it.
Other Resources
And you’ll want to subscribe to our YouTube channel for the technical analysis videos which pair well with these blogs…like cheese and fine wine. Don’t forget Facebook and Quora, where we answer questions relating to Forex.
Our only goal is to make you a better trader.
BTW – Any information communicated by Stonehill Forex Limited is solely for educational purposes. The information contained within the courses and on the website neither constitutes investment advice nor a general recommendation on investments. It is not intended to be and should not be interpreted as investment advice or a general recommendation on investment. Any person who places trades, orders or makes other types of trades and investments etc. is responsible for their own investment decisions and does so at their own risk. It is recommended that any person taking investment decisions consults with an independent financial advisor. Stonehill Forex Limited training courses and blogs are for educational purposes only, not a financial advisory service, and does not give financial advice or make general recommendations on investment.