Average Sentiment Oscillator as a Confirmation Indicator
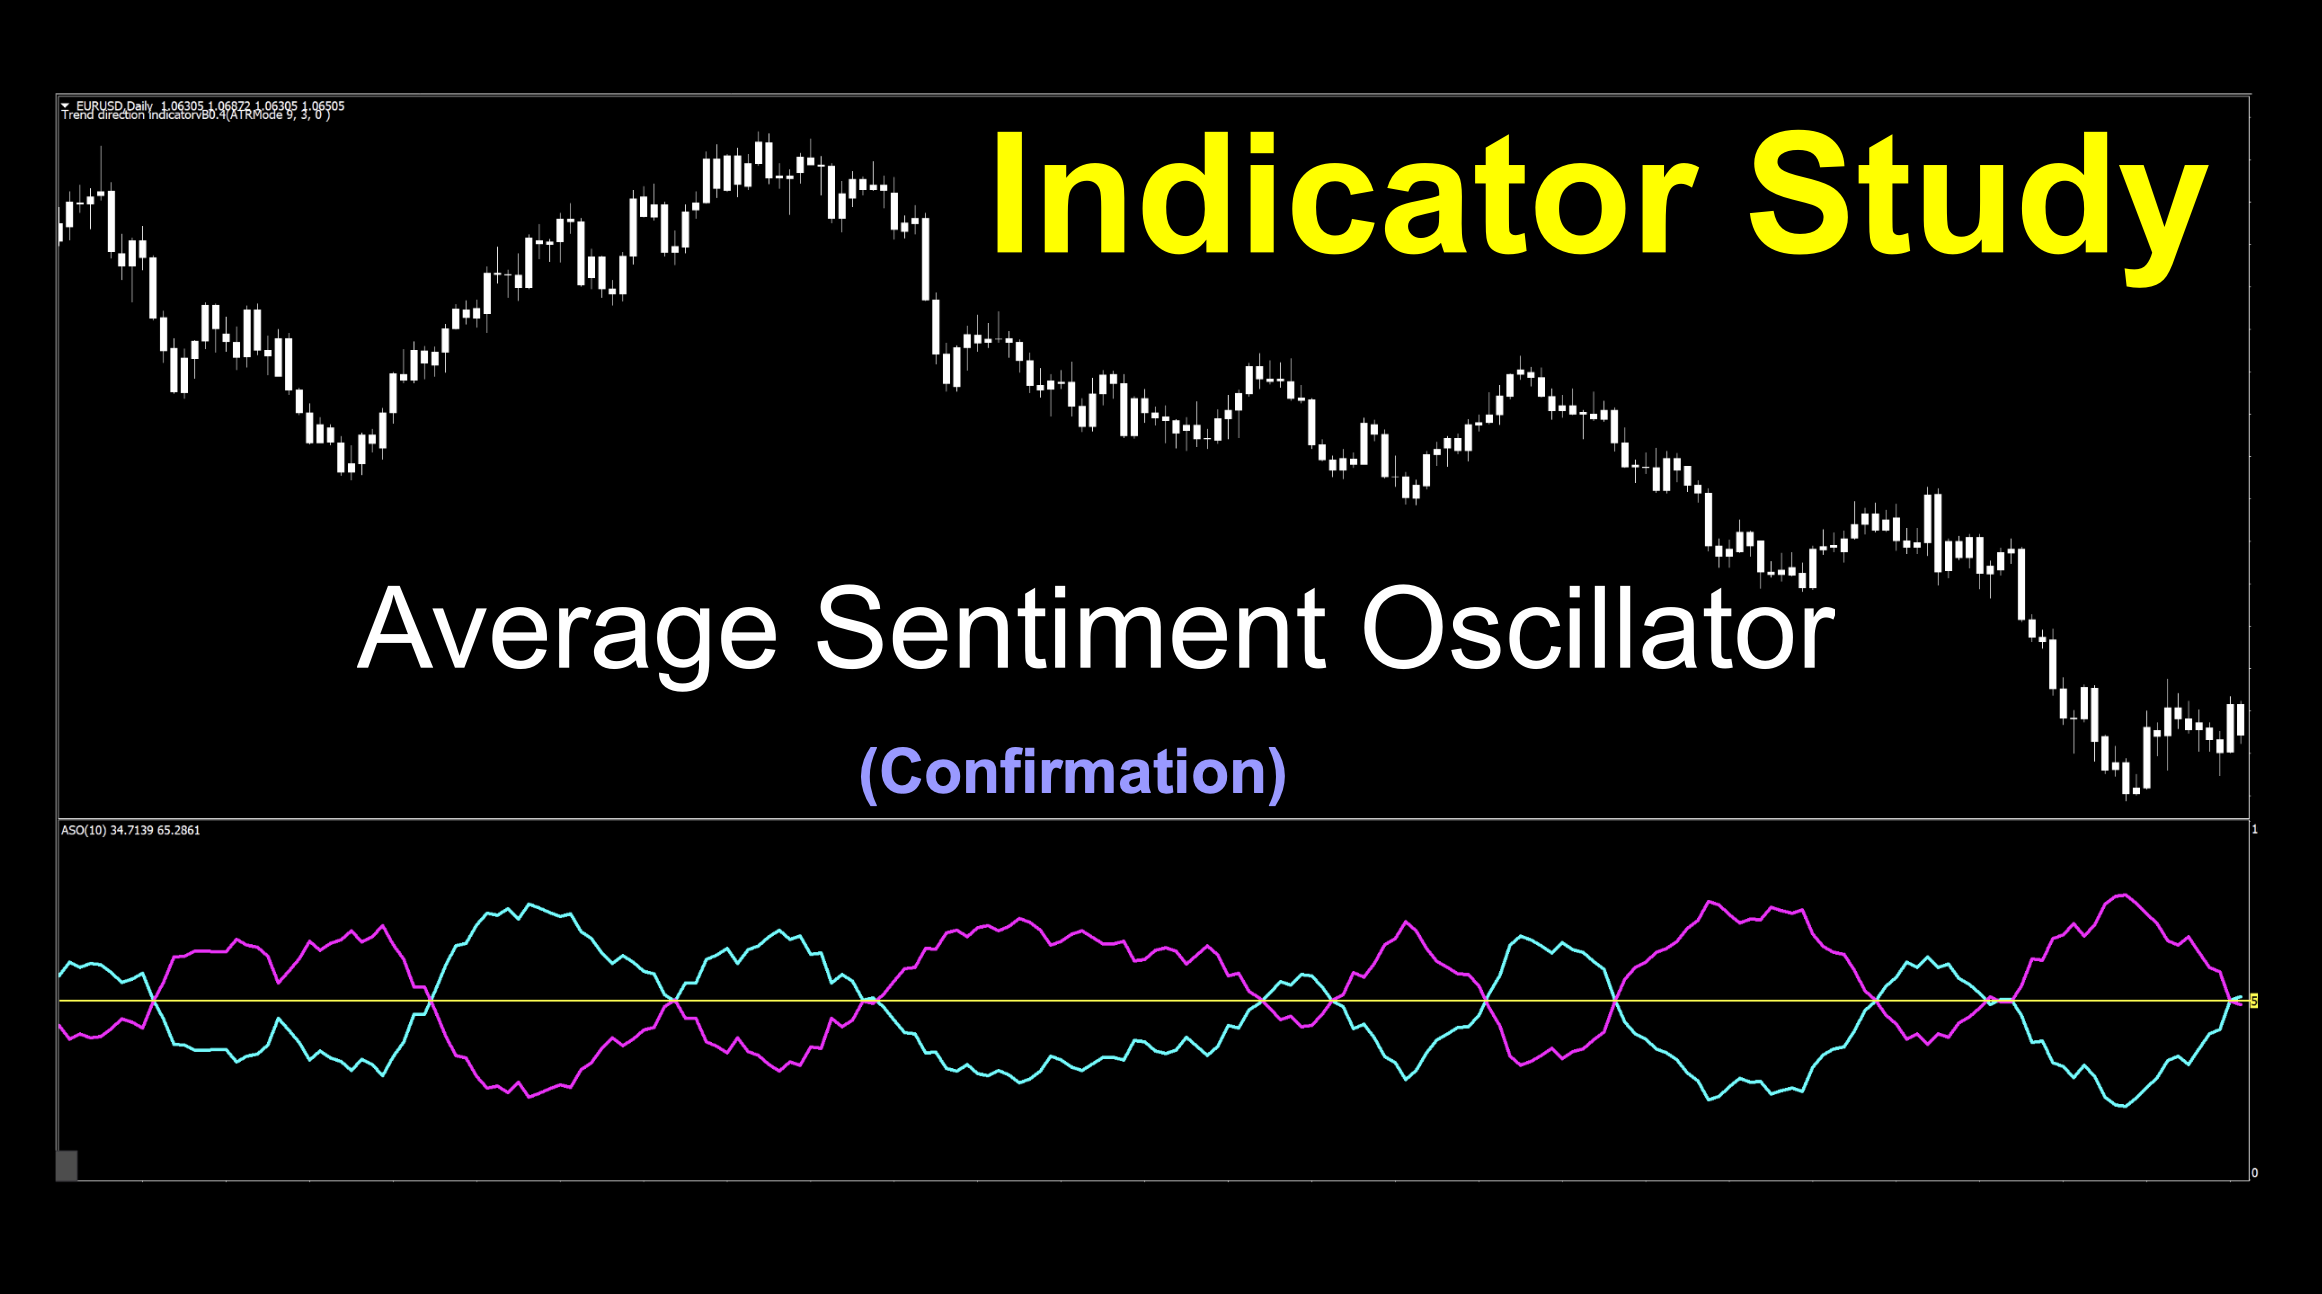
Average Sentiment Oscillator If you’d like to follow along with the e-book version of the blog, click on the play button in the audio player below (at the bottom of the page). Sentimentally Average When it comes to sentiment, we don’t advocate emotionalism when trading. So, when we saw the title of this indicator, we … Read more