
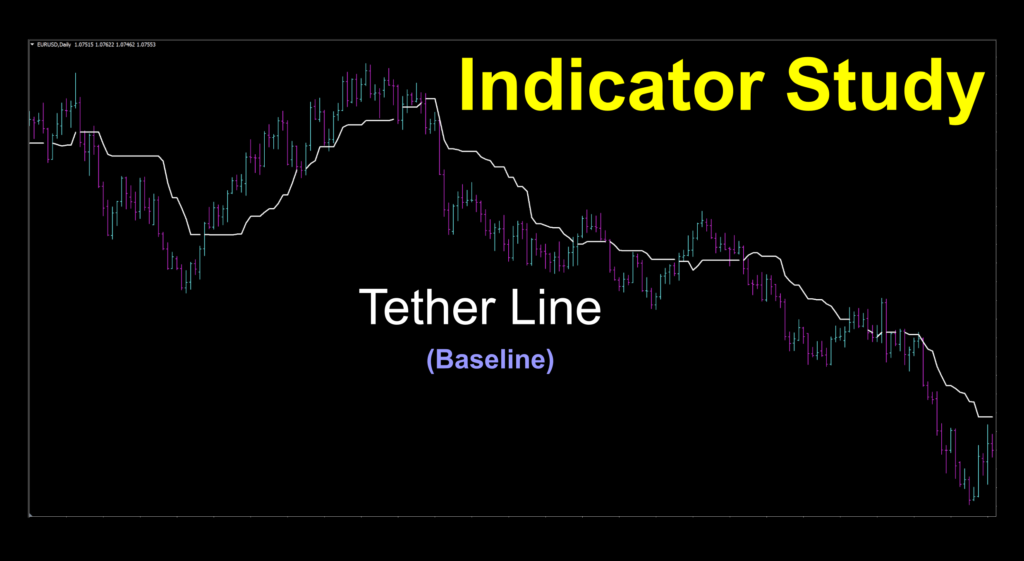
Tether Line
If you’d like to follow along with the e-book version of the blog, click on the play button in the audio player below (at the bottom of the page).
Don’t Tether Yourself
Strange word. “Tether”. Say it ten times fast and it just sounds like noise. What does it mean to us? At first blush, it sounds like getting tethered to something is a bad thing. But not in our world. When we look closer at this week’s profiled indicator, tether becomes something helpful. Although, the first image that came to mind when I saw this indicator’s title was more in line with the photo below. Anybody else get this too? Getting whacked in the back of the head if you’re too slow wasn’t fun, either. Good times.
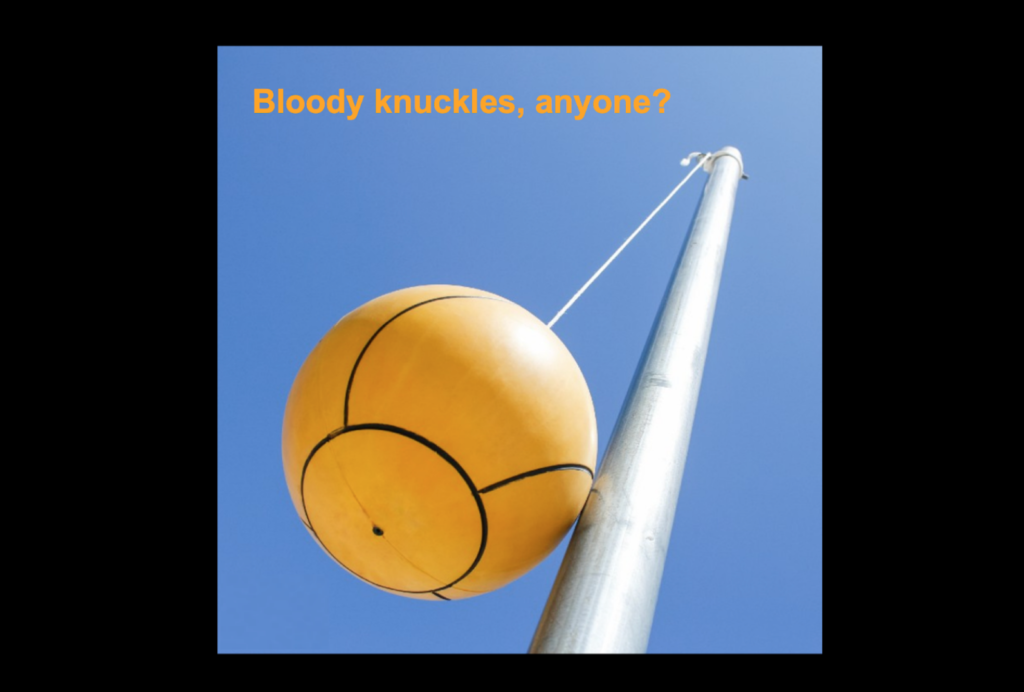
School Yard Shuffle
We initially left this indicator on its default settings, but after a few minutes of observation, decided to speed it up for better signals by changing the default value to something a little shorter. After all, who wants to watch grass grow, or paint dry. Is it a crime? Never. That’s the beauty of what we do. We don’t leave things alone. We’re always looking for a better way, an easier way to do things. That being said, sit back and watch this pretty little thing do what it was designed to do. Once you’ve consumed all the material, feel free to download the indicator and give it a whirl yourself.
Thank Yew
A quick “thank you” to our friends who emailed us this week. We received some really outstanding ideas for indicator profiling. VP and I continue to look at each one for future consideration. Don’t stop. Send your superlative suggestions to stonehillindicator@gmail.com, and as always, thank you for helping others in the processes.
Tie it Up With a bow
There wasn’t much background on this indicator, but we believe it was created in 2020 by a coder who chose to remain unnamed. That’s totally fine by us. We always like to give credit where credit is due, but if privacy was a thing for this person, then so be it. This indicator is based on a customized moving average, but it does a nice job of keeping up with market changes. It doesn’t have the appearance of a typical moving average curve but rather, appears a bit jagged to stay in line with change in price. We had to make a few visual changes, and we’ll talk about that in the next section.
Color Vision
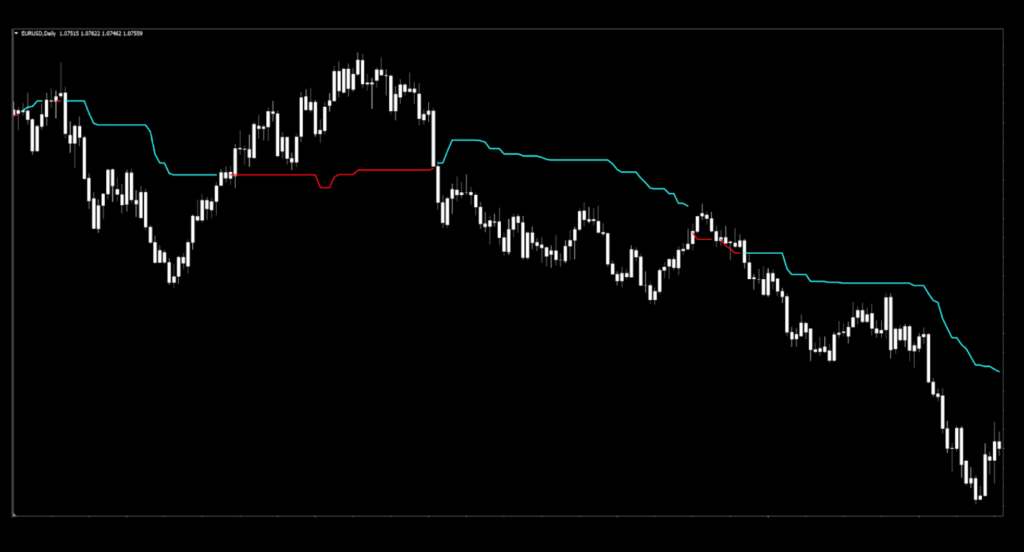
The original appearance of this indicator was a color change baseline. After close examination, we found that removing the colors altogether made it somewhat easier to use. However, you can certainly use the colors if it makes it easier for you. We’ll post the original colors on white candles and then an alternative view for the analysis portion.
Color Blind
We made a few changes…
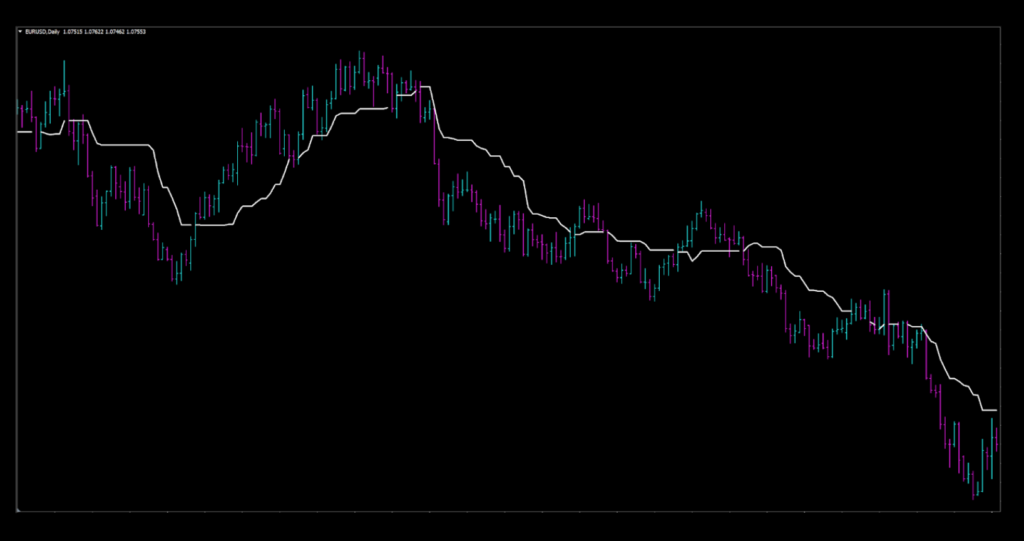
First, we changed the blue/red signal line to white.
Second, we shortened the length setting to create additional signals.
And third, we changed the white candles to old school red/blue bars.
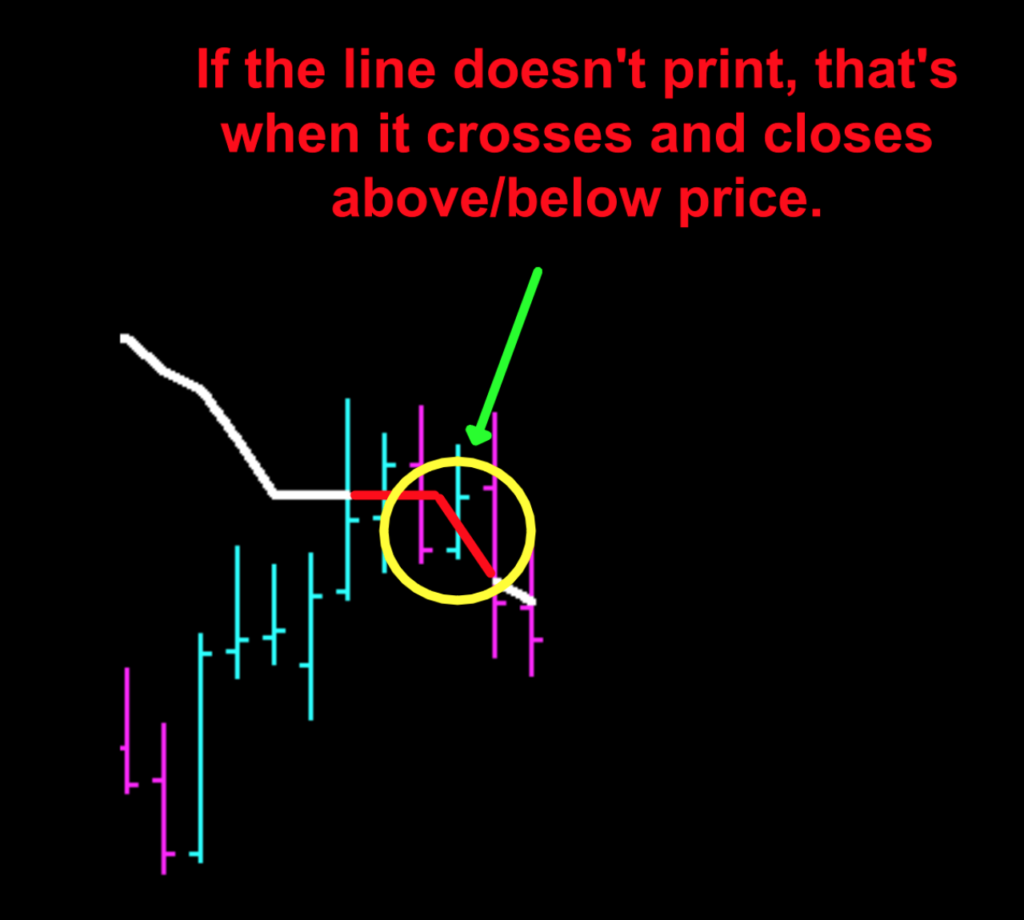
But Why, Sir?
You may be wondering why we did this. We have a good reason. The reason, is that this indicator does not display a signal line when it crosses price, as noted in the gaps. We have a close up for you to see before going into the signal identification. We colored in the gaps with a red line to better illustrate what’s missing.
Settings
There is only one lone setting, and we use the heck out of it.
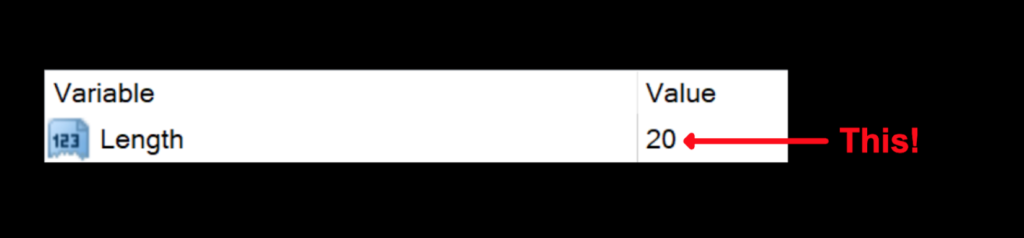
Length: The one and only setting which dictates the number of periods for the internal calculations. The default value is 55.
Advantages
* Super easy to test.
* Can make a good exit indicator.
* Reacts quickly to market change.
How we use it.
This is specific to the NNFX system. There are three possible trade actions;
OPENING A TRADE
CLOSING A TRADE
MAINTAINING A TRADE
One of these three actions needs to happen in the last 30 minutes prior to the close. This is when you make your trading decisions, and not actually wait for the close at 1700 EST, because we trade on the daily time frame.
Long signal: When price crosses above the signal line. Entry is in the last 30 minutes of the trading day
Short signal: When price crosses below the signal line. Entry is in the last 30 minutes of the trading day.
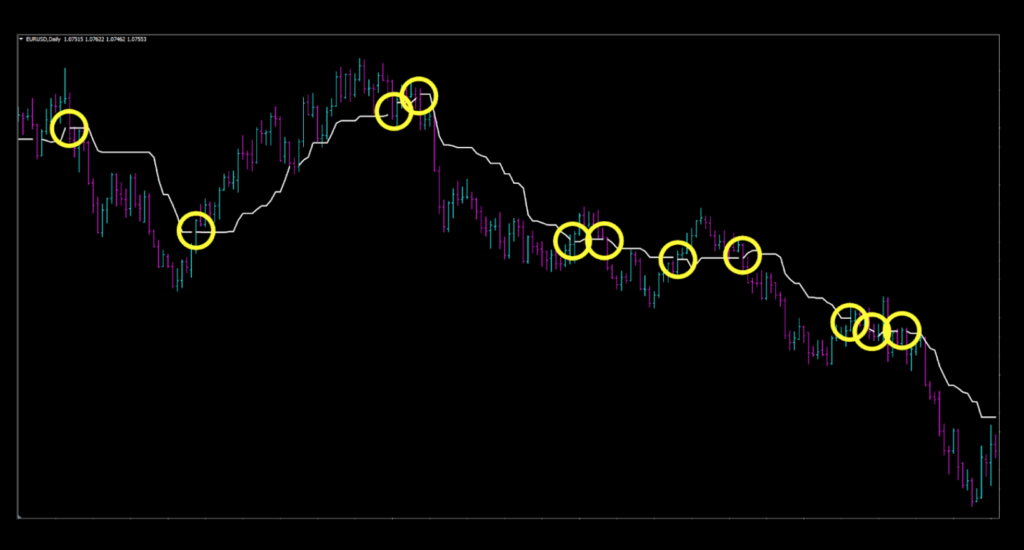
Alright, Alright, Alright…
In our mark-up, the randomly selected setting produced some pretty decent signals. There were the usual suspects where the rest of your algorithm would have hopefully kept you out of a trade, especially in the short/long/short instances, but overall, not bad at all. I’d buy that for a dollar.
Testing Has Commenced
If you’re new to these studies, we recommend looking at some of the older blogs to understand how we conduct our testing.
The six pairs we recommend testing are…
EUR/USD
AUD/NZD
EUR/GBP
AUD/CAD
CHF/JPY
CAD/SGD
The markets we test our indicators are the:
EUR/USD (Euro/US Dollar)
BTC/USD (Bitcoin/US Dollar)
XAU/USD (Gold/US Dollar)
SPX500 (S&P500 Index)
Timeframes and Results
We’ll run the Tether Line indicator on the EUR/USD, BTC/USD, XAU/USD, and the SPX500 using the default and tweaked settings across the daily and 4-hour timeframes on the MT4 strategy tester.
We focus on three metrics;
Total trades
Win/Loss ratio
ROI (return on investment)
Results For Your Review
Below are the results from our testing endeavors.
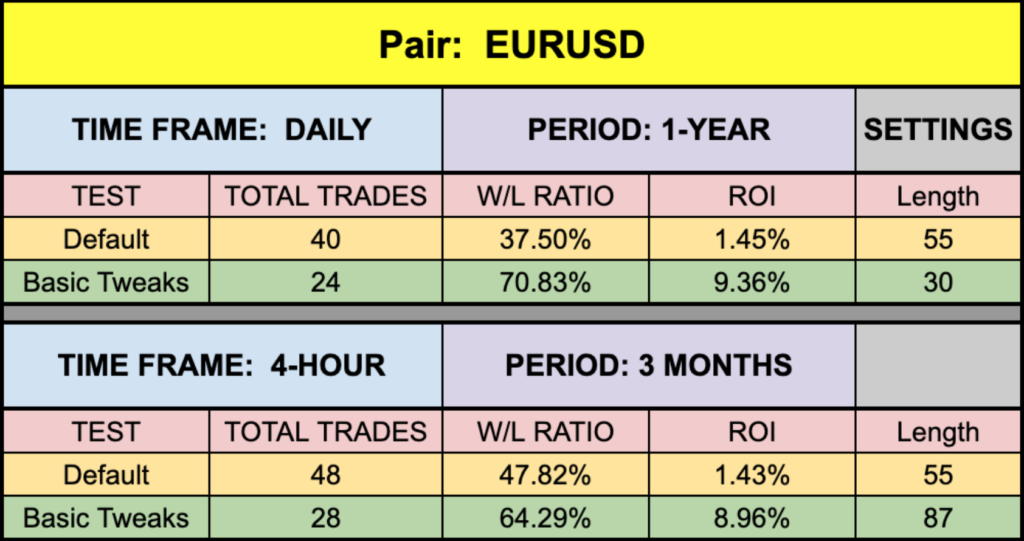
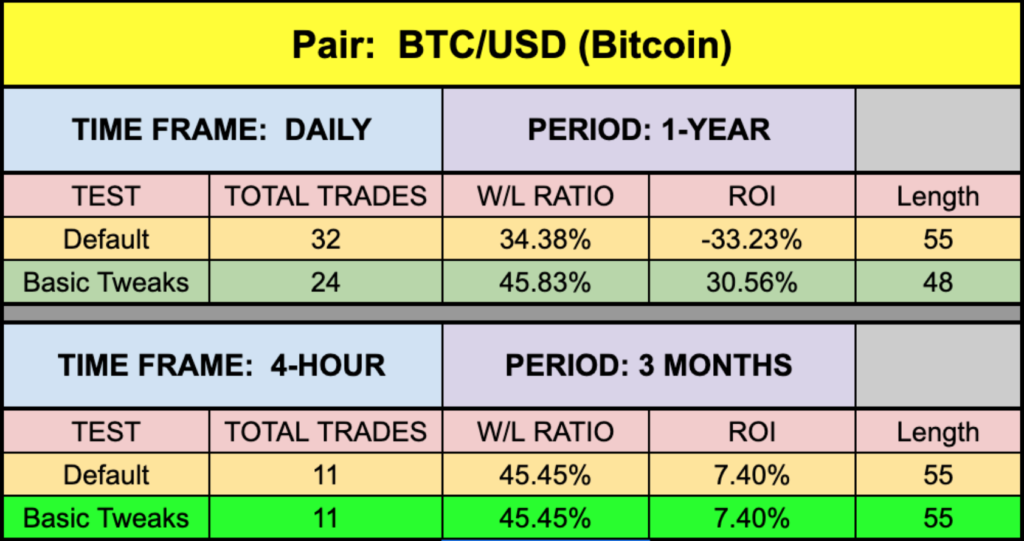
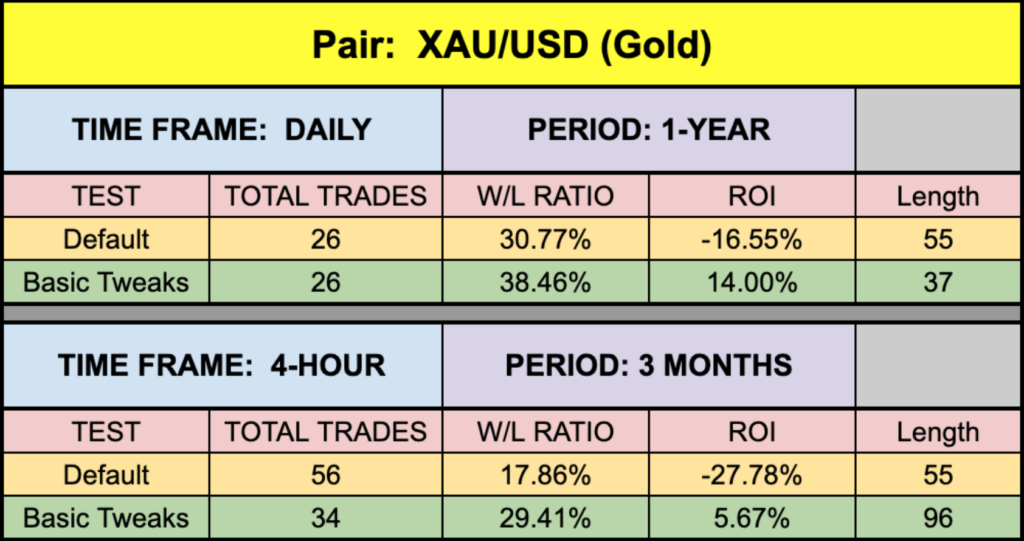
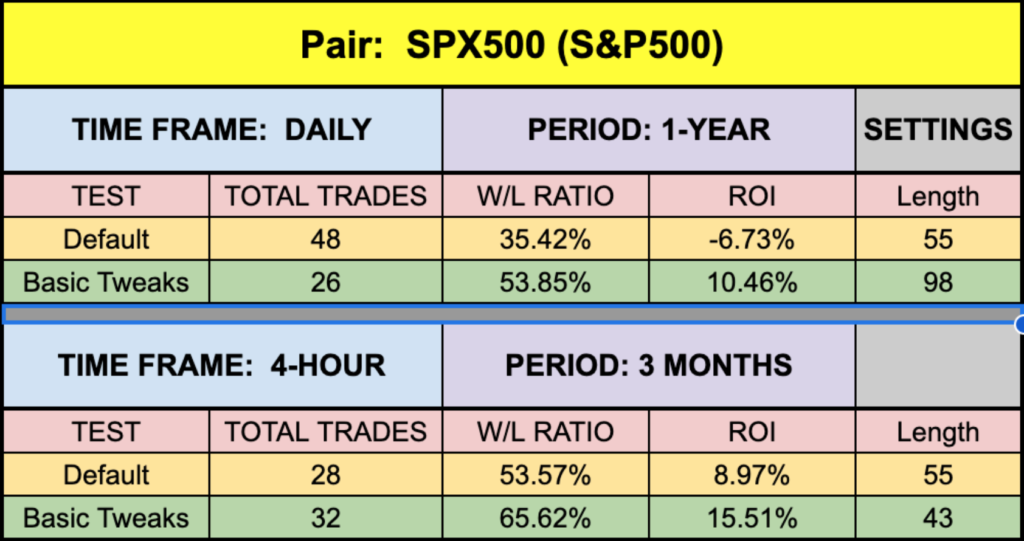
Equal Opportunities
We discovered that on occasion, longer length was better in some instances, so that tells us quicker is not always the best…good to know. In all instances, we were able to find better settings except the 4-hour BTC where the default was the best, which, of course, is very reassuring when testing through the markets.
Money Management
Money management is based on the NNFX risk profile. That information can be learned in the Advanced Course.
Resources
We’ve made the Tether Line indicator available for download on our site from the indicator library, for free. When you’re ready to get it, click HERE.
We’re Here For You
Make sure you’re signed up for the latest digests. If you missed last month’s, email us at dan@stonehillforex.com with the title “Latest Digest Please” and we’ll send it off to you within 24 hours
Other Resources
And you’ll want to subscribe to our YouTube channel for the technical analysis videos which pair well with these blogs…like vanilla ice cream and chocolate fudge. Don’t forget Facebook and Quora, where we answer questions relating to Forex.
Our only goal is to make you a better trader.
BTW – Any information communicated by Stonehill Forex Limited is solely for educational purposes. The information contained within the courses and on the website neither constitutes investment advice nor a general recommendation on investments. It is not intended to be and should not be interpreted as investment advice or a general recommendation on investment. Any person who places trades, orders or makes other types of trades and investments etc. is responsible for their own investment decisions and does so at their own risk. It is recommended that any person taking investment decisions consults with an independent financial advisor. Stonehill Forex Limited training courses and blogs are for educational purposes only, not a financial advisory service, and does not give financial advice or make general recommendations on investment.