
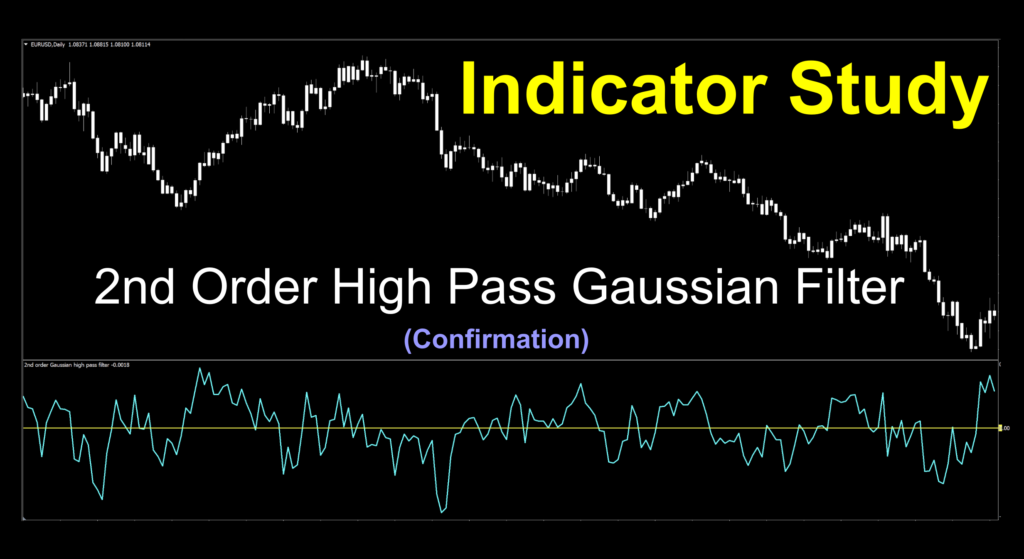
2nd Order High Pass Gaussian Filter
If you’d like to follow along with the e-book version of the blog, click on the play button in the audio player below (at the bottom of the page).
Another Really Long Name
It comes across as somewhat pretentious, but these last couple of indicators have such long, important sounding names. Remember last week’s?
 This week should have a little crown, or at least a party hat. So much nobility in a handful of words. While some indicators do have noble beginnings, we’ll find out if this one can join that particular party. This week’s indicator is a little out of “left field” and has a profound history to boot, but those are the ones we like. Let’s get ready to rumble…
Seeing Double
When we started looking at the indicator on different timeframes and different settings, we realized that for us to create a useful video, we would have to depart from our usual affair. That being the case, we made the video on the 5-minute chart instead of the 1-minute chart to give us better signals for analysis. It’s not a big deal, it just “showed” better for analysis. Since we actually trade on the daily time frame, it’s not something that should raise a lot of concern. Roll with us…
Don’t You Forget About Me
Don’t forget to keep sending us emails. We have a bucket full of indicators to go through, but we’ll never turn anything away. We’re thinking of profiling another user suggested indicator very soon…will it be yours? Don’t be embarrassed when deciding if we’ll appreciate that weird, oddball indicator that you found on some long defunct or crusty old site. We want to see it! Send those glorious ideas to stonehillindicator@gmail.com, and as always, thanks for keeping us and your trader friends in mind.
Filter Coffee, So Smooth
We have researched, tested and profiled indicators in the past which employed the use of filters. They can be very helpful when removing some of the background noise of the market. We’re hoping this one has the same abilities. This week’s below chart zero cross confirmation oddball is called the 2nd Order High Pass Gaussian Filter and was coded in 2022 by an MT4 coder. We’ll talk a bit about what all the fuss is and see how it did for us.
Does Your Gaussian Function?
The first thing we need to do is define what a Gaussian function is. Before we dig into the finer points, let’s get the math out of the way for our mathy people.
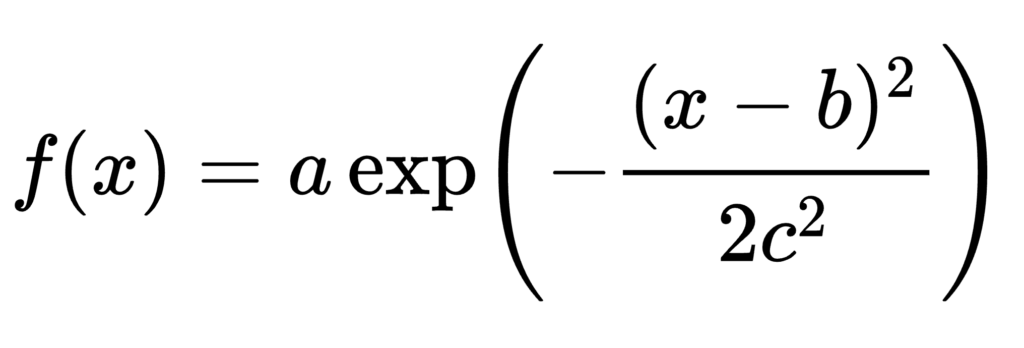
There is an entire Wikipedia article dedicated to discussing the finer points of the function’s integral calculus and derivatives, but for our purposes, we’ll just kind of run with it and enjoy the signal line it creates.
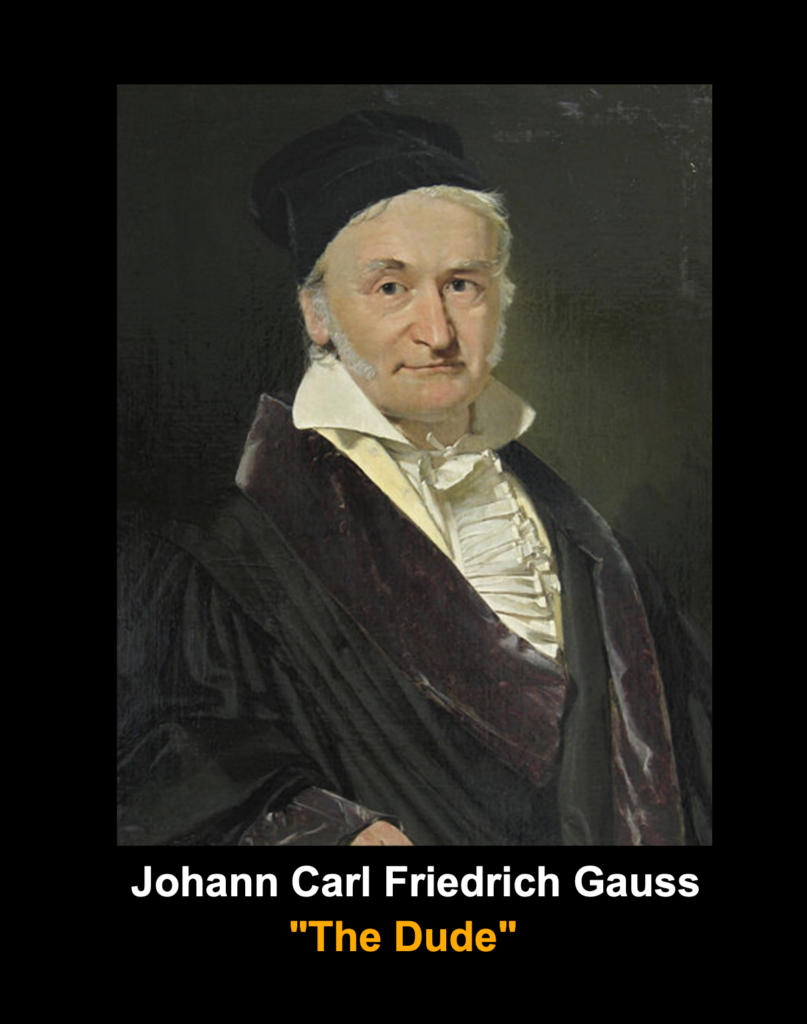
Who’s The Dude?
The Gaussian Filter was the brainchild of Johann Carl Friedrich Gauss; a German mathematician, geodesist, and physicist who was a tenant of this planet from 1777 until 1855.
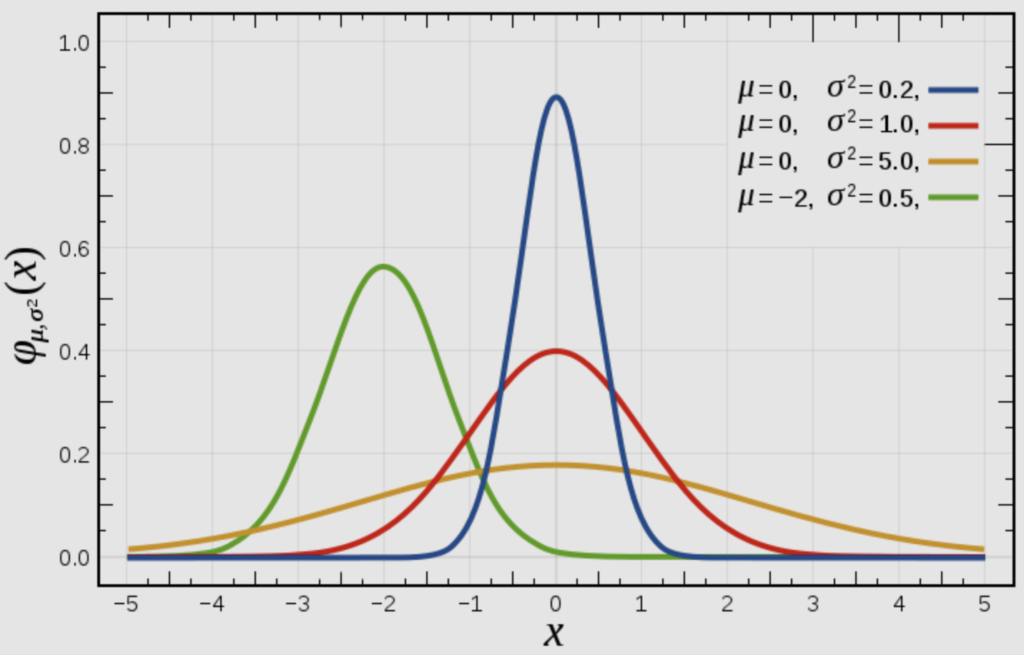
Cool…What Does the Gaussian Look Like?
Now comes the part where most of you will have that “a-ha” moment of recognition. That function is used to create a very specific geometric shape from a supplied data set. That shape is called; the bell curve. And…I hear the collective “a-ha” coming from the ether. Told ya!
War Story
Some people have a “bell curve” story, usually involving an incident with the classroom. If you bear with me for just a moment, I’ll tell you the one that has stuck with me for decades. I was a student in an engineering class a long time ago where the teacher was exceptionally intelligent…and most of us were a bunch of sophomoric knuckleheads. We all took a test and scored so poorly that the highest score was a dismal 29%. The professor was actually laughing as he displayed our scores as a bell curve on the screen. It kind of looked like this.
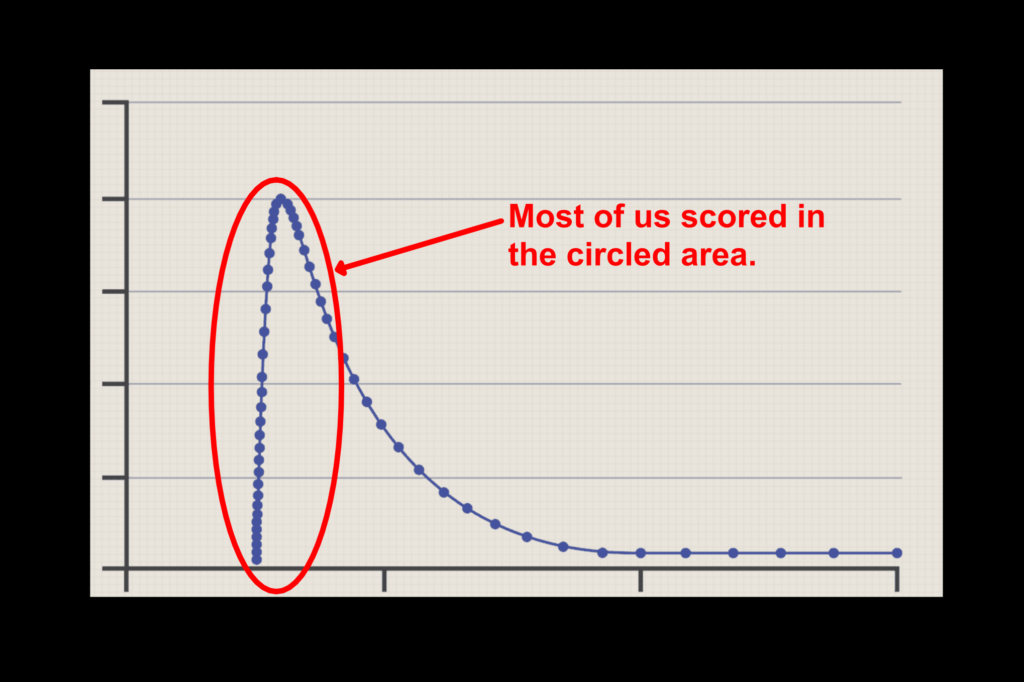
He called it an “assymetrical bell curve” as he continued to chuckle. I think he gave us 20% just for writing our names, hence the data points were not at zero. We just rolled our eyes and hoped we didn’t fail the class. Okay, where was I?
Second Time Around
Now that we’ve established the business of what this indicator is predicated upon, let’s get into the 2nd Order portion. Below is a picture of the first order and 2nd Order images of a data set. See what you can see for a moment and think of how it might translate into interpreting price data into a signal line for our use.
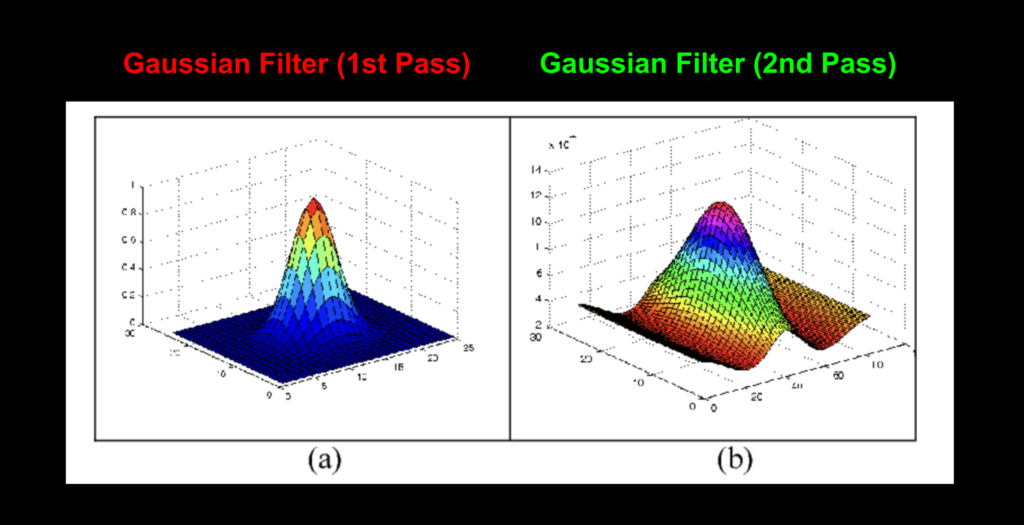
Do you see it? The second image is “smoothed” with respect to gradient and transition between colors and the overall shape. That’s what it does with price to create the signal line. The Second Order filters data for smoother signals. We like smooth.
One more thing
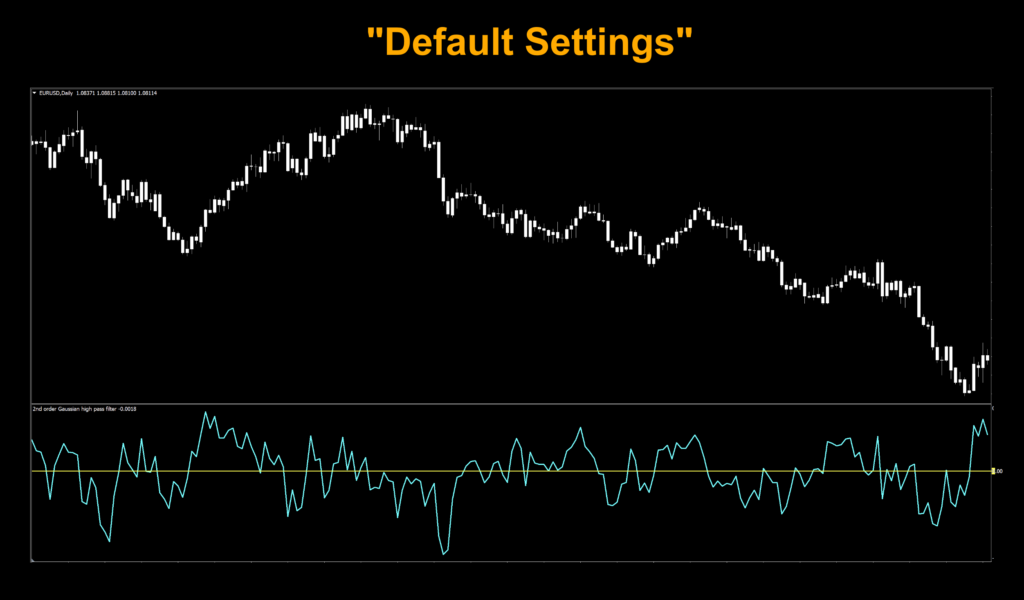
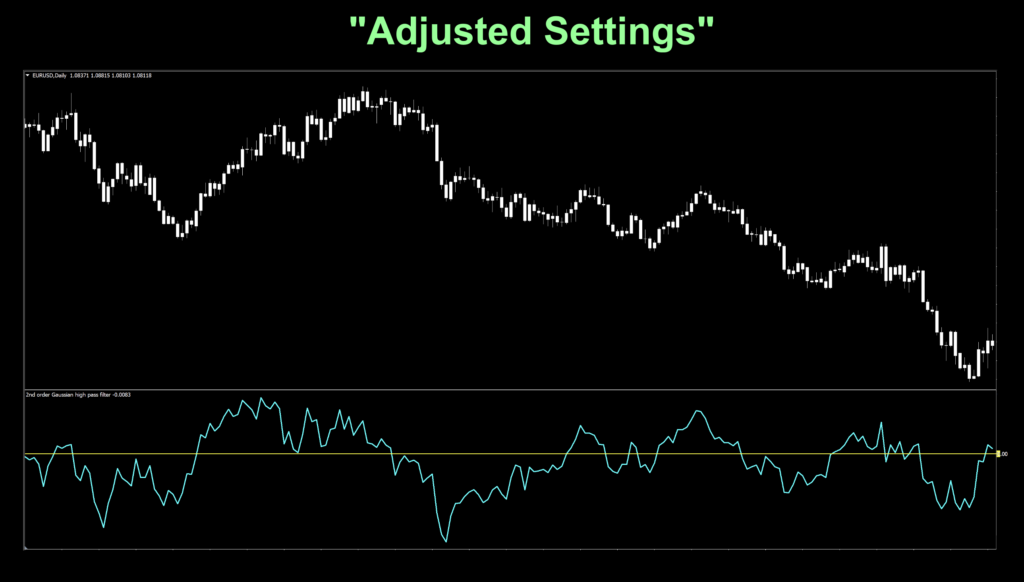
When VP and I first examined the chart during the research portion of the blog, we both agreed that the default settings would make for a difficult example to dissect and discuss. So, we made an arbitrary change to the settings for a better representation. Is that “cheating”? That would be definite, “no”. Remember, many indicators don’t necessarily perform great on their default settings in a random chart because of market behavior. Remember, we don’t cherry pick. Our objective is to demonstrate they can be made better, so that’s what we did. We made it better to exhibit what it can do for you.
Default and Adjusted Views For You to Adore
We’re going to post the default view with a few minor adjustments, so you know what to expect when you first load it up. We think it’ll be self-explanatory. To better see the indicator, we changed it to a brighter aqua color, thickened up the line, and added a zero line in yellow.
Now, we’re going to just change one of the settings to help with visuals…like this.
Settings
There are a few settings, but only two which you’ll need to be concerned with.
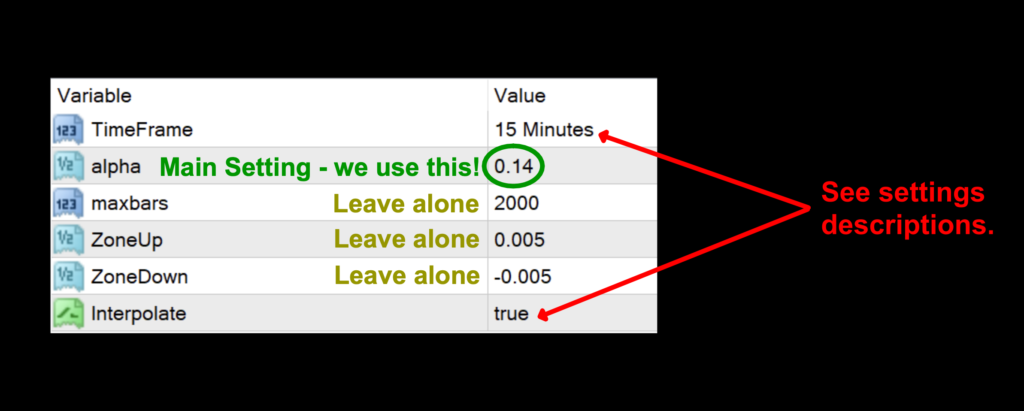
TimeFrame: This value specifies which time frame chart you’re currently using. You can leave it on the 15M chart as long as the bottom value “Interpolate” is toggled to TRUE – which tells the indicator that no matter what you have in TimeFrame, the indicator will recognize whatever timeframe chart you’re in. The default value is 15 minute, which is fine, just make sure the bottom setting is TRUE.
alpha: The main setting for the calculations. The default value is 0.14.
Interpolate: Toggles the multi time frame function, whereby the indicator knows what chart (the current chart) you’re working from. The default value is true.
Advantages
* Old, high level math with centuries of applied usage.
* Easy to test, only one setting
* Reacts quickly to change in price.
How we use it
We want to clarify something specific to the NNFX system. There are three possible trade actions;
OPENING A TRADE
CLOSING A TRADE
MAINTAINING A TRADE
One of these three actions need to happen in the last 30 minutes prior to the close. This is when you make your trading decisions, and not actually wait for the close at 1700 EST, because we trade on the daily time frame.
Long signal: When the signal line crosses above the zero line. Entry is in the last 30 minutes of the trading day.
Short signal: When the signal line crosses below the zero line. Entry is in the last 30 minutes of the trading day.
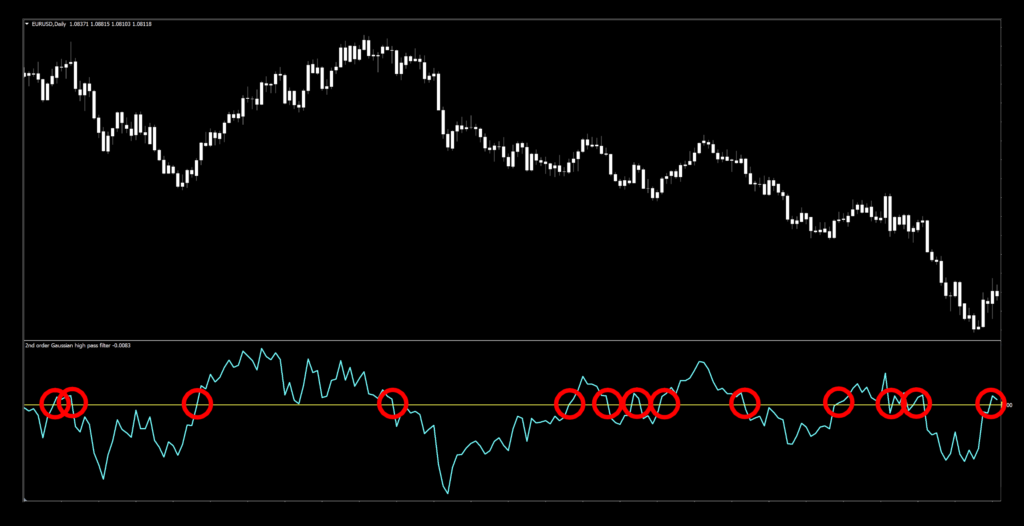
Filtered Signals
We’re looking at the adjusted settings for the mark-up. There are definitely advantages to slowing the signal down a bit for easier signal identification. As usual, we can see a few areas of congestion where other parts of your algorithm would have kept you out of some trades. Exactly what we want.
We’re Going Testing
If you’re new to these studies, we recommend looking at some of the older blogs to understand how we conduct our testing.
The six pairs we recommend testing are…
EUR/USD
AUD/NZD
EUR/GBP
AUD/CAD
CHF/JPY
CAD/SGD
The markets we test our indicators are the:
EUR/USD (Euro/US Dollar)
BTC/USD (Bitcoin/US Dollar)
XAU/USD (Gold/US Dollar)
SPX500 (S&P500 Index)
Timeframes and Results
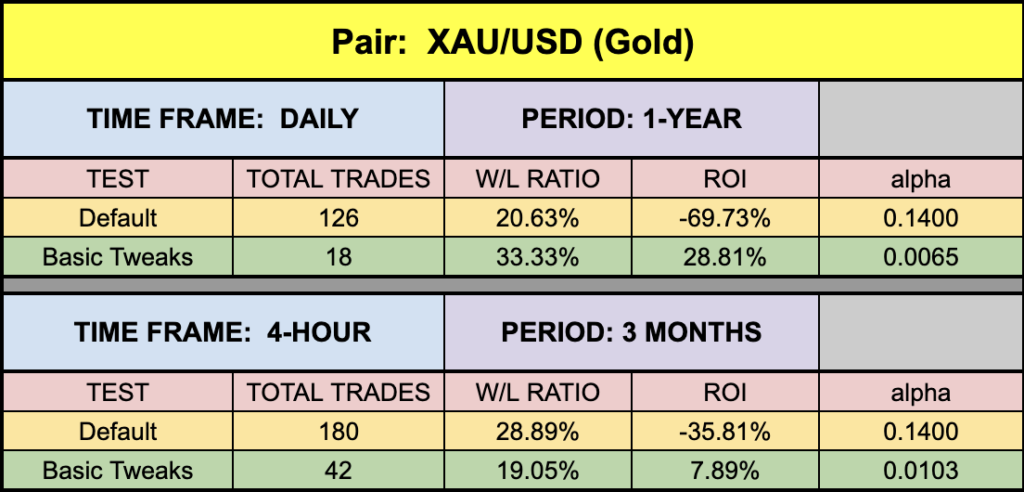
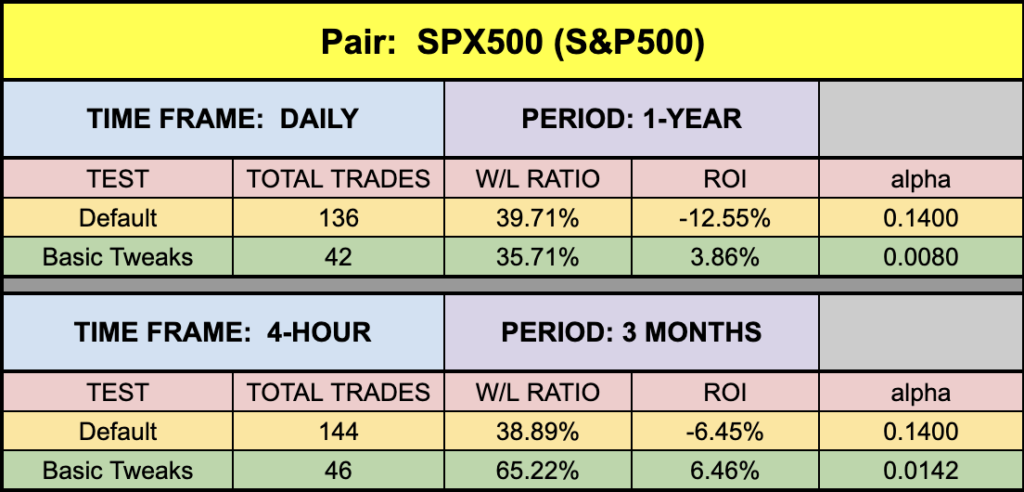
We’ll run the 2nd Order High Pass Gaussian Filter indicator on the EUR/USD, BTC/USD, XAU/USD, and the SPX500 using the default and tweaked settings across the daily and 4-hour timeframes on the MT4 strategy tester.
We focus on three metrics;
Total trades
Win/Loss ratio
ROI (return on investment)
Results For Your Review
Below are the results from our testing adventures.
Signalmania
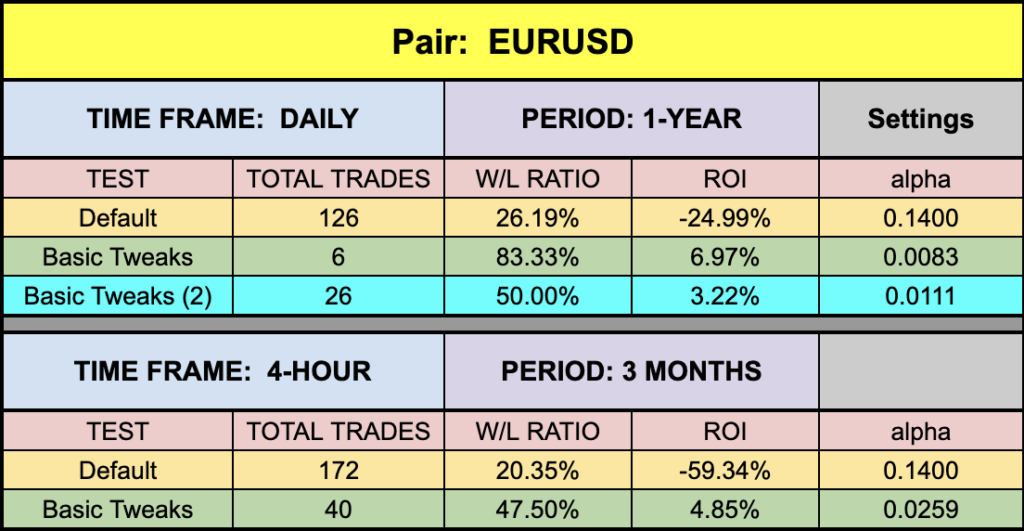
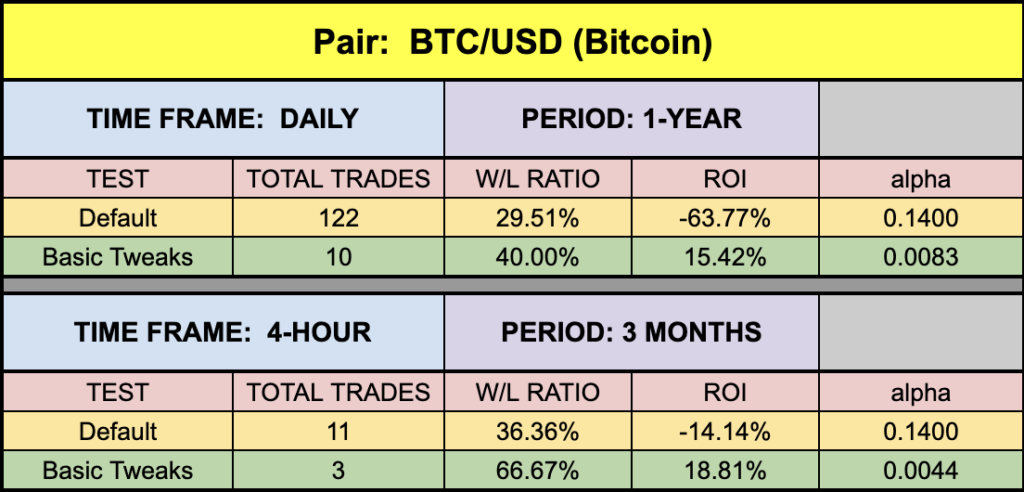
Is that a word? It should be…at least in our world. I’m sure the first thing you noticed is the ridiculous amount of signals using the default settings. This is the reason why we slowed down the indicator for the video and for the mark up analyses. Once we got it under control, it did okay in a few markets and pretty darn good in others.
I Need a Euro
The one thing you’ll notice in the EUR/USD testing sheet is the additional data set in a pretty aqua blue. We wanted to mention that there are trade-offs which you must take into consideration when tweaking indicators. The first tweak yielded a higher ROI and W/L percentages, but fewer trades. We also included a second set of tweaked setting which would have netted less ROI and W/L percentages, but more trades.
Pondering on the Edge of Tomorrow
Since we live in a world of numbers, this is something you’ll want to think about when testing your algorithm. Naturally, other components in your algorithm are going to change your overall returns, but nevertheless, you should be aware that various metric combinations exist, depending on your individual goals. VP is going to address this in the profile video.
Money Management
Money management is based on the NNFX risk profile. That information can be learned in the Advanced Course.
Resources
We’ve made the 2nd Order High Pass Gaussian Filter indicator available for download on our site from the indicator library, for free. When you’re ready to get it, click HERE.
We’re Here For You
Make sure you’re signed up for the latest digests. We just put out a digest last week, so if you’d like to see what we discussed, email dan@stonehillforex.com with the title “Latest Digest Please” and we’ll send it off to you within 24 hours.
Other Resources
And you’ll want to subscribe to our YouTube channel for the technical analysis videos which pair well with these blogs…like cheese and fine wine. Don’t forget Facebook and Quora, where we answer questions relating to Forex.
Our only goal is to make you a better trader.
BTW – Any information communicated by Stonehill Forex Limited is solely for educational purposes. The information contained within the courses and on the website neither constitutes investment advice nor a general recommendation on investments. It is not intended to be and should not be interpreted as investment advice or a general recommendation on investment. Any person who places trades, orders or makes other types of trades and investments etc. is responsible for their own investment decisions and does so at their own risk. It is recommended that any person taking investment decisions consults with an independent financial advisor. Stonehill Forex Limited training courses and blogs are for educational purposes only, not a financial advisory service, and does not give financial advice or make general recommendations on investment.