Another One
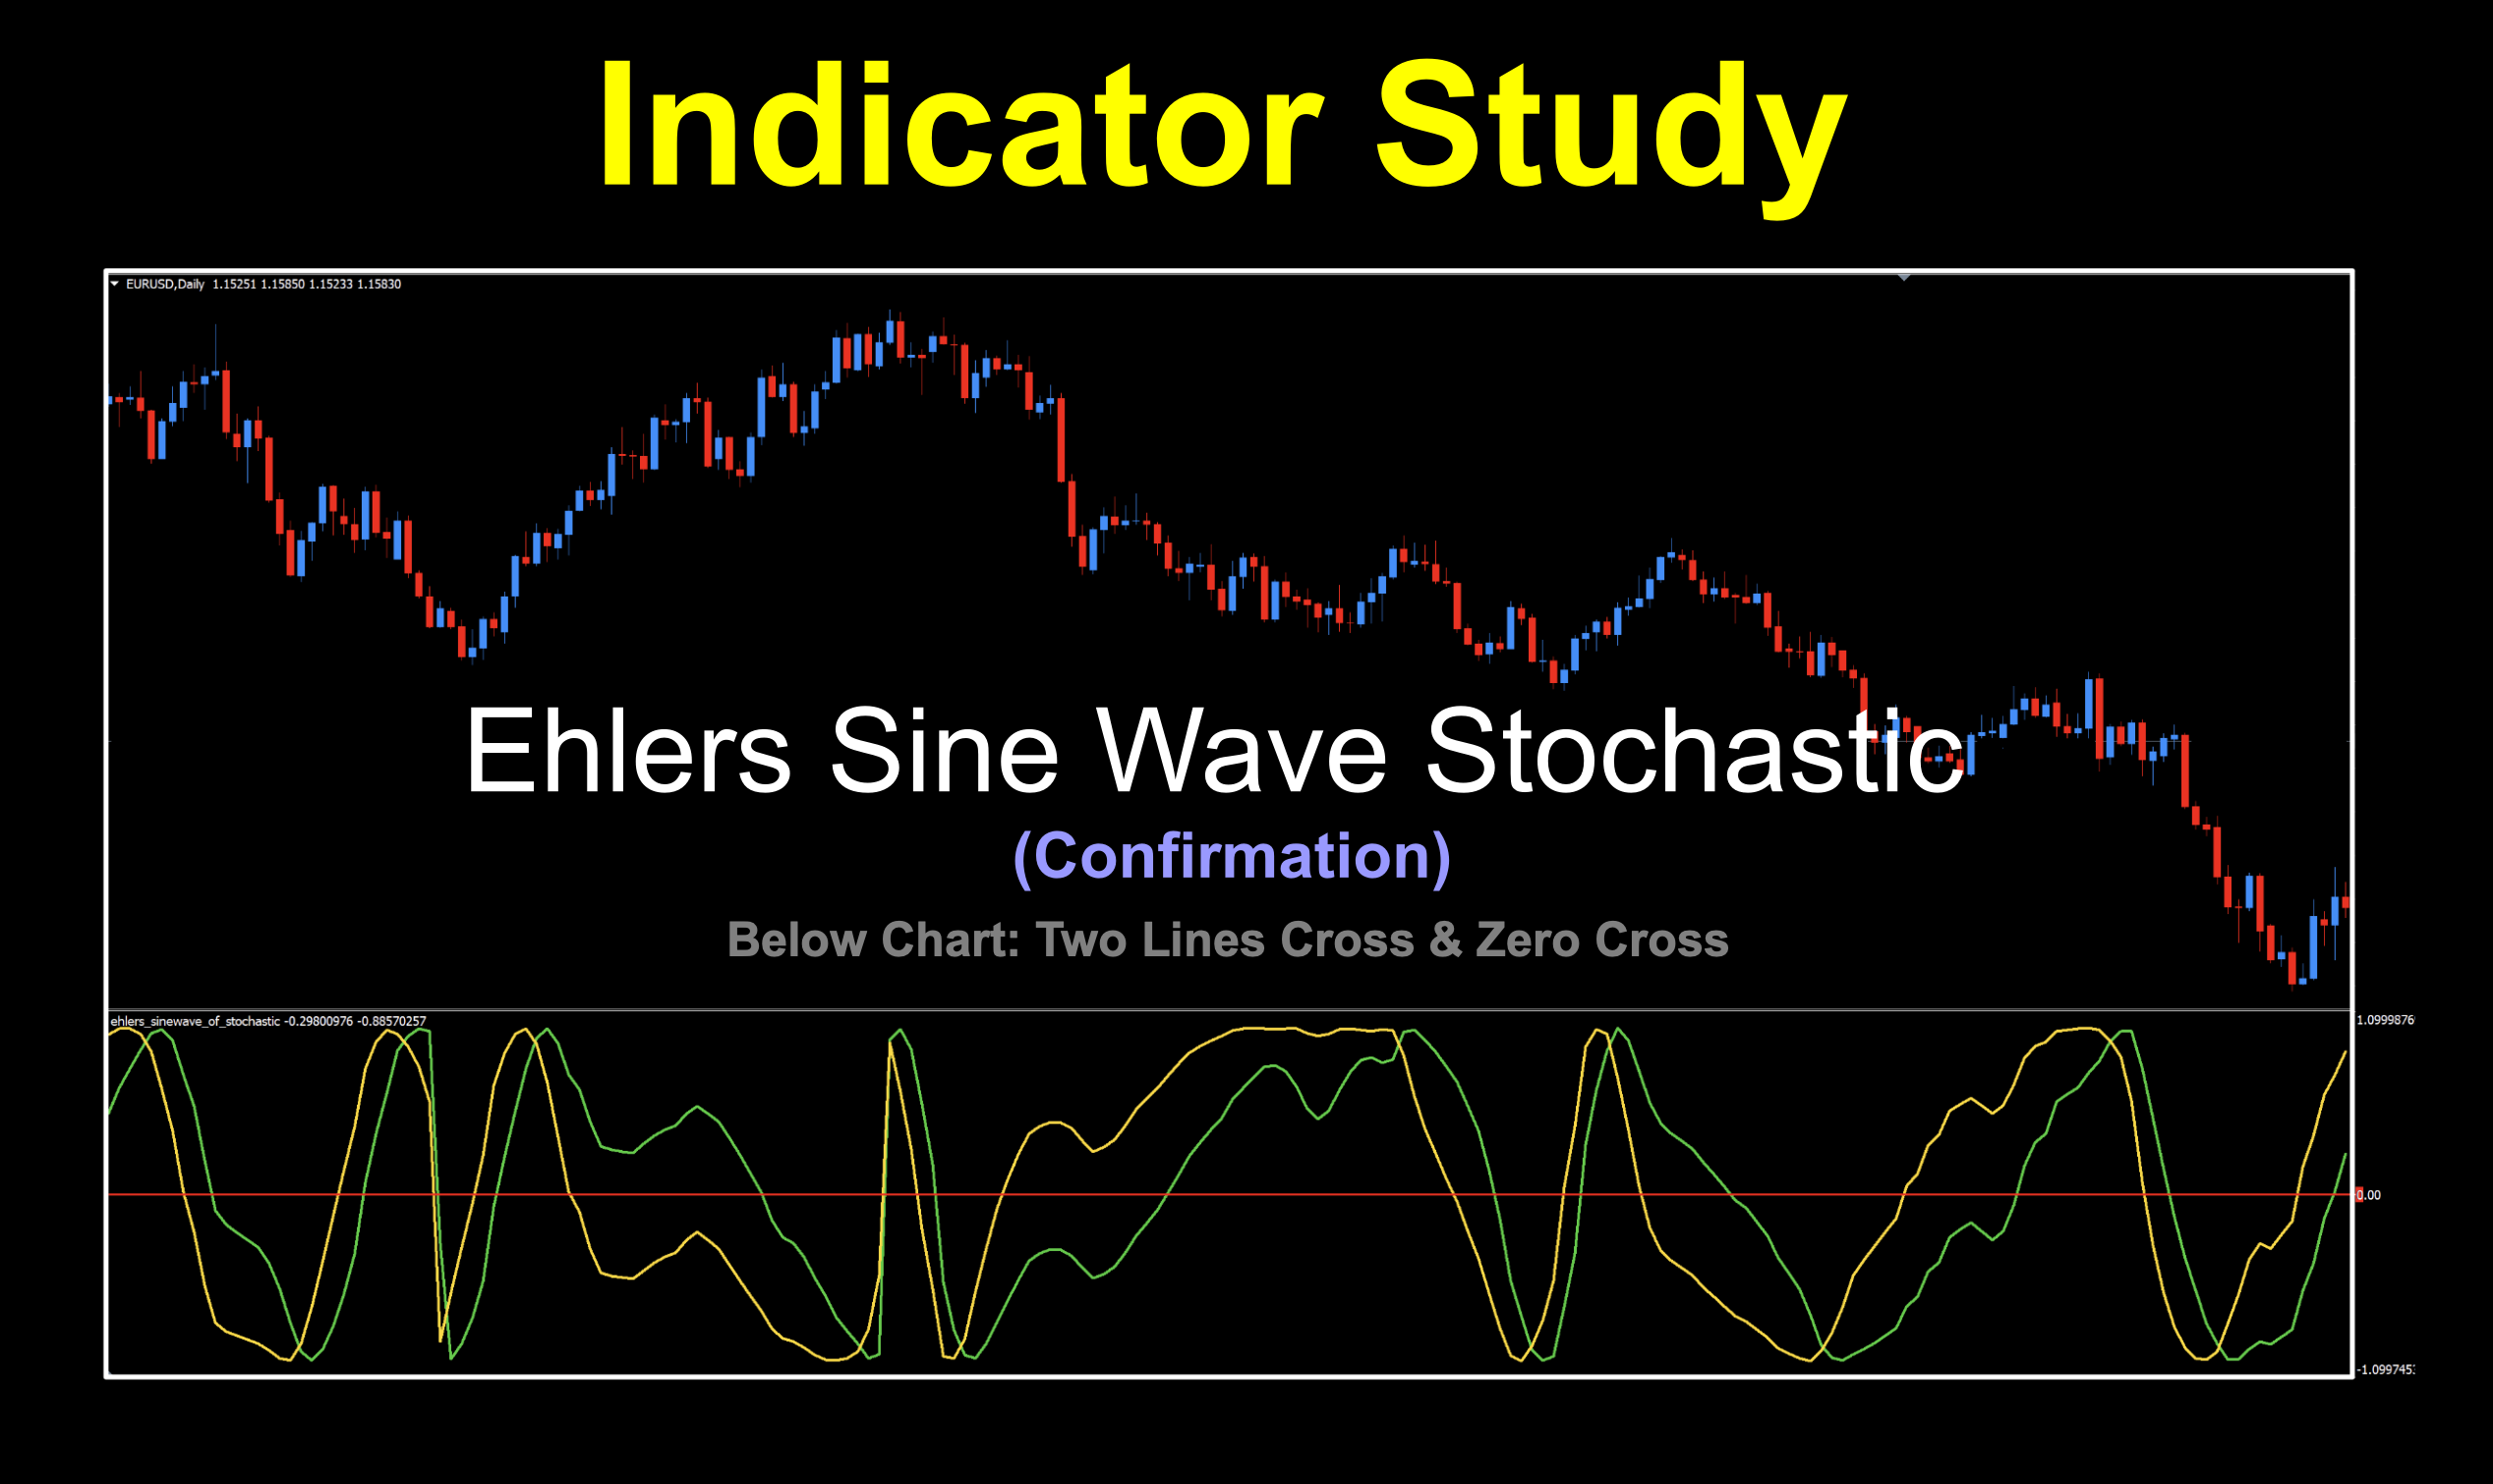
Who says more of a good thing is too much? Not us. Especially if it’s from the guy we all love…the amazing Mr. John Ehlers. But, this one is kind of different. It looks a bit strange, and actually can be used two different ways with decent results on both of them. Come let’s take a look.
A Different Kind of Stochastic
Every now and then, we run across an indicator that makes us stop and say, “Okay…that’s interesting.” The Ehlers Sine Wave Stochastic is one of those indicators. At first glance, it looks like another oscillator. You’ve got two lines moving around a centerline, and, naturally, the first thing that comes to mind is the usual stochastic interpretation. But that’s not really what we’re interested in here.
Can this thing confirm a trend?
We’re looking at it from a somewhat different perspective. And more specifically, can we use it in the two ways that matter most for a confirmation indicator?
A two-lines cross
A zero-line cross
That’s where things get interesting.
A Little Ehlers Magic
The indicator is based on concepts developed by John Ehlers, whose work has focused heavily on applying digital signal-processing techniques to financial markets. If you’ve spent any time looking at Ehlers indicators, you know the basic idea.
His-to-ry
John Ehlers developed this bit of magic using digital signal-processing techniques to identify market cycles. He published the method in his 2001 book, “Rocket Science for Traders”. It was adopted in 2014 for MT4 from an earlier 2011 version which was created for Trading View. And now you know the rest of the story.
Breaking Tradition
Traditional technical indicators tend to treat price data like a simple series of numbers. Ehlers approaches the problem more like an engineer dealing with a noisy signal. The objective is to extract useful information about the market’s underlying cycle while reducing some of the noise. That’s the basic attraction here. Let’s take a look at this beauty.
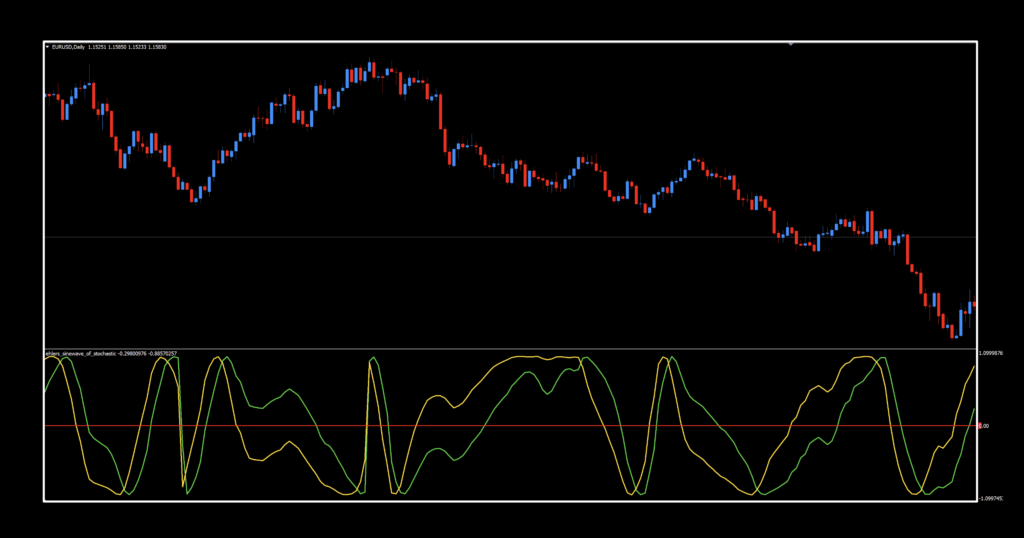
Rather than simply asking: “Is price overbought or oversold?” (which isn’t a thing for us) we’re more interested in: “Which way is the underlying cycle moving?” And that’s much more useful for a confirmation indicator.
The Two Lines
The Ehlers Sine Wave Stochastic displays two lines:
Green line
Gold line
The green line is the more responsive component, while the gold line provides the slower reference. This gives us our first method of generating a signal.
Green Crosses Above Gold = LONG confirmation
When the green line crosses above the gold line, the oscillator is indicating an upward shift.
Green Crosses Below Gold = SHORT confirmation
When the green line crosses below the gold line, the oscillator is indicating a downward shift. Simple enough.
But There’s Another Way
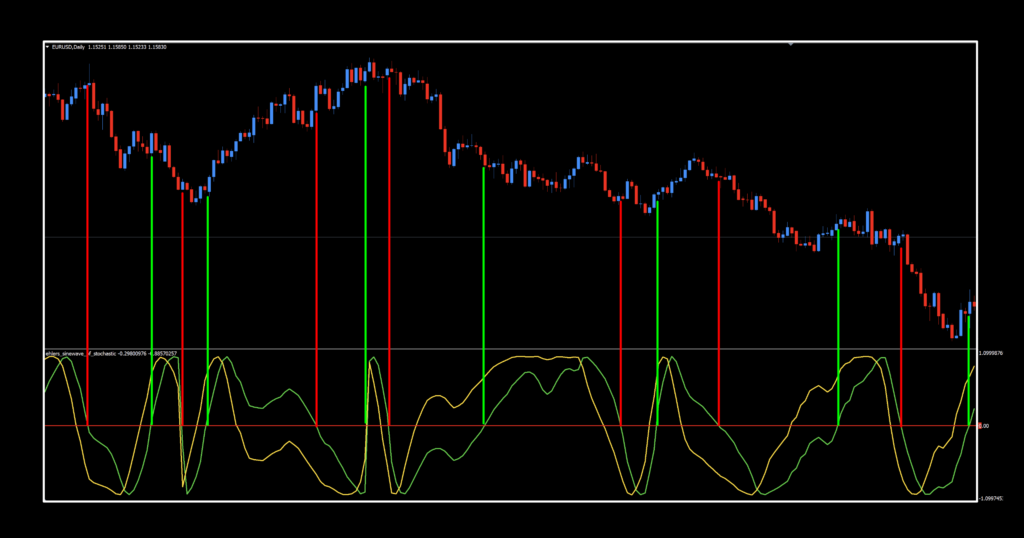
Here’s where we decided not to stop. Most traders looking at this indicator will probably gravitate toward the two-line crossover. But the green line also moves through a zero line. And that gives us another potential confirmation method.
Green Crosses Above Zero = LONG confirmation
Green Crosses Below Zero = SHORT confirmation
The difference is subtle but important. The two-line crossover is looking at the relationship between the fast and slow components. The zero-line cross is looking at the directional side of the oscillator itself.
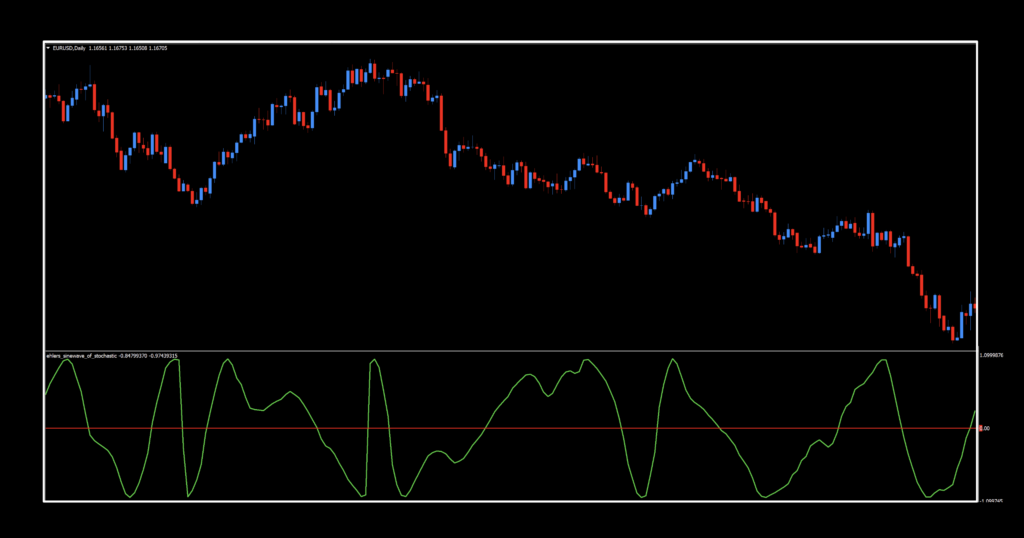
In other words:
Two-line cross = earlier signal
Zero-line cross = directional confirmation
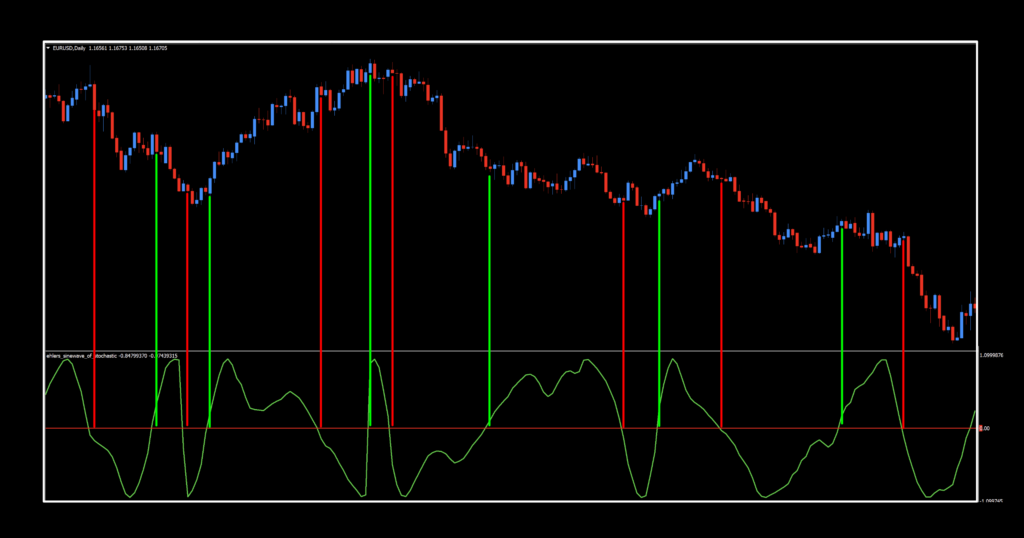
And that makes the indicator considerably more interesting from an algorithm-building perspective.
Which One Is Better?
Ah, there’s the million-dollar question. And, as usual, we’re going to disappoint anybody looking for a magical answer. We don’t know yet That’s what testing is for.
The two-line crossover should generally be more responsive. Because we’re watching the faster green line cross the slower gold line, the signal can occur earlier in a cycle. That’s potentially good. But there’s a downside.
More responsiveness = more false signals
Zero Line is Different
The green line has to actually move from one side of the centerline to the other. That tends to produce a more conservative signal. The trade-off is obvious. Earlier signal vs. stronger confirmation. And that’s exactly the kind of thing we want to investigate.
Settings
Our version has three settings that are worth paying attention to…and we use all of them.
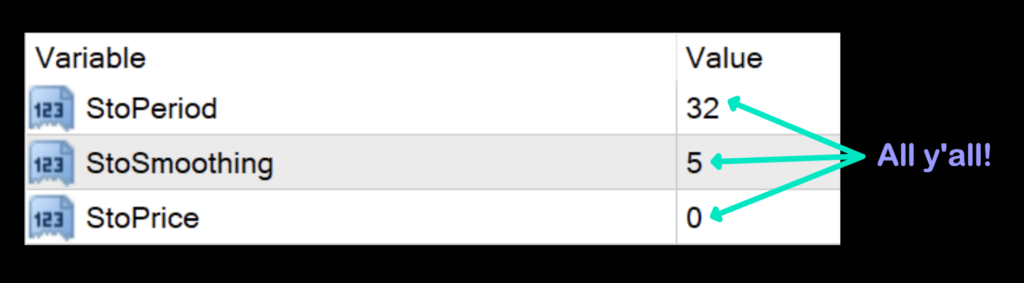
StoPeriod: This controls the lookback period used in the stochastic calculation. The default value is 32.
StoSmoothing: This controls the smoothing applied to the stochastic calculation. The default value is 5.
StoPrice: This determines which price component is used by the stochastic calculation. 0=Close, 1=Open, 2=High, 3=Low, 4=Median, 5=Typical, 6=Weighted. The default value is 0-Close.
Daily Maintenance
Remember, once you’re ready to perform daily maintenance on your trades during the last 20–30 minutes of the trading day (1700 New York time), you’ll be presented with one of four options.
- Opening a trade.
- Closing a trade
- Maintaining a trade, i.e.
- Moving a stop loss level.
- Exiting a trade.
- Taking a pass (nothing to do).
Sweetness
We’re going to provide you with two sets of data. When we tested it both ways, we were happy with all of the results, so we decided to post them and let you make the decision on which one you’d like to use.
This first bunch of metrics are the indicator used as a two lines cross.




Now, here are the results with the indicator used as a zero cross.




Wrap It Up
Normally numbers on the EUR and the SPX500 are much softer so when we saw this do really well in both instances, that was pretty much the clincher for us. BTC and XAU (as always) do pretty well due to the market, but overall, it’s a toss-up. Give them both a try and see how they do with your system…because you better not be trading with just one indicator. That would be bad, very bad.
Resources
Ehlers take on the Stochastic can be found in our indicator library for free, and it’ll be marked with “NEW” in red to help you locate it quickly. Be sure you’re subscribed to the Stonehill Forex YouTube channel, where we’ll demonstrate both ways of using it. And for heaven’s sake, do not neglect the Advanced NNFX Course to help fast-track your trading education so you can get on the trading bus sooner rather than later..
Our only goal is to make you a better trader.
*Our published testing results are based on the money management strategies employed by the NNFX system and depend on a variety of external factors that may differ between individuals and their specific broker conditions. No guarantees, trading recommendations, or other market suggestions are implied. Your results and subsequent trading activities remain solely your own responsibility.
BTW — Any information communicated by Stonehill Forex Limited is provided solely for educational purposes. The information contained in our courses, blogs, and on our website does not constitute investment advice or a general recommendation to invest. It is not intended to be, and should not be interpreted as, investment advice or a recommendation regarding any investment or trading activity. Any person who places trades, enters orders, or engages in any other form of trading or investment is solely responsible for their own investment decisions and does so at their own risk. Individuals should consult an independent financial adviser before making any investment decisions. Stonehill Forex Limited’s training courses, blogs, and other educational materials are provided for educational purposes only. Stonehill Forex Limited is not a financial advisory service and does not provide financial advice or make general investment recommendations.