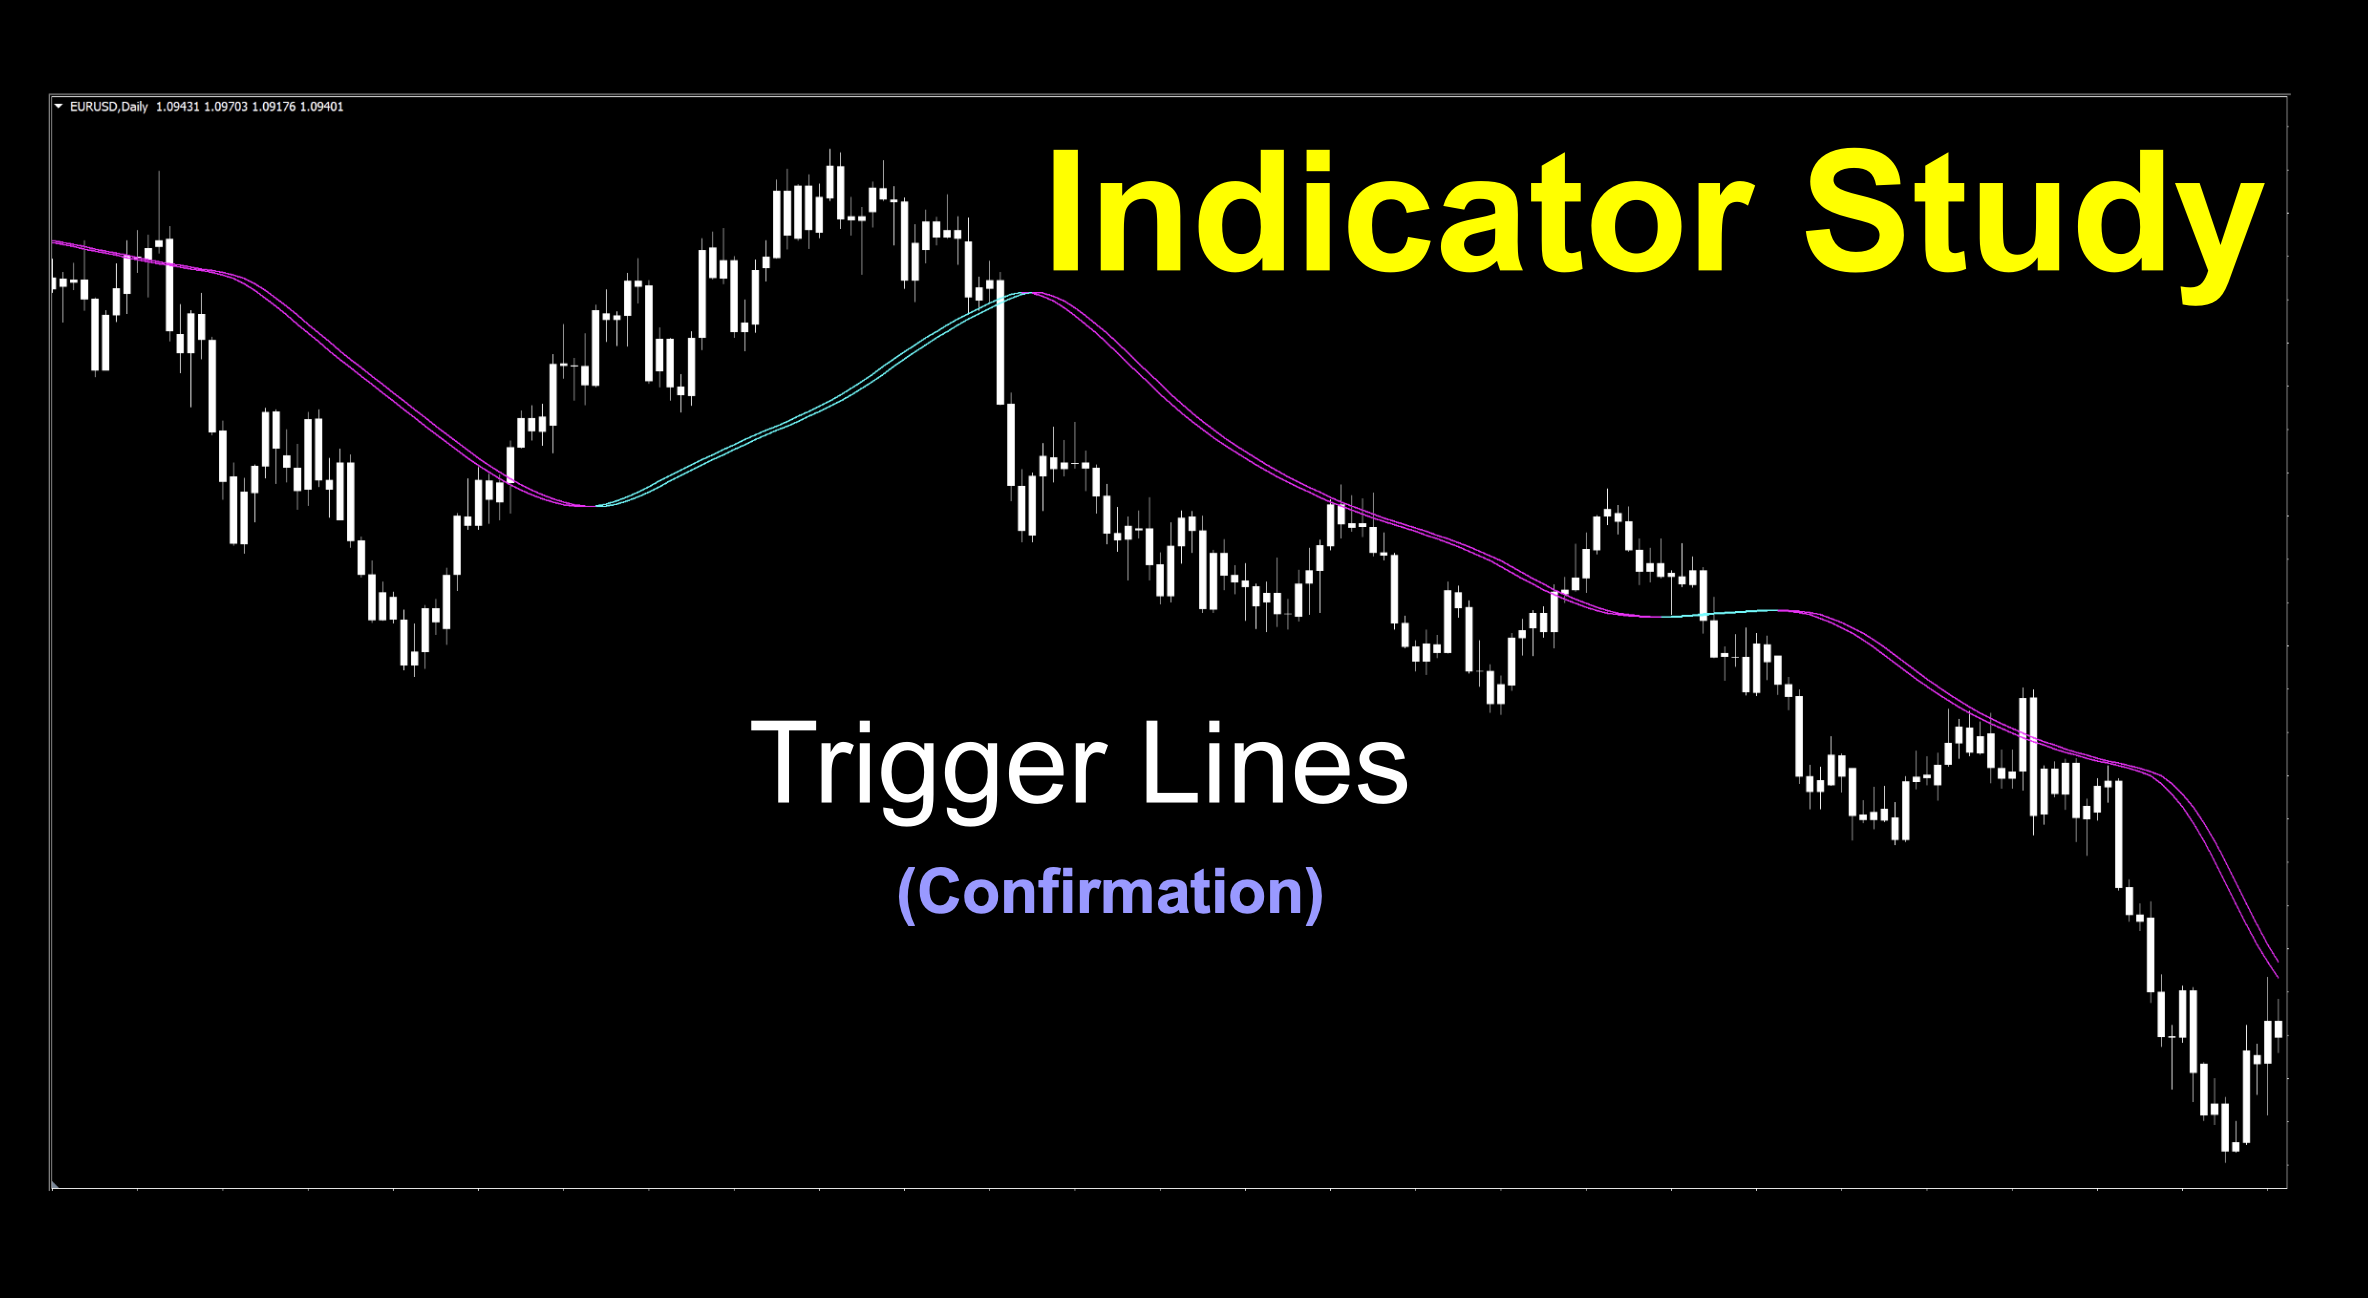
Trigger Lines
If you’d like to follow along with the e-book version of the blog, click on the play button in the audio player below (at the bottom of the page).

Draw And Fire
This week, we’ve got an indicator that has a pretty cool name. After all, something that starts with “trigger” gives calls to an image of something that reacts to whatever situation is at hand. Let’s move on and find out, shall we?
A Typo Brought This On
This week’s indicator was found from making a typing mistake. We were on a roll searching for indicators that were not zero-cross or mid-line cross styles, since we’re still keeping them off to the side for the moment. We were looking right and then, out of left field, this one came up. After some investigative research, we discovered it had unique properties and was worth researching and testing.
Got a Good One…Or Two
One of our subscribers sent us two good indicators this week; a confirmation indicator and a VOLUME indicator. We rarely get volume indicators from our community, so we believe one may an upcoming volume blog in our short term future. Please continue to send us your ideas. You do not need to include the indicator itself, but if you do – points for effort – and we appreciate you being “extra”. Send those golden bits to us at stonhillindicator@gmail.com.
Get Down On It
Alrighty, let’s get this party started. Our unexpected find this week is a price overlay color change confirmation indicator. After a bit of searching around, the earliest mention of this indicator was in 2018 and coded by a talented MetaTrader coder. So, mystery coder…we thank you.
Get Squared Up
We know you’re probably becoming more curious, but we wanted to take advantage of an educational moment. We all know and love moving averages because they’re usually one of the first types of indicators we learn, and there are so many of them. This specific moving average indicator is predicated on the use of something called the LSMA, or Least Square Moving Average.
Pause For an Educational Moment
So, what does the LSMA actually accomplish? The Least Square Moving Average minimizes the effect of price outliers and is calculated using the least-squares regression analysis method, or finding the (signal) line of best fit through a set of price data points. It is considered more responsive to changes in price trends and less affected by price extremes by reducing market “noise”. In simple terms, it connects the dots that make the most sense to draw the signal line and ignores those dots which are too far off the path. Pretty cool, eh?
Data ‘R Us
We’re going to record the data stream of this indicator to see how it reacts with price in the technical analysis video. We’re trying different days and sessions to mix things up for the analyses. At its conclusion, continue reading the blog, and of course, make sure you’re subscribed to the Stonehill Forex YouTube channel, so you don’t miss new material.
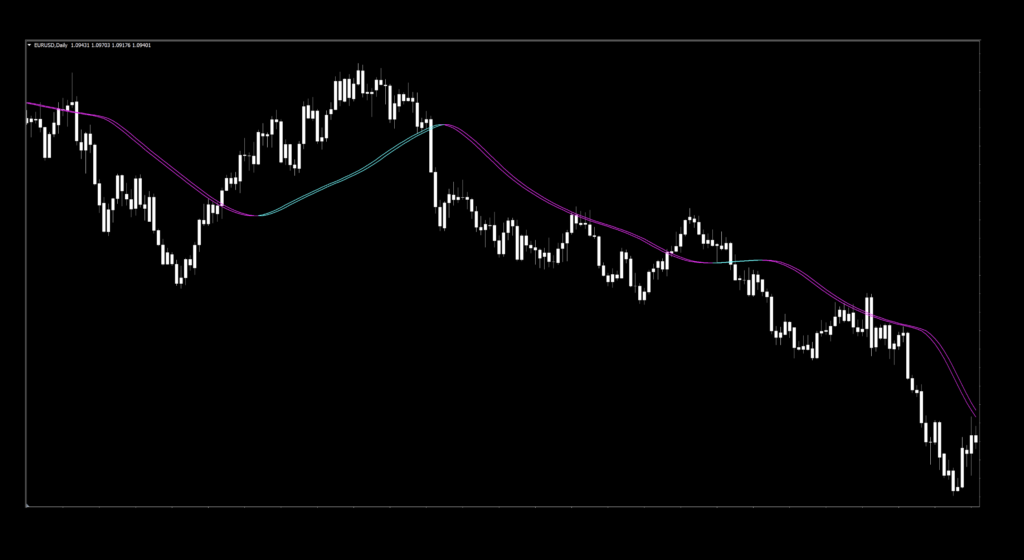
Smooth as Silk
The default colors are about as bright as you can get, but we just thickened them up a bit. Price has been changed to white for both bull and bear candles, so you can focus on the indicator only.
Settings
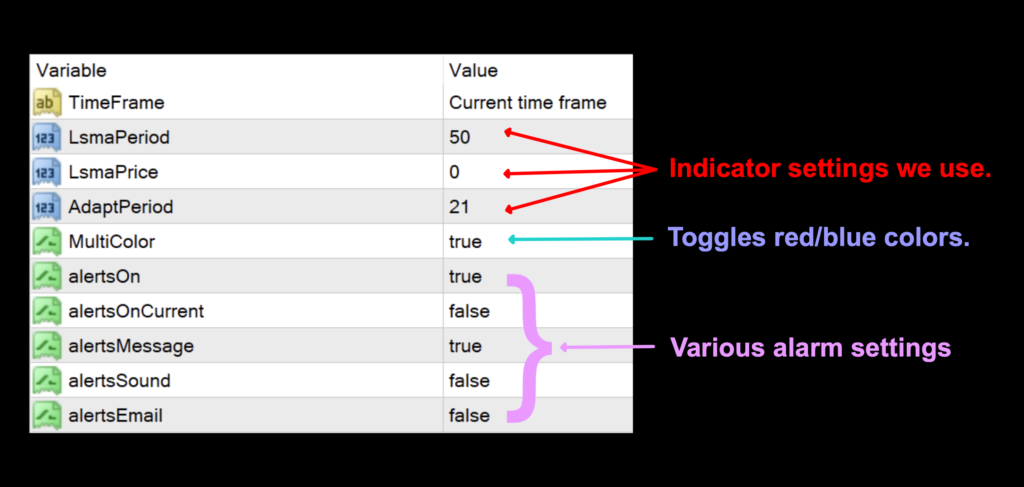
There are two handfuls of settings, but we’re only concerning ourselves with three for indicator reaction, and one for visual appearances. We also noticed in various versions available for download, there are differing numbers of settings available. The one we chose was of no particular type.
LsmaPeriod: The number of periods used in calculating both the signal lines. The default setting is 50.
LsmaPrice: This is the data set used to calculate the type of moving average. There are 5 sets; 0 through 4. The default value is 0.
AdaptPeriod: Used to further smooth the signal lines. The default setting is 21.
MultiColor: This setting toggles the color change on and off. The default value is “True”.
Advantages
* Smooth curves that react well with market price.
* Possible use it as an exit indicator.
* Based on moving averages. We like those.
Let’s Go Pip Hunting
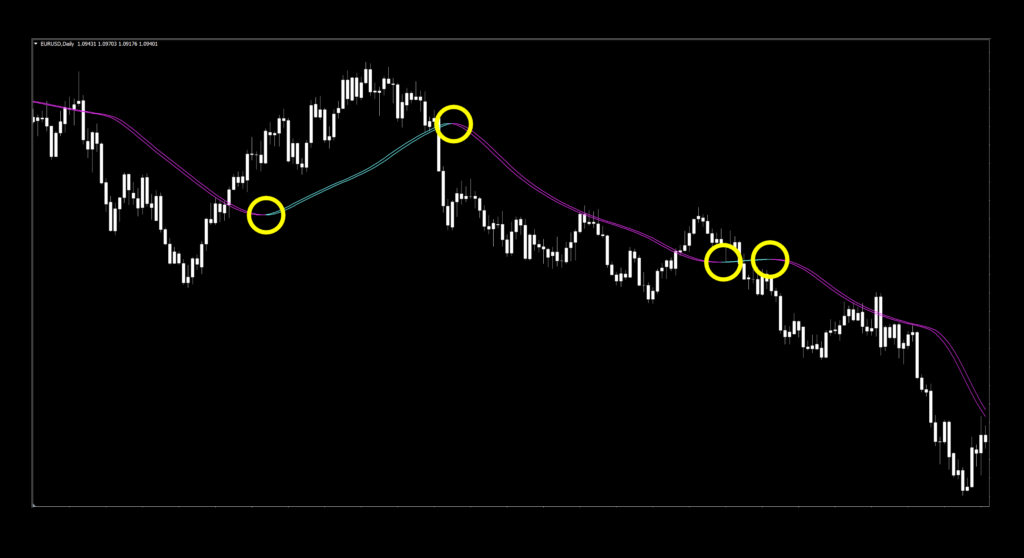
In the screenshot (above), we’ve identified the color changes to signal, entries and possible exits. Notice that the line is actually two lines which move together. We don’t recognize one or the other as more significant. Just the color change.
How We Use It
Long signal: When the signal line(s) change from red to green. The entry occurs on the open of the next period.
Short signal: When the signal line(s) change from green to red, the entry occurs on the open of the next period.
Testing and Results
If you’re new to these studies, we recommend looking at some of the older blogs to understand how we conduct our testing.
The six pairs we recommend testing are…
EUR/USD
AUD/NZD
EUR/GBP
AUD/CAD
CHF/JPY
CAD/SGD
The markets we test our indicators are the:
EUR/USD (Euro/US Dollar)
BTC/USD (Bitcoin/US Dollar)
XAU/USD (Gold/US Dollar)
SPX500 (S&P500 Index)
Timeframes and Results
We’ll run the Trigger Lines indicator on the EUR/USD, BTC/USD, XAU/USD, and the SPX500 using the default and tweaked settings across the daily and 4-hour timeframes on the MT4 strategy tester.
We focus on three metrics;
Total trades
Win/Loss ratio
ROI (return on investment)
Testing Results
Below is the data from our testing.
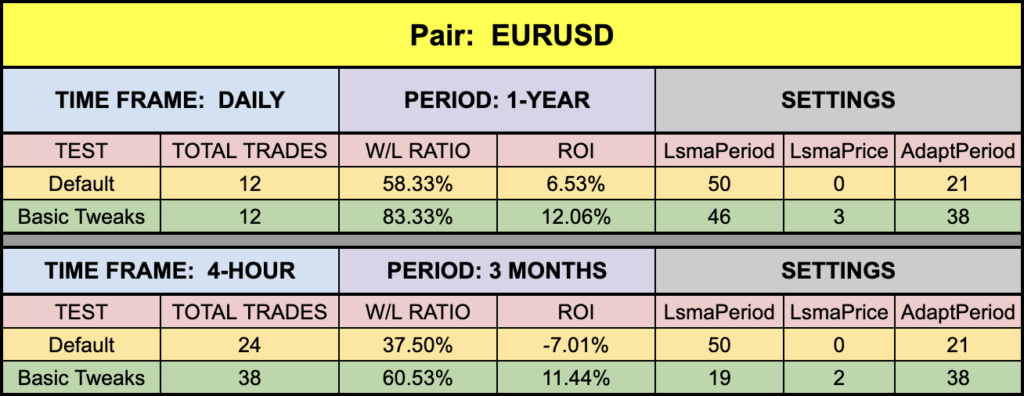
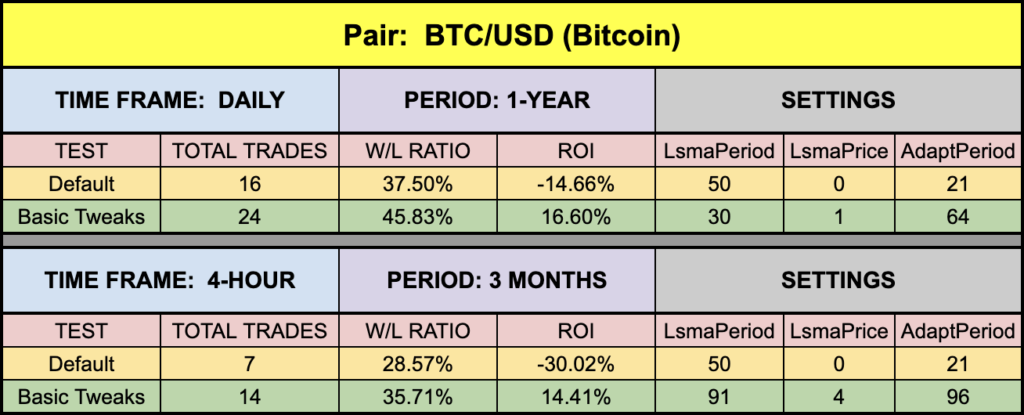
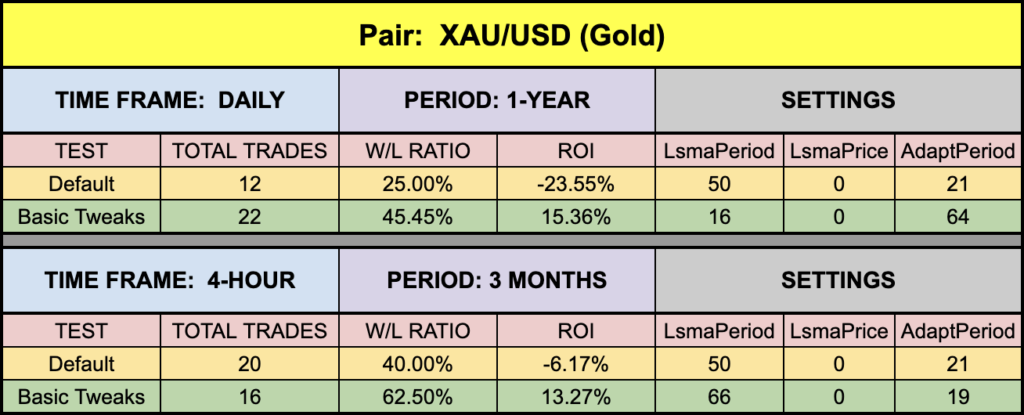
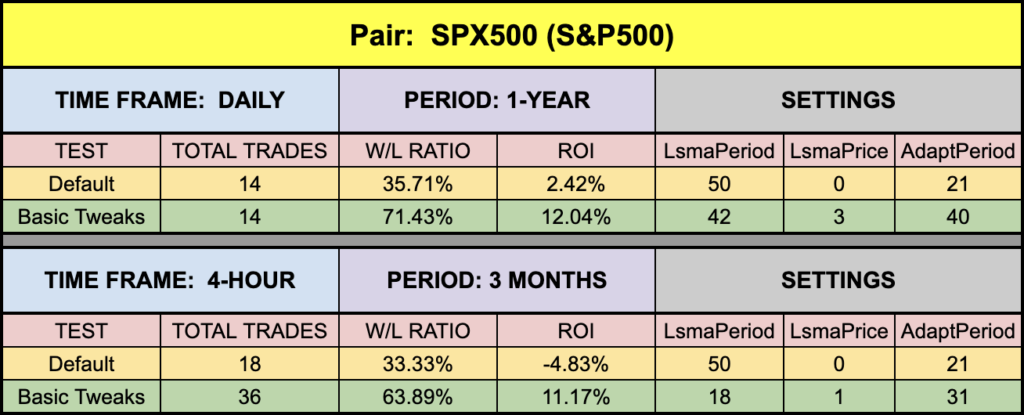
Let’s Take a Dive Into The Data
While we always start with the default settings, we print the tweaked settings in green. They’re not the best, nor the worst, but simply an attempt to demonstrate that the indicator can be made “better” by changing the settings through comparative testing. This indicator returned fairly consistent results through all tested markets
Money Management
Money management is based on the NNFX risk profile. That information can be learned in the Advanced Course.
Resources
We’ve made the Trigger Lines indicator available for download on our site from the indicator library. When you’re ready to get it, click HERE.
We’re Here For You
Sign up on our contacts page on the website for the latest digests. Subscribe to our YouTube channel and Facebook page. We also answer questions on Quora related to Forex. Visit Trustpilot to see what others are saying about us as well. Consider giving us a 5-star review if we’ve helped you. Your contribution helps others find us for a safe place to learn.
Our only goal is to make you a better trader.
BTW – Any information communicated by Stonehill Forex Limited is solely for educational purposes. The information contained within the courses and on the website neither constitutes investment advice nor a general recommendation on investments. It is not intended to be and should not be interpreted as investment advice or a general recommendation on investment. Any person who places trades, orders or makes other types of trades and investments etc. is responsible for their own investment decisions and does so at their own risk. It is recommended that any person taking investment decisions consults with an independent financial advisor. Stonehill Forex Limited training courses and blogs are for educational purposes only, not a financial advisory service, and does not give financial advice or make general recommendations on investment.