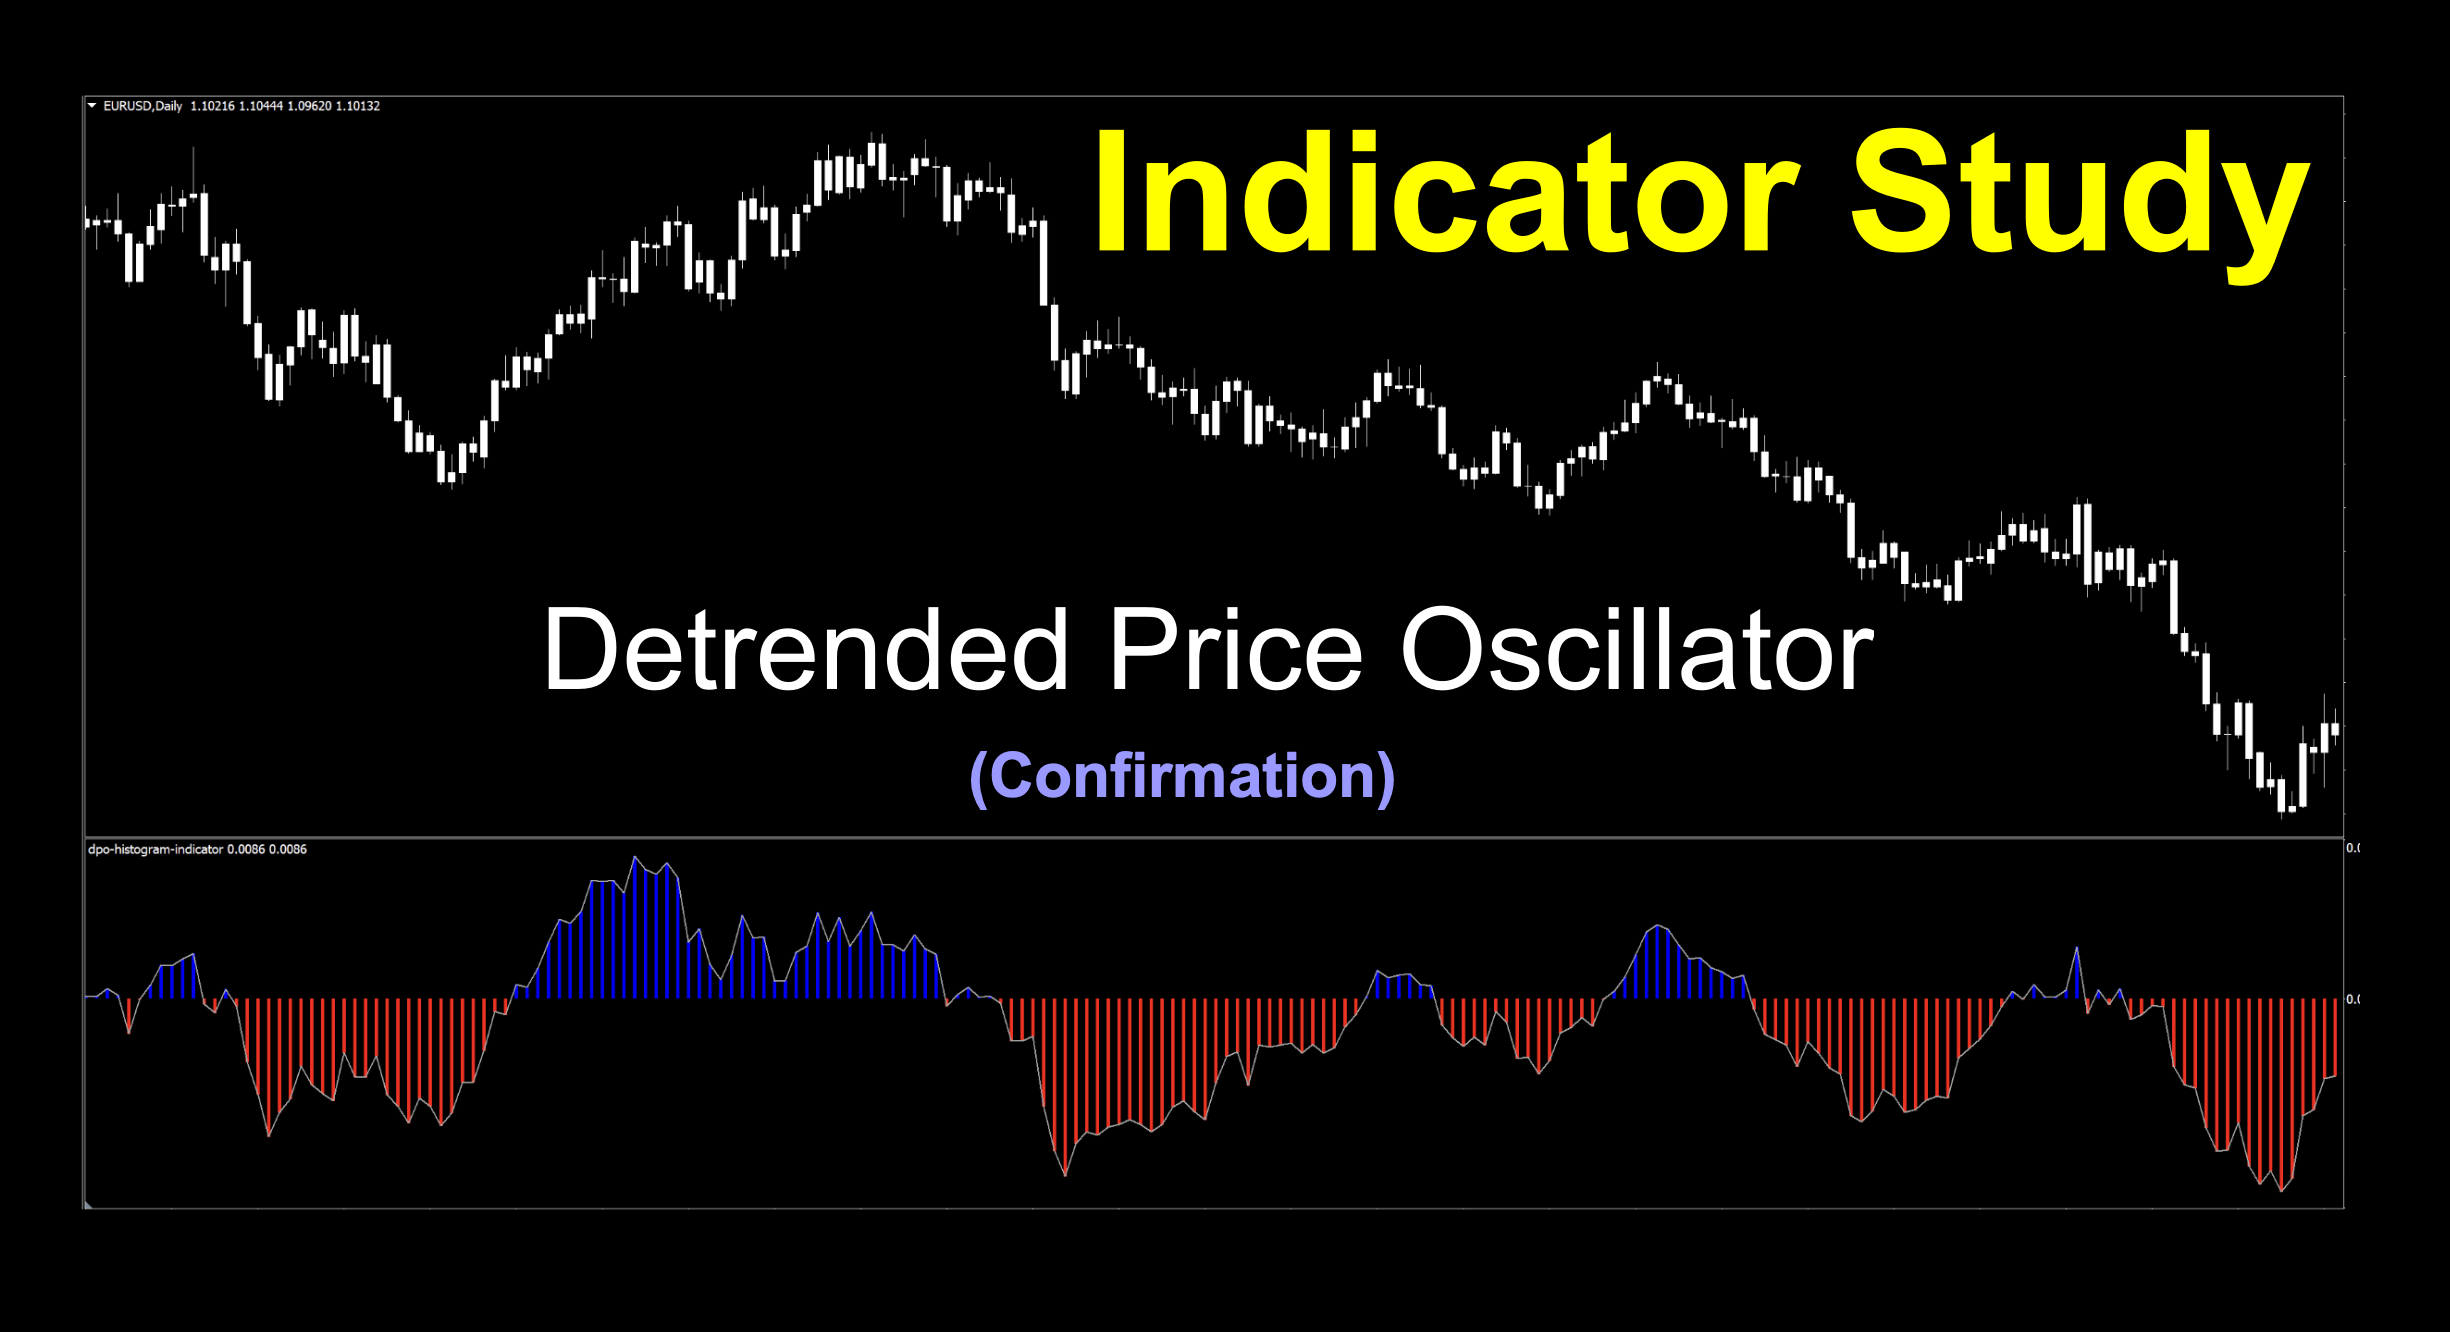
Detrended Price Oscillator
If you’d like to follow along with the e-book version of the blog, click on the play button in the audio player above.

The Dope Show
We researched this indicator a few weeks ago but held off putting it out because we want to spread the wealth when it comes to different kinds of indicators. Histograms are so visually easy to use because of their broad colored bands, simple zero cross signals, and the fact that there’s just not a lot of deep thinking required. That being said, we’re guessing that we have your interest. After all, isn’t the word “easy” such an attractive expression when it comes to trading? Easy is, as easy does…we like easy, don’t we?
The 90s Want Their Flannel Shirts Back
Do I have your attention? We figured that starter might get you wondering what we’re up to. Now that you’re paying attention, we’re rolling back the clock to 1991 for a concept developed by William Blau called the Detrended Price Oscillator, or DPO for short. The DPO and other cousins; percentage price oscillator (PPO) and the absolute price oscillator (APO) were offshoots of an older, and very well known indicator called the MACD developed by Gerald Appel. By the way, we did an indicator profile on Detrended Synthetic Price by John Ehlers awhile back. This is not that.
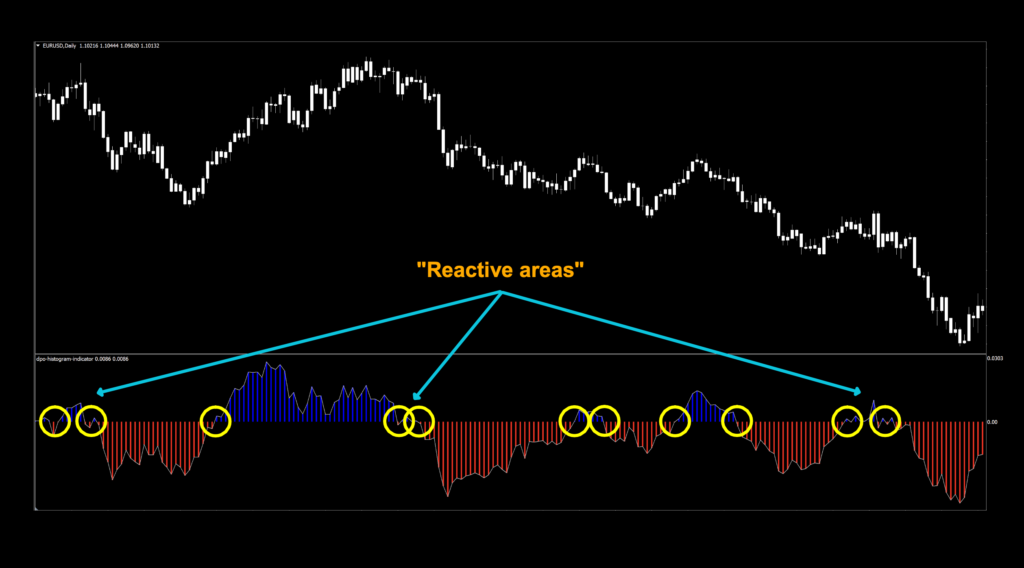
Before we dive into the inner workings of the DPO, let’s take a moment to sit back and watch the indicator in action for a few minutes before moving on.
Crikey!
The calculations which create the DPO are relatively simple and the MT4 version has an added value bonus which we’ll cover shortly. But first, let’s quickly cover how the signal line is created.
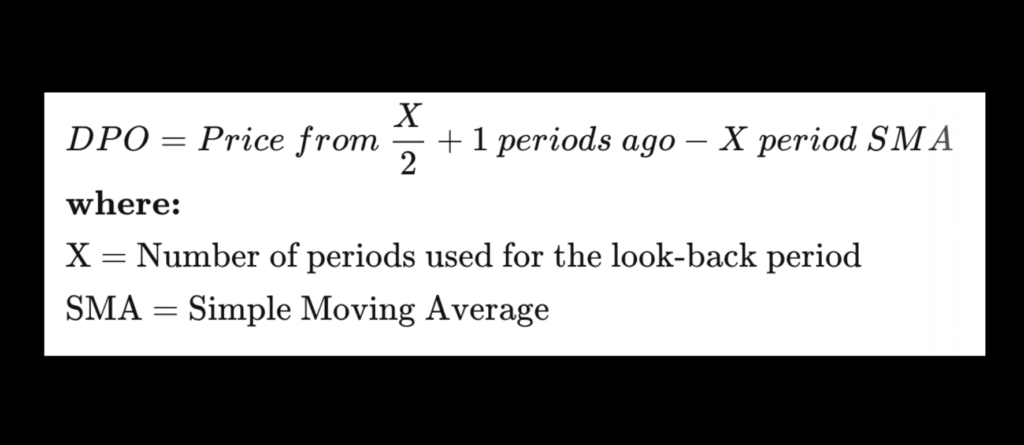
DPO is calculated by subtracting the simple moving average over a certain number of periods and shifted (n/2+1) periods back from the price.
The formula is:
Operational Explanation
The DPO compares current price with an average price at some point in the past. When the signal line crosses zero, it means that the current price is the same as that older price. Depending on what direction the signal line is going, the trend can be assessed. The difference between current price and the DPO can be interpreted as weaker or stronger than the trend of the moving average in the formula.
Bottom Line
The indicator’s objective is to remove price trends in an effort to estimate the length of price cycles. Unlike other oscillators, such as the cousins we mentioned earlier, the DPO is not a momentum indicator.
Cool, eh?
So, what’s the cool part of what the MT4 coders did with this indicator? You know, the value added bonus bit I brought up earlier? The bonus is that we get a choice of not one moving average type to use, but four different kinds. Quadruple the flavor, quadruple the fun.
A Whole Lot of Doing Nothing
When we first looked at this indicator on our black chart with while candles, we discovered that nothing had to be added, or taken away. That doesn’t happen often. So, it all its glory, this is the default view of the DPO, presented to you by MT4.
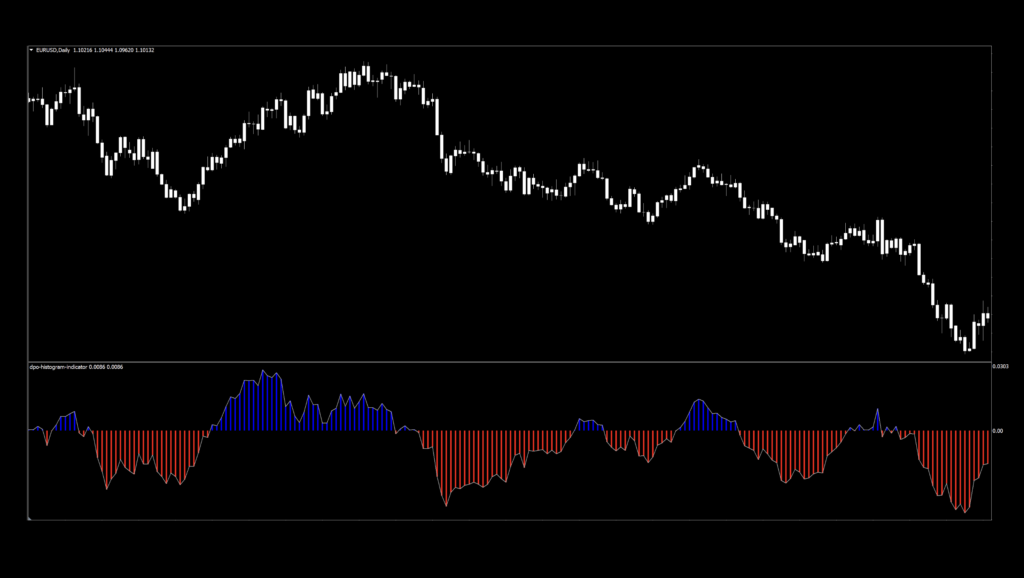
This is one of those indicators where less is more. We only have two settings to concern ourselves with.
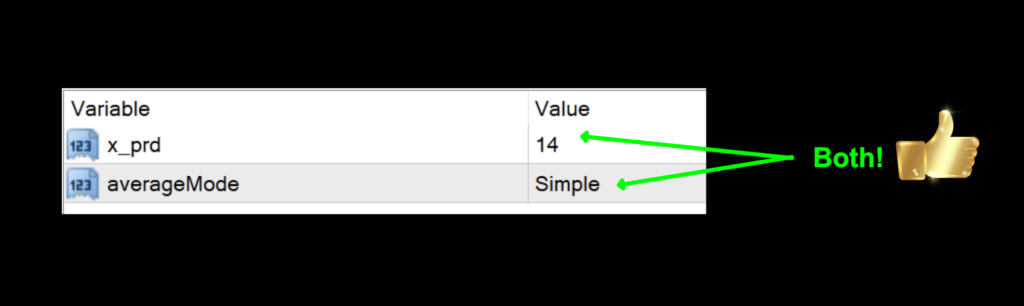
Settings
We’re also going to explain why the default settings are what they are.
x_prd: The length of periods considered for calculating the DPO. The default setting is 14.
averageMode: The moving average type; Simple, exponential, smoothed, and linear weighted. The default setting is simple.
Advantages
* Based on historically favorite indicators.
* Easy to make adjustments (tweak).
* Clear signals.
Now that we’ve discussed the history, settings, and bonus features, let’s see what the default signals look like.
How We Use It
Long signal – When the signal line crosses and closes above the zero line – and the histogram turns blue. The entry occurs on the open of the next candle.
Short signal – When the signal line crosses and closes below the zero line and the histogram turns red. The entry occurs on the open of the next candle.
Testing the DPO
If you’re new to these studies, we recommend looking at the testing section of the indicator “Polychromatic Momentum” to see the entire explanation of how we test and what we look for.
The six pairs we recommend testing are…
EUR/USD
AUD/NZD
EUR/GBP
AUD/CAD
CHF/JPY
CAD/SGD
The markets we test our indicators are the:
EUR/USD (Euro/US Dollar)
BTC/USD (Bitcoin/US Dollar)
XAU/USD (Gold/US Dollar)
SPX500 (S&P500 Index)
Timeframes and Results
We’ll run the Detrended Price Oscillator indicator on the EUR/USD, BTC/USD, XAU/USD, and the SPX500 using the default and tweaked settings across the daily and 4-hour timeframes on the MT4 strategy tester.
We focus on three metrics;
Total trades
Win/Loss ratio
ROI (return on investment)
What We Got
Below are the spreadsheets from our tests.
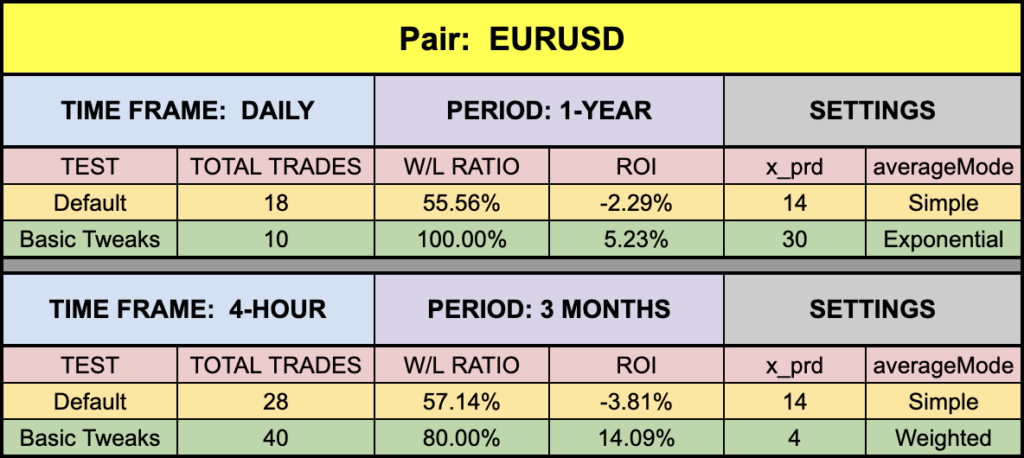
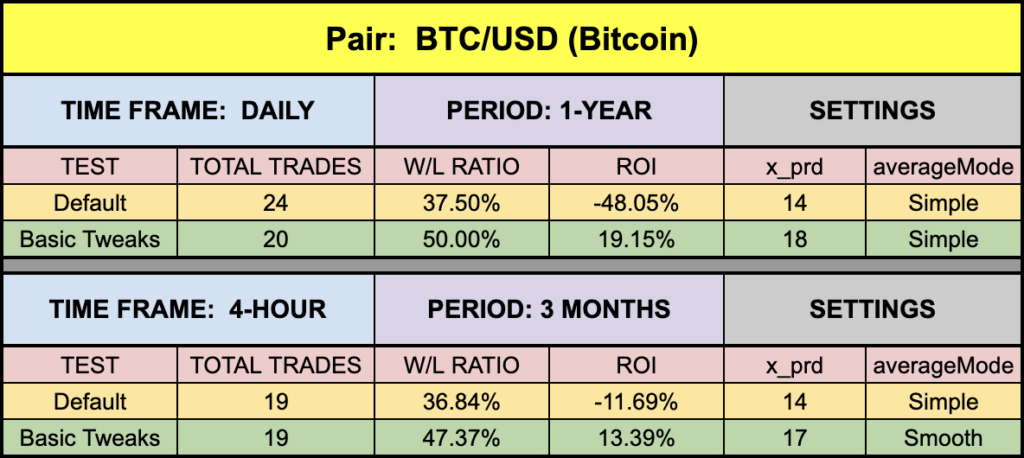
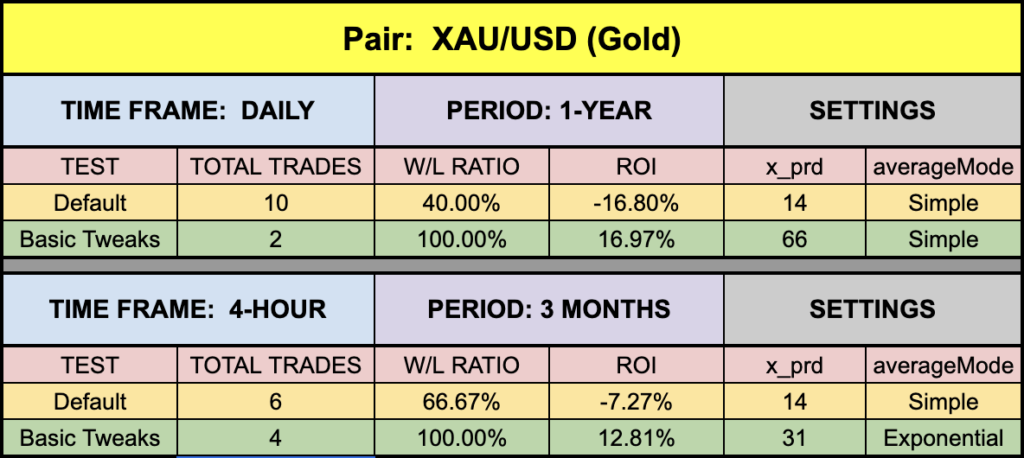
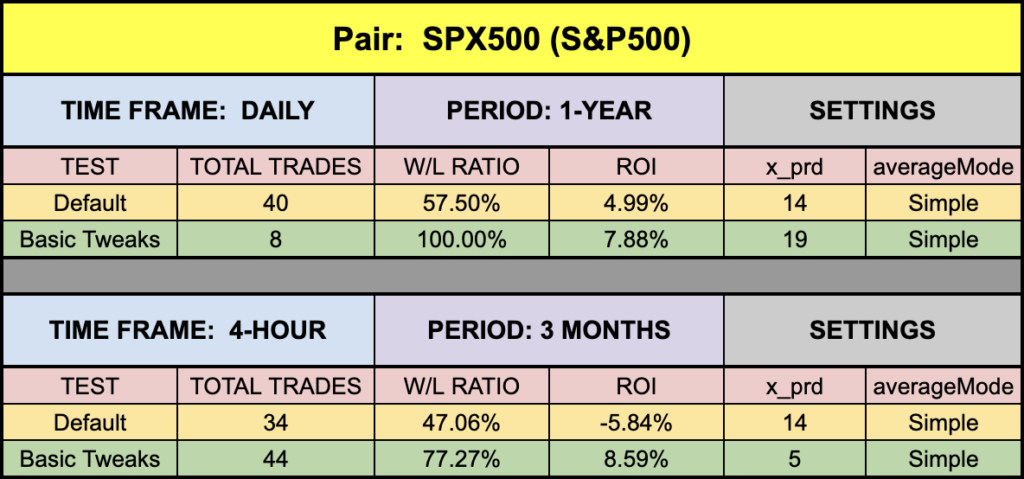
The green highlighted rows represent “basic tweaks” on the settings which returned better results. Are these the best? Not necessarily. You may find better settings…in fact, we hope you do!
Warning – the results we post in these blogs should never be considered specific trading advice. And of course, never use just this one indicator as your decision of whether to open or close a trade. It should be part of a system.
Money Management
If you are curious as to what money management is used on our tests; we adhere to the NNFX risk profile. That information can be found (in detail) by signing up for the Advanced Course.
Resources
We’ve made the Detrended Price Oscillator indicator available for download on our site from the indicator library. When you’re ready to get it, click HERE.
We’re Here For You
Sign up on our contacts page on the website for the latest digests. Subscribe to our YouTube channel and Facebook page. We also answer questions on Quora related to Forex. Visit Trustpilot to see what others are saying about us as well.
Our only goal is to make you a better trader.
BTW – Any information communicated by Stonehill Forex Limited is solely for educational purposes. The information contained within the courses and on the website neither constitutes investment advice nor a general recommendation on investments. It is not intended to be and should not be interpreted as investment advice or a general recommendation on investment. Any person who places trades, orders or makes other types of trades and investments etc. is responsible for their own investment decisions and does so at their own risk. It is recommended that any person taking investment decisions consults with an independent financial advisor. Stonehill Forex Limited training courses and blogs are for educational purposes only, not a financial advisory service, and does not give financial advice or make general recommendations on investment.