Kase Peak Oscillator
If you’d like to listen to the blog (like an e-book) while following the text, click “play” on the media player below.
Audio Player
Let’s Take a Peek
We broadcasted an indicator developed by Cynthia Kase a few weeks back and figured, why not do another. After all, she’s a really amazing individual. Once again, we’ll show you the original view, but as we normally do, we will change things to make it easier (what we think). We’ll explain why we made the changes, but I’ll give you a hint – it’s the way we trade. Did you guess what the answer is?
Tell us Again
Since you asked so nicely, we’ll remind you what a virtuosa Ms. Kase is. A technical analysis whiz in the realm of market forecasting and software development, she created her own company in 1992 and has put out some remarkable material for us lowly retail traders.
We’ll put in the technical analysis video of the Kase Peak Oscillator here to whet your appetite for…the rest of the story.
So Many Dimensions
The Kase Peak Oscillator was first discussed in the 1996 article, “Multidimensional trading” and coded for MT4 in about 2010. There have been multiple indicator versions and various systems coded around this concept; but for our purposes, we’ll just stick to the basic indicator.
Act 1
We’ll take a look at the default view of the indicator and talk about that for a moment. Then, we’ll make a few small changes, so it’s easier for us to use…and we’ll explain why. Price action will be white (as per our usual) so we can just focus on the indicator.
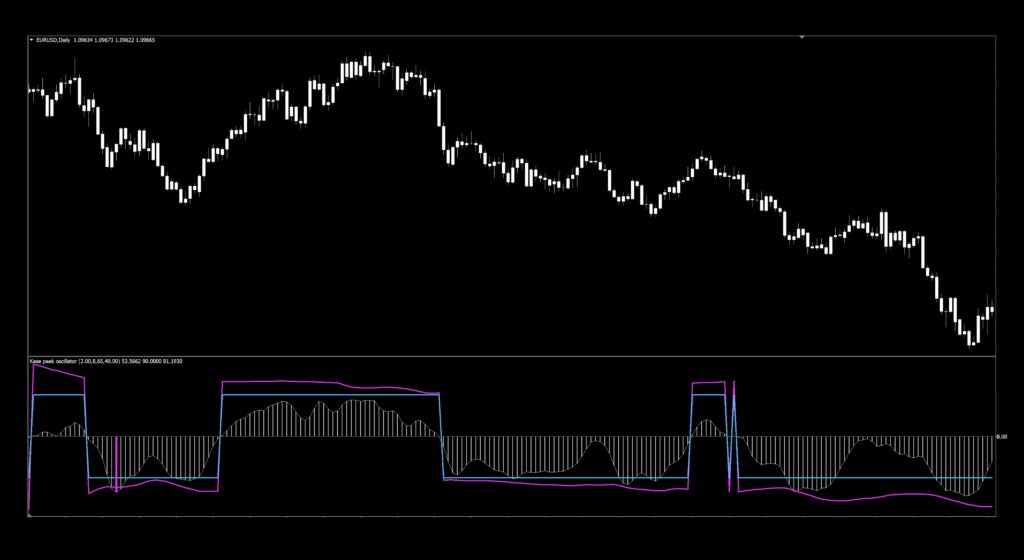
The first thing you’ll notice is that there are four components to this indicator:
1. Pink oscillating line.
2. Blue oscillating line
3. Histogram.
4. Pink vertical lines. (All Peaks Mode)
What we noticed visually (and through testing) that the blue/pink lines and the histogram all converged at the same zero cross line. So we chose one. We chose blue.
Busy Busy Busy
You may ask why there is so much going on here. The reason is that, like most oscillators, try and foretell changes in the direction of the market – i.e., reversal trading. We don’t subscribe to reversal trading. We trade what we can actually see, not what we think might happen. That being said, when an indicator crosses zero, the math dictates that condition. This provides us with a signal that has a measurable degree of confidence. And who doesn’t want to be confident? Especially with money on the line…
Elementary
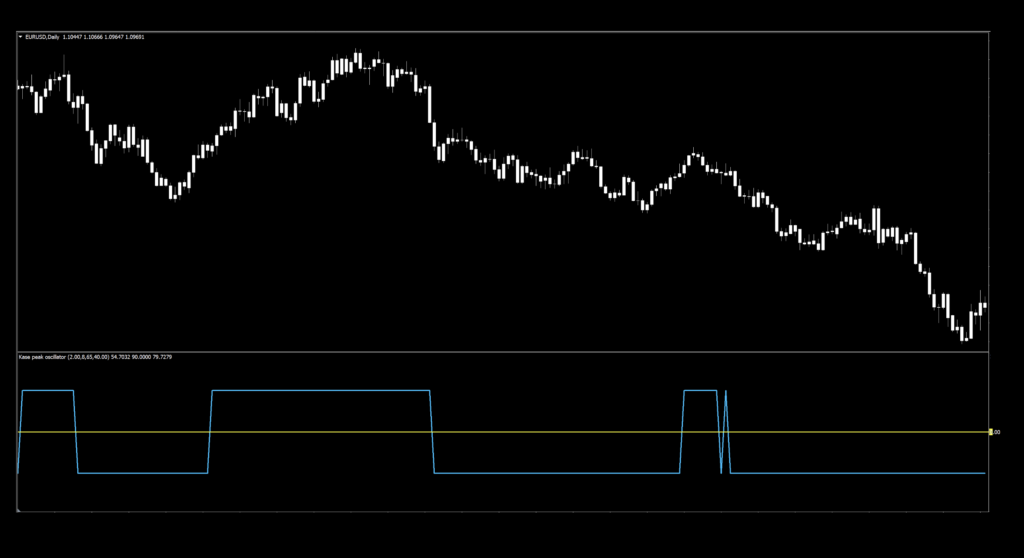
For our purposes, we’re going to remove the histogram and all the pink lines, so all we’re left with is an easy-to-read blue oscillating line.
Before we go any further, let’s take a look at the settings.
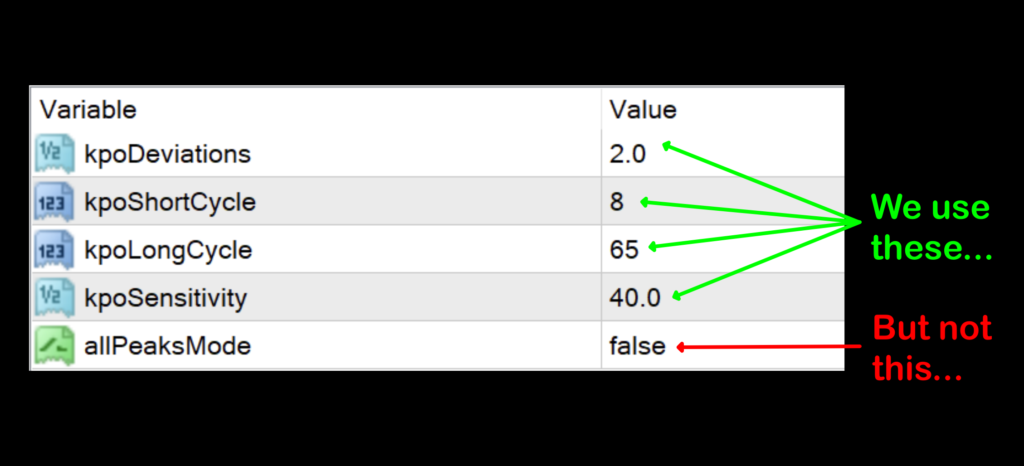
Settings
We’re also going to explain why the default settings are what they are.
kpoDeviations: Deviations to use in calculation. The default setting is 2.0.
dpoShortCycle: Starting position to calculate values. The default setting is 8.
kpoLongCycle: Ending position to calculate values. The default setting is 65.
kpoSensitivity: The data set used for the calculations. The default setting is 40.0.
allPeaks Mode: Identifies the swing highs/lows. We do not use this setting. Leave it on “false”.
Advantages
* Known source material from a proven individual.
* Simple signals, very little interpretation.
* Ability to tweak for increased indicator manipulation.
Let’s take a moment to see how the indicator reacts with price on the default settings with regard to signals.
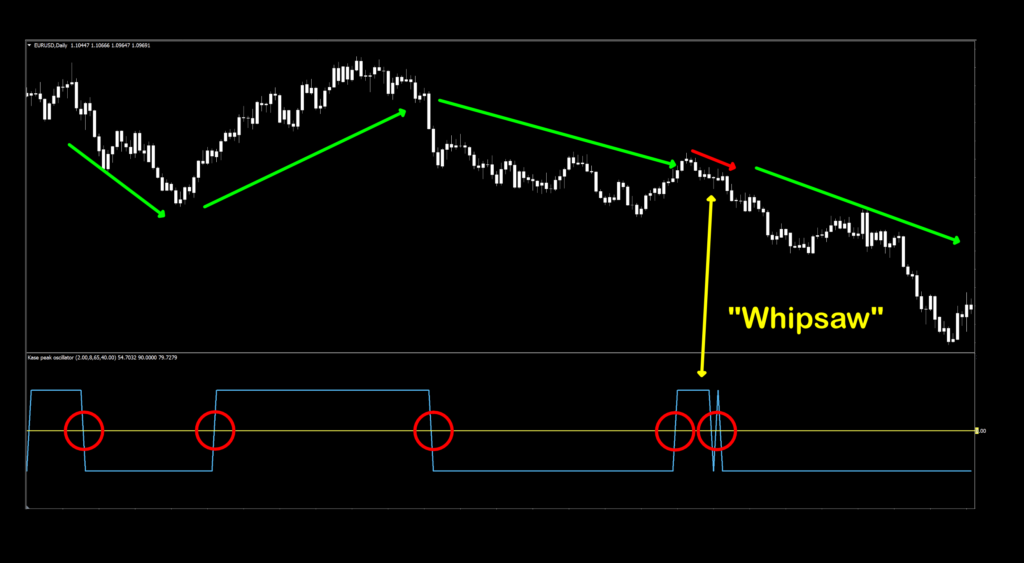
How We Use It
Long signal – When the signal line crosses and closes above the zero line. The entry occurs on the open of the next candle.
Short signal – When the signal line crosses and closes below the zero line. The entry occurs on the open of the next candle.
Not Bad
Even on the default settings, the entries were pretty good, except for that one “whipsaw” area where the long/short/long/short grouping occurred. This is where having an algorithm to confirm an entry is a *must*. Trying to make trades on only one indicator alone is a recipe for disaster.
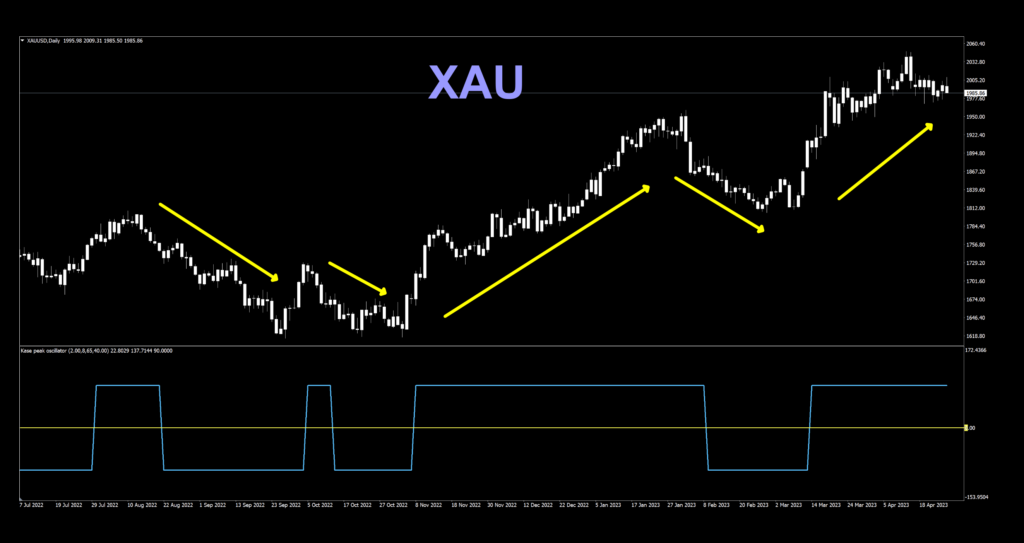
BTC versus XAU
We’ve talked about how Bitcoin numbers have been a little strange. We (SHF & VP) had a discussion surrounding the numbers between the different blogs. Some factors are attributed to this; testing dates and internal indicator math among the two biggest factors. Look at the two images below, and you’ll see that the “equity curves” of the two pairs are very different during the same time period. This will definitely return different numbers.
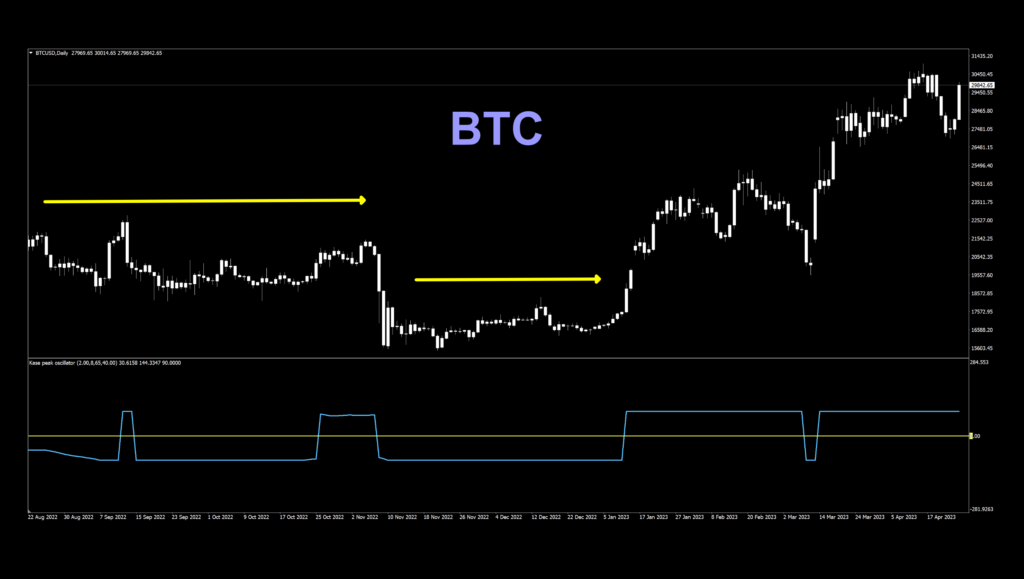
Notice how the pairs trace different paths with respect to trending and ranging.
Testing…Shortened
After many of these blogs, we figured that you already know what to expect – so in the interest of efficiency, we’re going to shorten our testing section text. If you’re new to these studies, we recommend looking at the testing section of the last indicator (Polychromatic Momentum) to see the entire explanation of how we test and what we look for.
The six pairs we recommend testing are…
EUR/USD
AUD/NZD
EUR/GBP
AUD/CAD
CHF/JPY
CAD/SGD
The markets we test our indicators are the:
EUR/USD (Euro/US Dollar)
BTC/USD (Bitcoin/US Dollar)
XAU/USD (Gold/US Dollar)
SPX500 (S&P500 Index)
Timeframes and Results
We’ll run the Kase Peak Oscillator indicator on the EUR/USD, BTC/USD, XAU/USD, and the SPX500 using the default and tweaked settings across the daily and 4-hour timeframes on the MT4 strategy tester.
We focus on three metrics;
Total trades
Win/Loss ratio
ROI (return on investment)
Moment of Truth
Below are the spreadsheets illustrating the results from our tests.
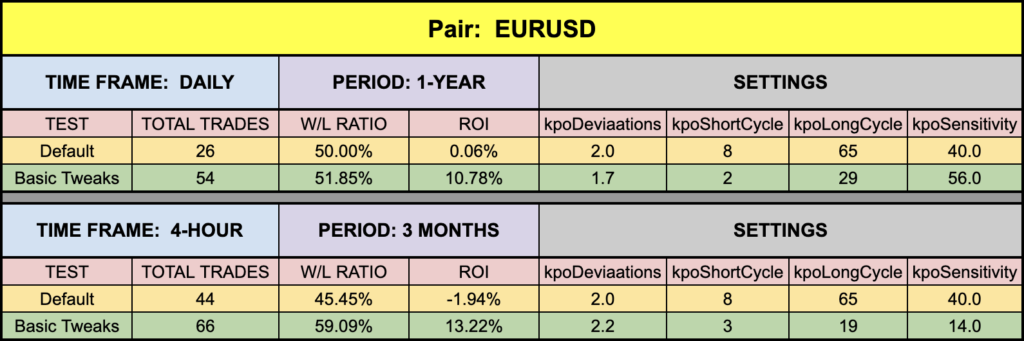
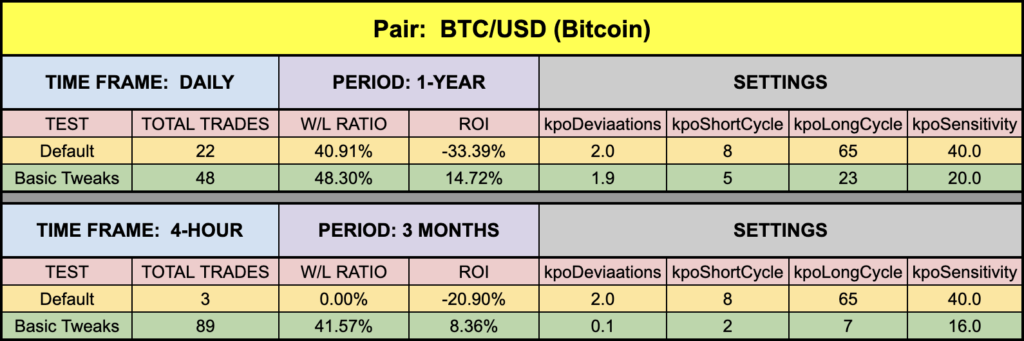
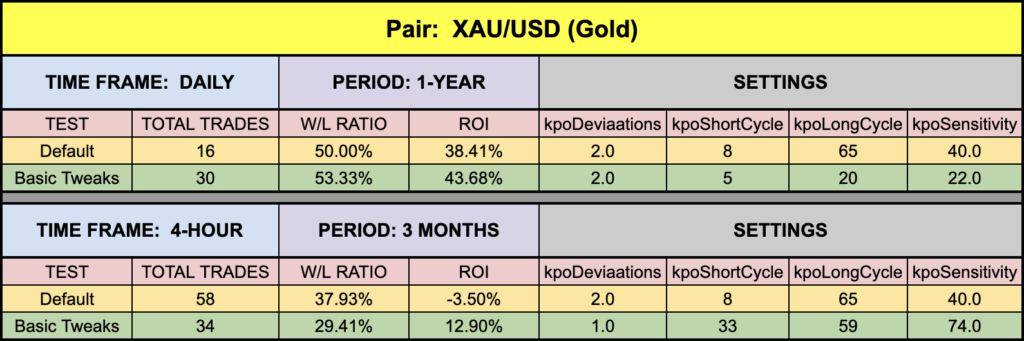
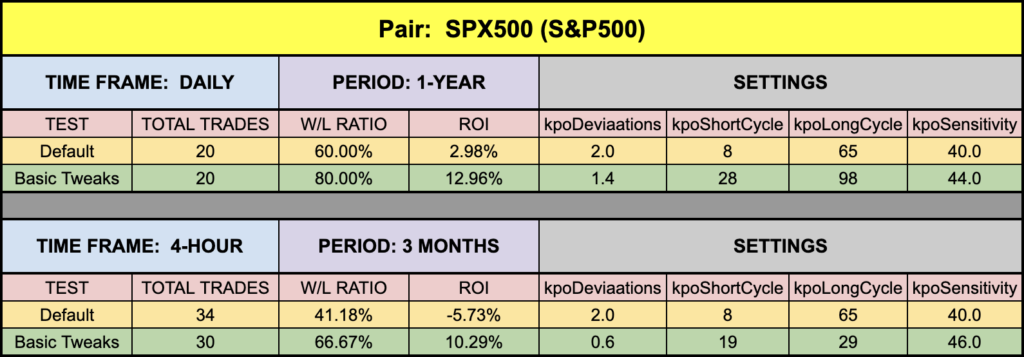
The green highlighted rows represent “basic tweaks” on the settings which returned better results. Are these the best? Not necessarily. You may find better settings…in fact, we hope you do!
Warning – the results we post in these blogs should never be considered specific trading advice. And of course, never use just this one indicator as your decision of whether to open or close a trade. It should be part of a system.
Money Management
If you are curious as to what money management is used on our tests; we adhere to the NNFX risk profile. That information can be found (in detail) by signing up for the Advanced Course.
Resources
We’ve made the Kase Peak Oscillator indicator available for download on our site from the indicator library. When you’re ready to get it, click HERE.
We’re Here For You
Sign up on our contacts page on the website for the latest digests. Subscribe to our YouTube channel and Facebook page. We also answer questions on Quora related to Forex. Visit Trust Pilot to see what others are saying about us as well.
Our only goal is to make you a better trader.
BTW – Any information communicated by Stonehill Forex Limited is solely for educational purposes. The information contained within the courses and on the website neither constitutes investment advice nor a general recommendation on investments. It is not intended to be and should not be interpreted as investment advice or a general recommendation on investment. Any person who places trades, orders or makes other types of trades and investments etc. is responsible for their own investment decisions and does so at their own risk. It is recommended that any person taking investment decisions consults with an independent financial advisor. Stonehill Forex Limited training courses and blogs are for educational purposes only, not a financial advisory service, and does not give financial advice or make general recommendations on investment.