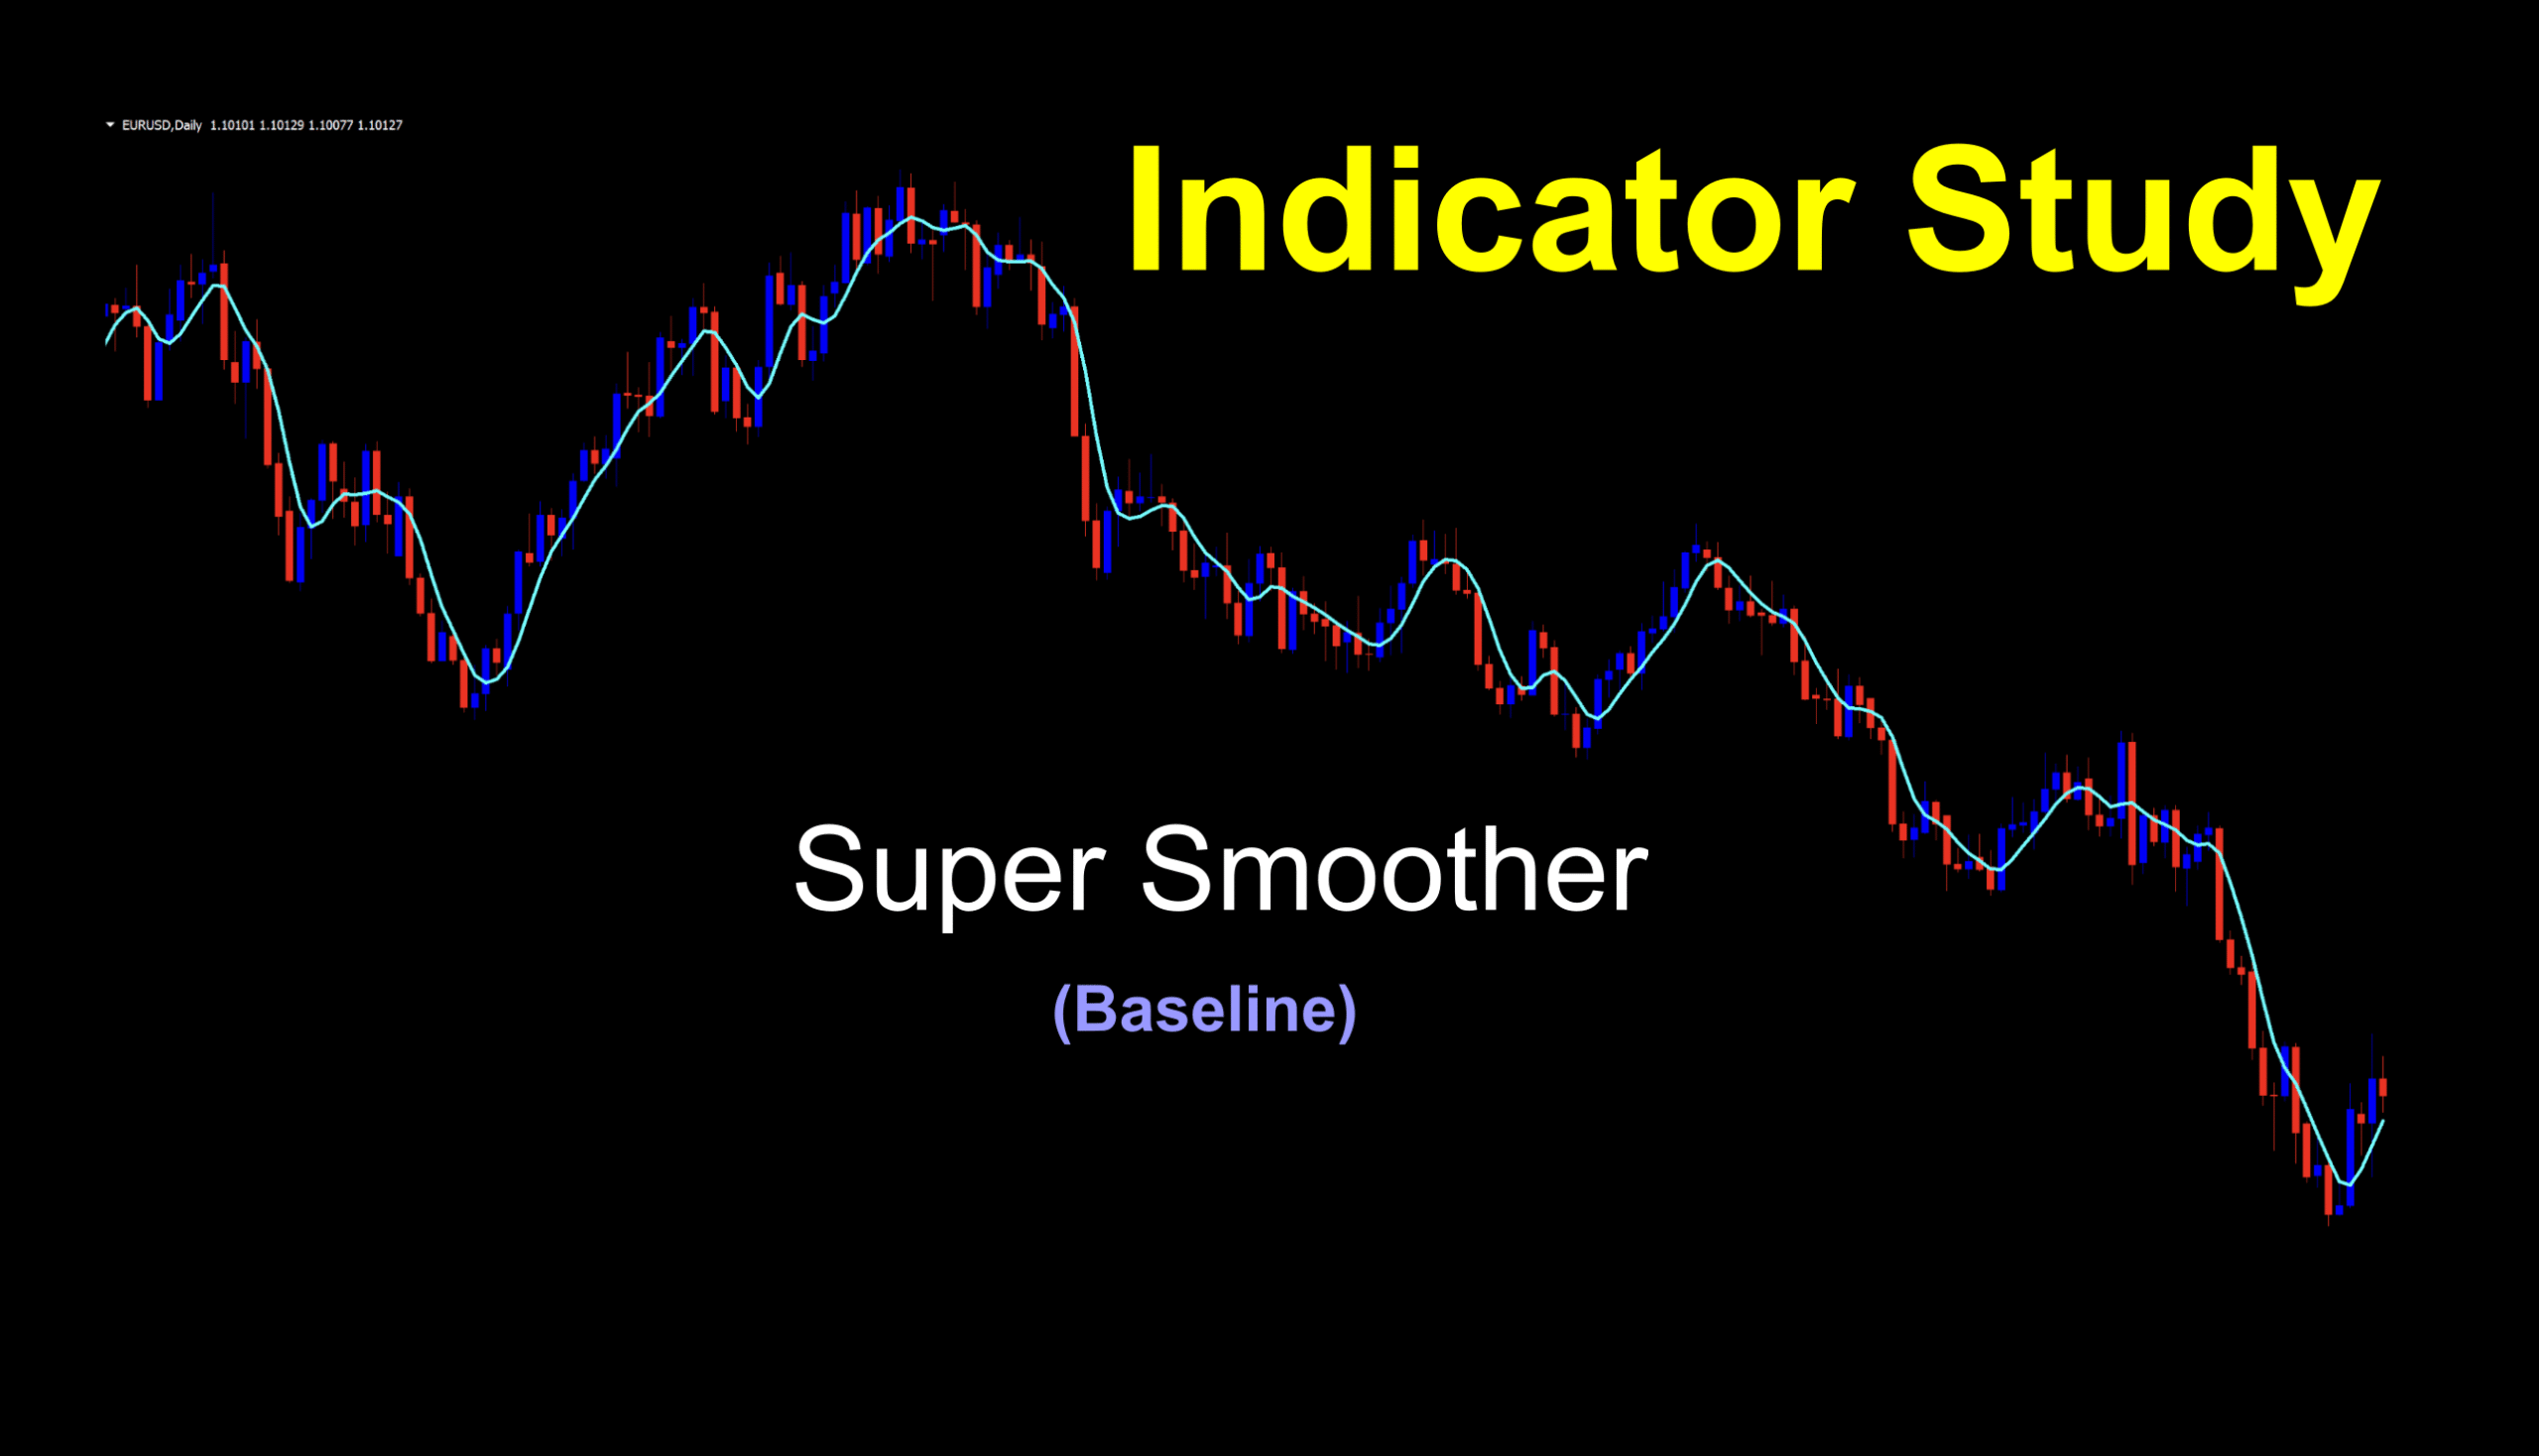
Super Smoother
If you’d like to follow along with the e-book version of the blog, click on the play button in the audio player above.

Kick Up The Bass…Base?
Baselines are an interesting thing. Sometimes they’re the first thing we use to determine the validity of a potential signal, sometimes not. The essence of the baseline is that we’re looking for the “big picture” of price action, specifically – if the market has entered into a trend.
Gnashing of Teeth
A good baseline will help stave off signals in a choppy/volatile/dead/ranging market. Those markets can kill your account, completely throw off your psychology; which VP continually preaches as the number one thing you need to master, and make things miserable for you. That being said, we’ve got something we hope will help you find better signals. Shall we take a look?
Such Smoothness
As baselines are pretty straight forward, we’ll get through this pretty quickly. The Super Smoother was designed by Kirill Eremenko in 2014 to filter “random” market noise. That means it was designed to strain out irregular movements of market price for better signal identification.
Comparison Shopping
It was billed as a better alternative to the EMA (exponential moving average). We’ll put both on the chart and compare signals to give us an idea of how they stack up against each other. Fun stuff!
Let’s take a few minutes to see how this “better than EMA” baseline works with price by watching the video. We’re getting good feedback to the videos, and we appreciate it.
Getting to the Chart
As we don’t need a lot of discussion for a baseline, we’ll just get to the chart. We’ve changed the all white candles to blue and red for entry identification purposes and made the baseline a nice bright aqua and thickened it up for better visibility.
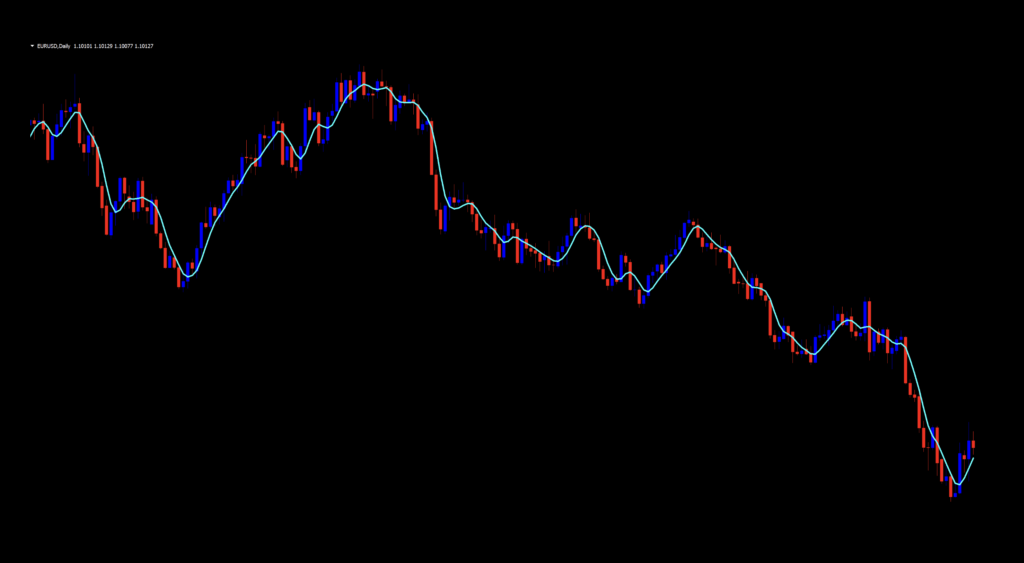
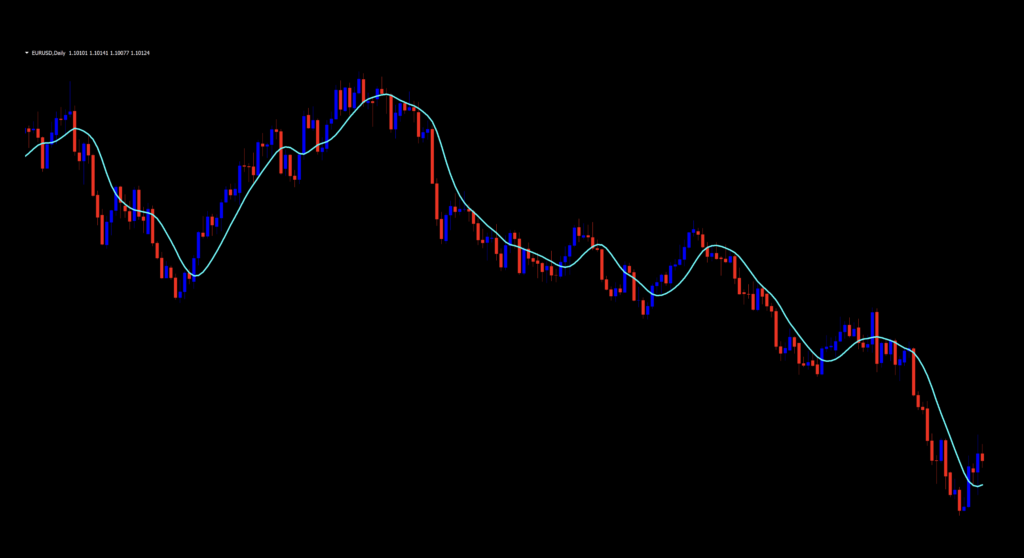
The first thing we noticed is that the default settings creates a lot of signals due to its reactivity to price. We’re going to “slow” it down a bit by increasing the number of periods to give us a better view of the signals.
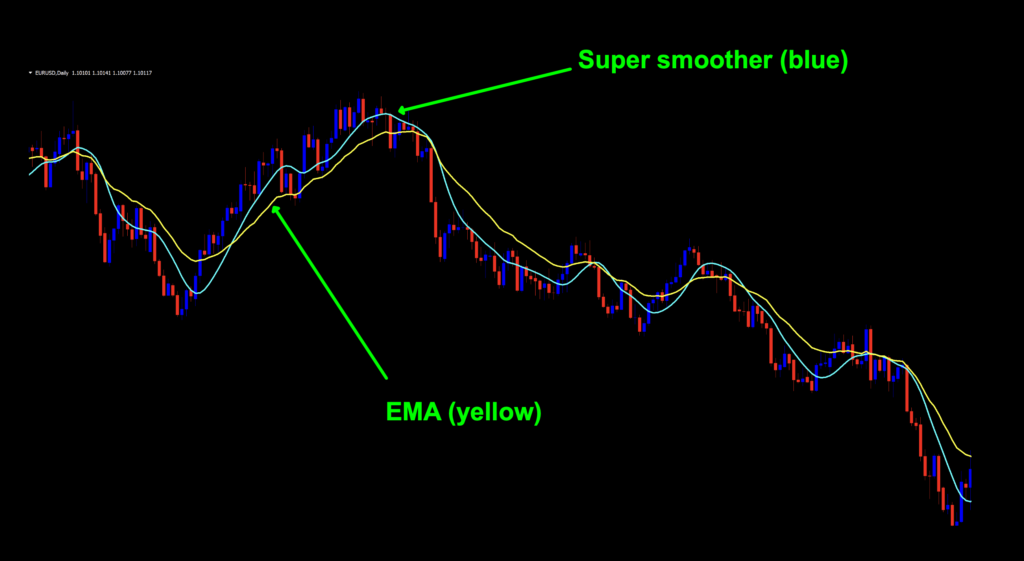
Now, we’ll add the EMA (Exponential Moving Average) in yellow.
Settings
There are only two settings, of which one of them is unused.
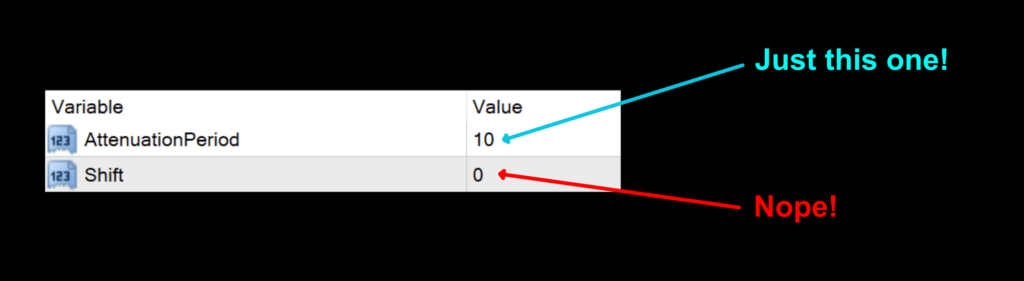
AttenuationPeriod: The length of periods considered for calculating the signal line. The default setting is 10.
Shift: The degree you can shift the line forward or backwards. A positive number moves the line backwards in time, and a negative number moves the line forward in time. The default setting is 0. Leave it at zero.
Shift and Drift
Let’s pause for a second to talk about “shift”. Why have it? Back in the day (2000s), we tried to utilize the shift function included in some indicators to try and anticipate price based on what it had already done. Of course, this is not the best way to trade as this was guessing what price may or may not do. Naturally, we never had consistent results.
Advantages
* Baselines are easy to use.
* Easy to adjust for varying markets.
* Less lag than conventional moving averages
Instead of trying to decipher each signal, we’ll zoom in on an area for analysis.
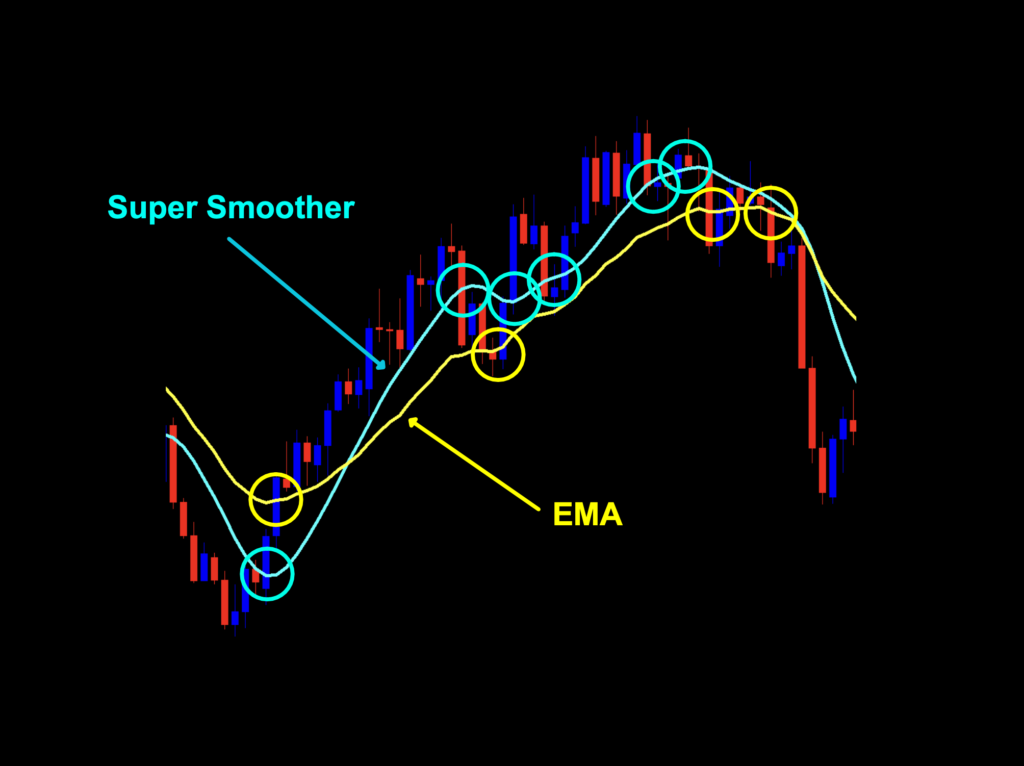
You can see from this close up image that even with a slower response from the indicator, the lag is considerably less than the EMA line. This helps identify trades earlier with potentially longer runs, and subsequently larger profits. As an exit indicator, it may be too quick, meaning it may not allow price to “breath” sufficiently without signaling an exit. Naturally, tweaking this indicator will provide varying results.
How We Use It
Long signal – When a candle crosses AND CLOSES above the signal line. The entry occurs on the open of the next candle.
Short signal – When the candle crosses AND CLOSES below the signal line. The entry occurs on the open of the next candle.
Testing the Super Smoother
If you’re new to these studies, we recommend looking at some of the older blogs to understand how we conduct our testing.
The six pairs we recommend testing are…
EUR/USD
AUD/NZD
EUR/GBP
AUD/CAD
CHF/JPY
CAD/SGD
The markets we test our indicators are the:
EUR/USD (Euro/US Dollar)
BTC/USD (Bitcoin/US Dollar)
XAU/USD (Gold/US Dollar)
SPX500 (S&P500 Index)
Timeframes and Results
We’ll run the Super Smoother indicator on the EUR/USD, BTC/USD, XAU/USD, and the SPX500 using the default and tweaked settings across the daily and 4-hour timeframes on the MT4 strategy tester.
We focus on three metrics;
Total trades
Win/Loss ratio
ROI (return on investment)
The Results Are In
Below is the data from our testing…
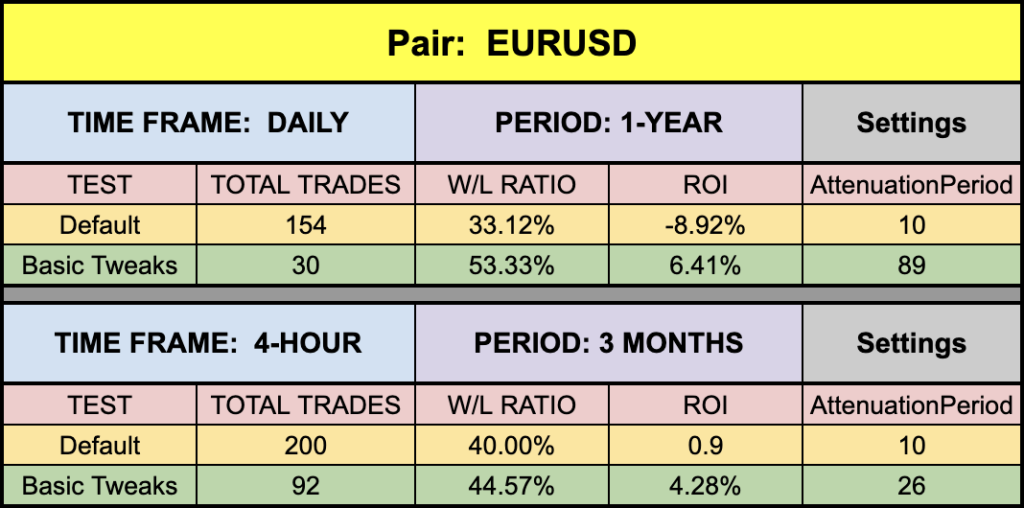
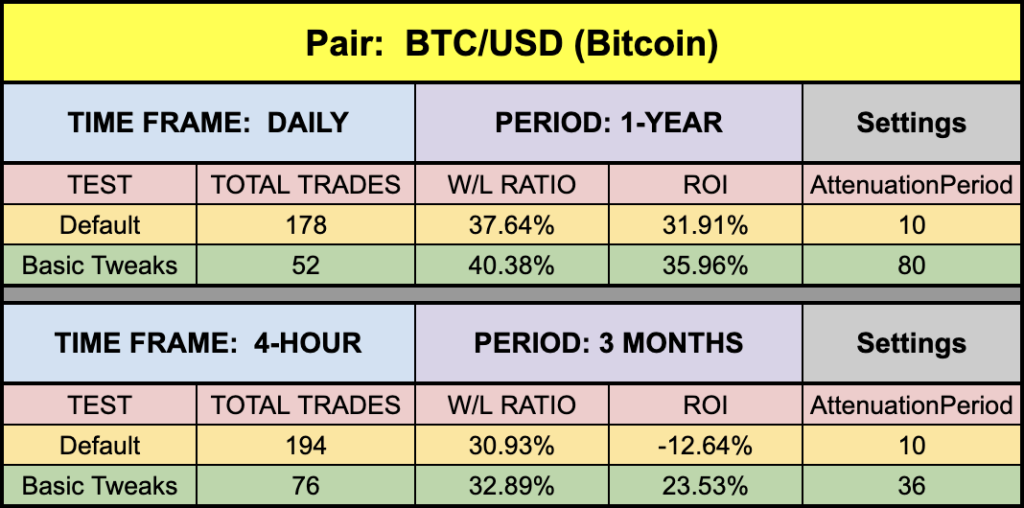
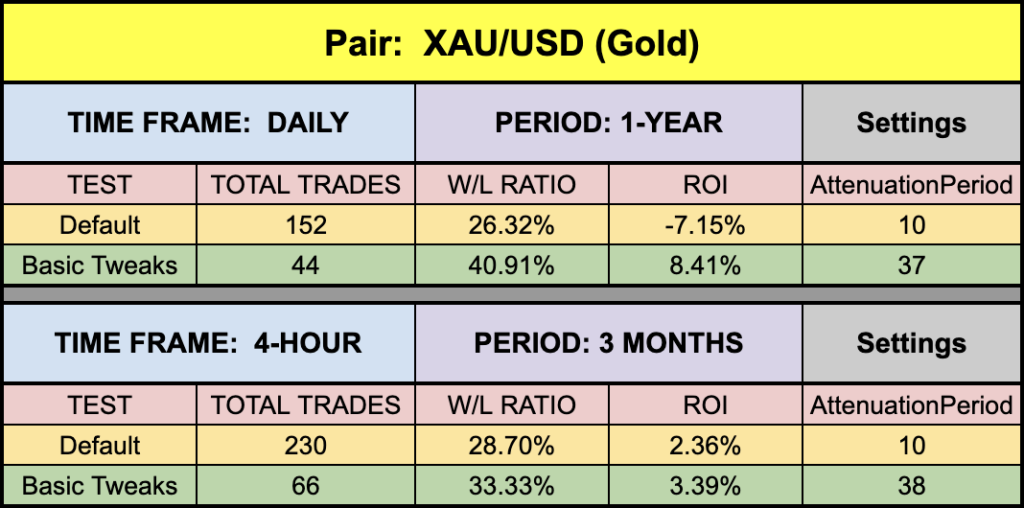
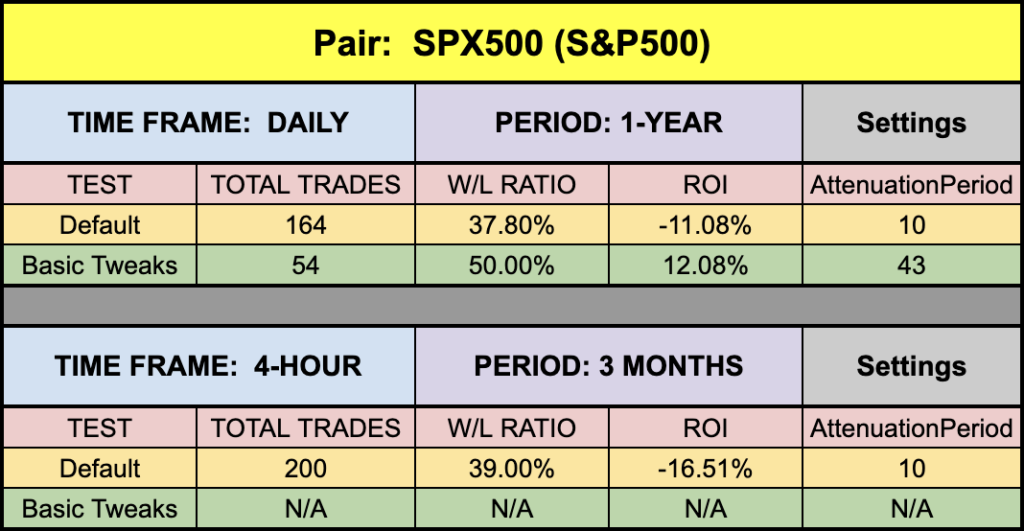
The green highlighted rows are the tweaks we found which returned better results. Are they fully optimized? No, that would make no sense because the numbers change every day. We’re just demonstrating indicators which can be made better. The settings are not to be considered trading advice – they are for educational and illustrative purposes only.
And most importantly, never…ever…ever use just one indicator to make your trading decisions. Always have an algorithm, or system to raise your trade confidence.
Money Management
Money management is based on the NNFX risk profile. That information can be learned in the Advanced Course.
Resources
We’ve made the Super Smoother indicator available for download on our site from the indicator library. When you’re ready to get it, click HERE.
We’re Here For You
Sign up on our contacts page on the website for the latest digests. Subscribe to our YouTube channel and Facebook page. We also answer questions on Quora related to Forex. Visit Trustpilot to see what others are saying about us as well.
Our only goal is to make you a better trader.
BTW – Any information communicated by Stonehill Forex Limited is solely for educational purposes. The information contained within the courses and on the website neither constitutes investment advice nor a general recommendation on investments. It is not intended to be and should not be interpreted as investment advice or a general recommendation on investment. Any person who places trades, orders or makes other types of trades and investments etc. is responsible for their own investment decisions and does so at their own risk. It is recommended that any person taking investment decisions consults with an independent financial advisor. Stonehill Forex Limited training courses and blogs are for educational purposes only, not a financial advisory service, and does not give financial advice or make general recommendations on investment.