Normal/Abnormal
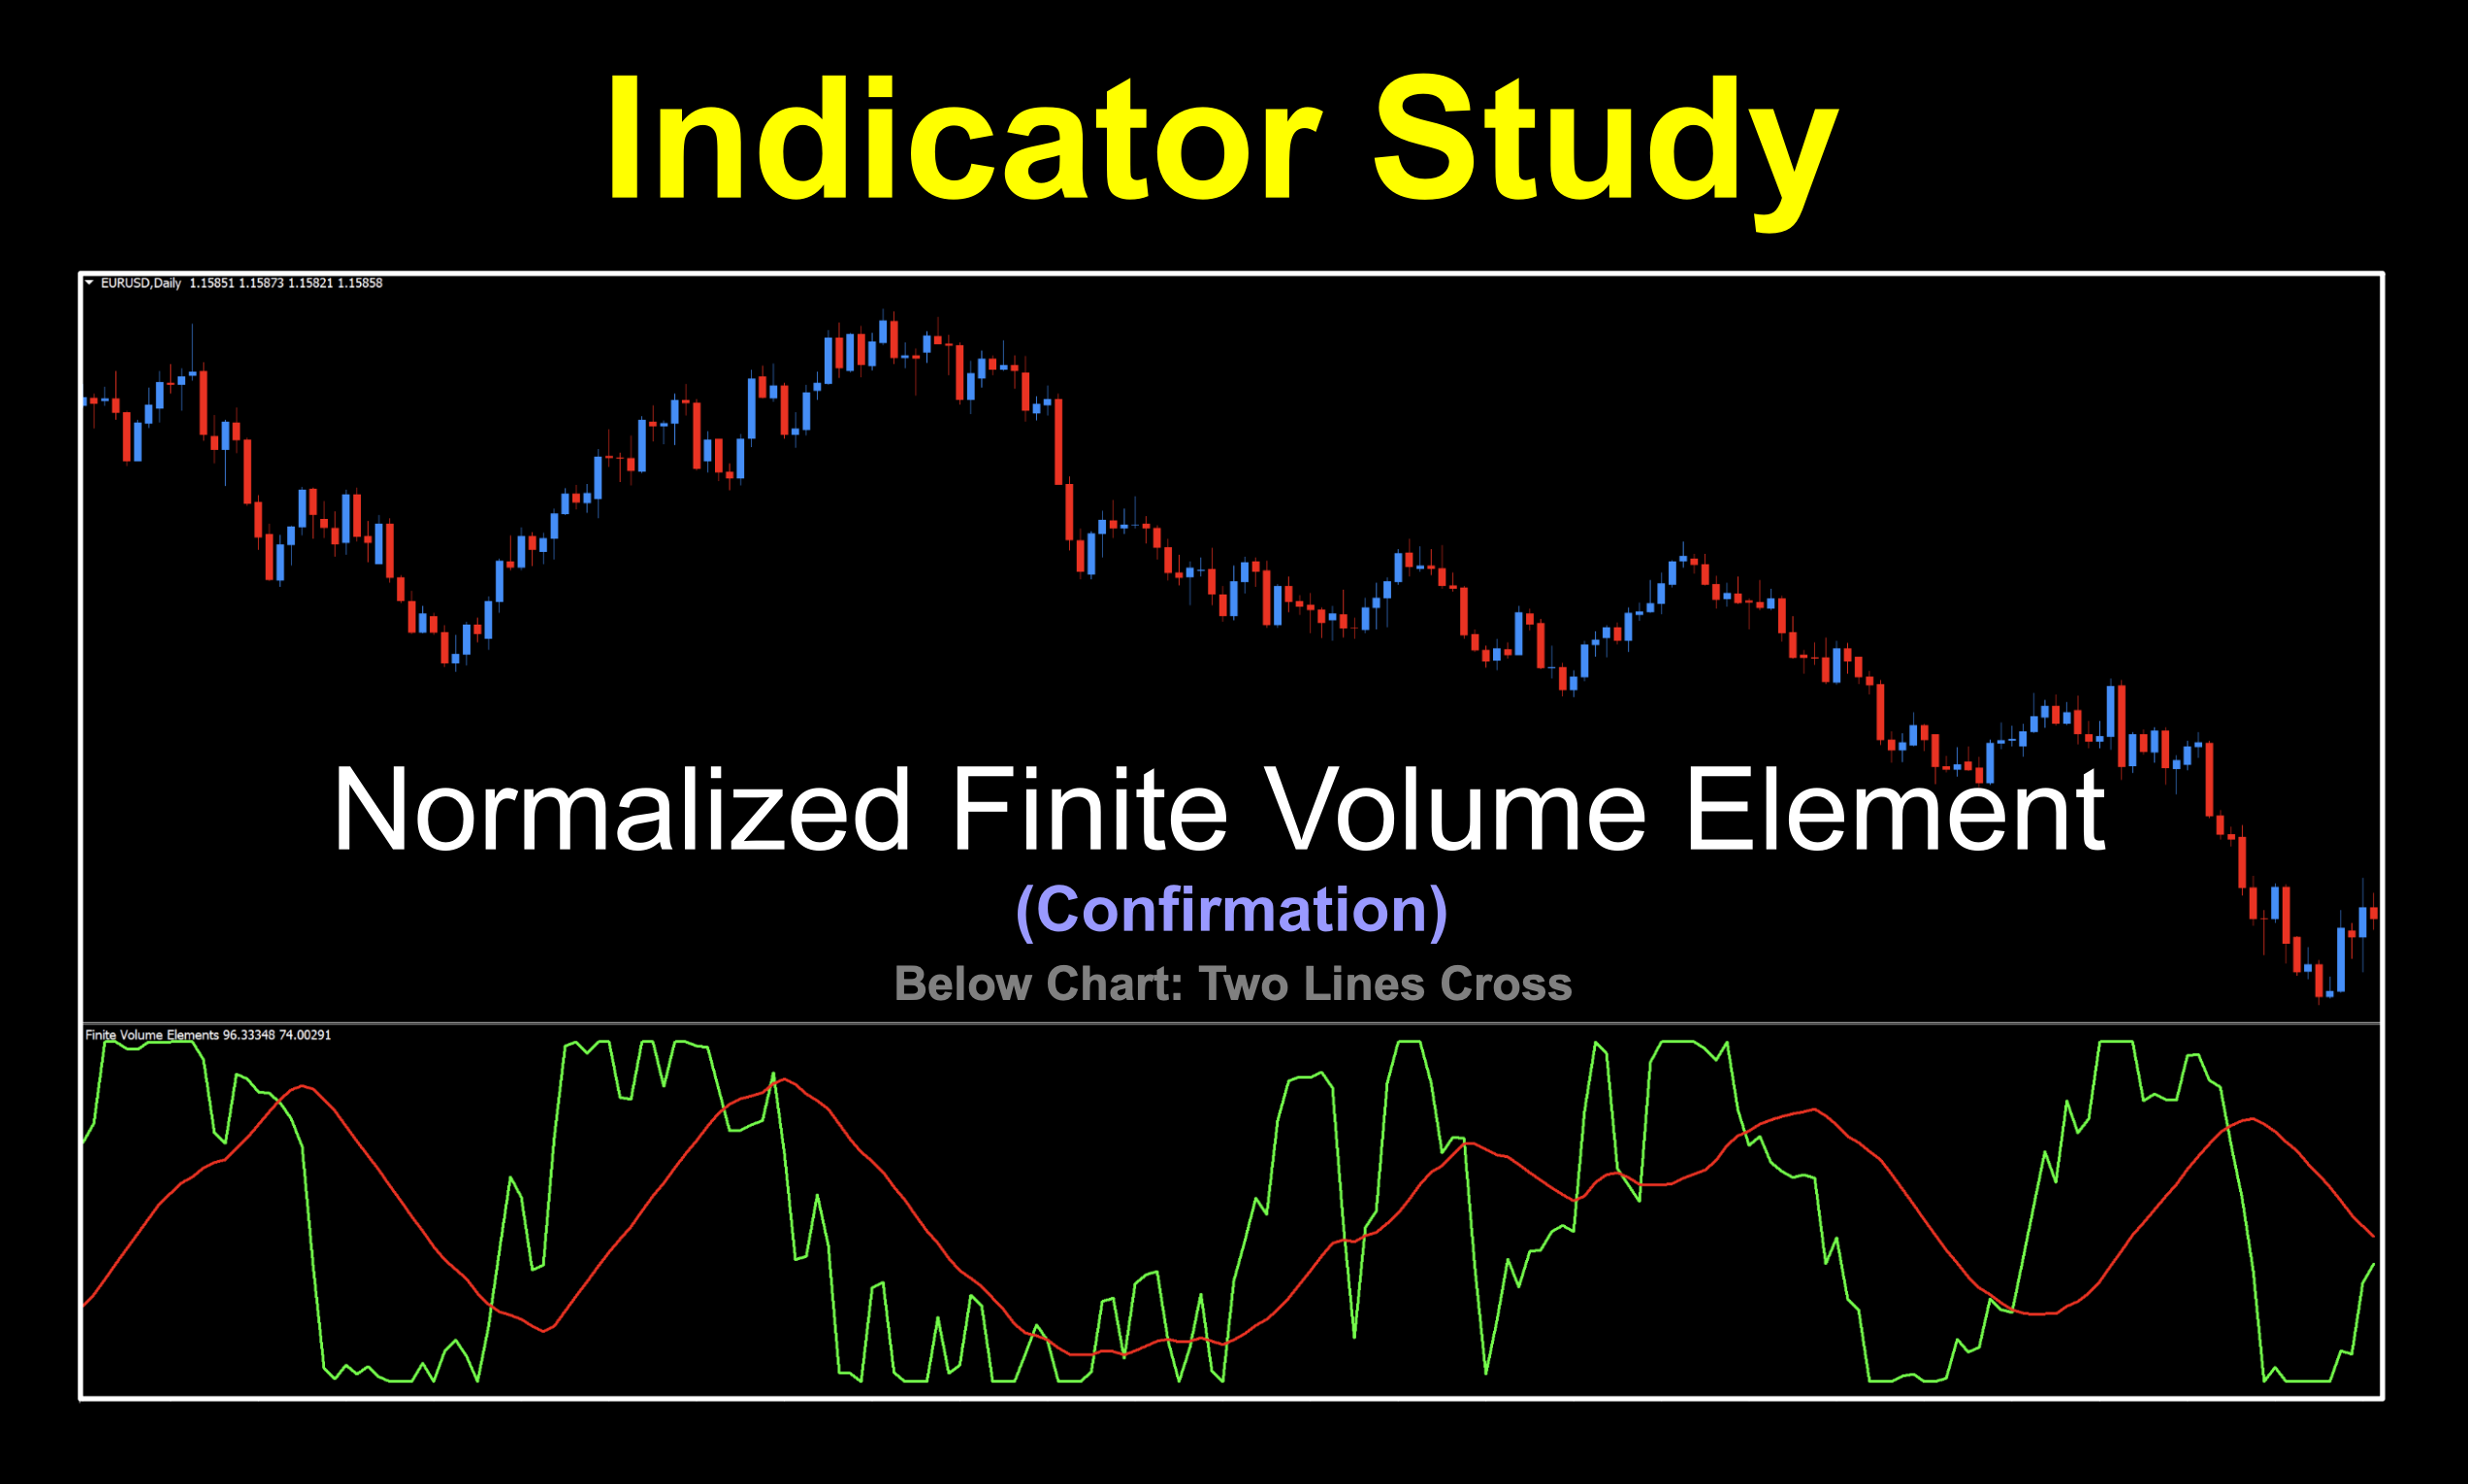
Sometimes it pays to take a second look at an indicator. We decided to revisit the Finite Volume Element indicator from Markos Katsanos we did a few weeks ago and check out the “Normalized” version. A funny thing came to mind. It’s old, but anybody who’s been around for a bit might remember this scene.
What is Normalized
“Normalizing” an indicator sounds like a weird thing. I mean, wasn’t it normal before? Was it abnormal? See where I’m going with this? After scouring the interwebs and uncovering more information than I cared to discover, we spent some time condensing it into more bitesized pieces which are easier to understand.
How Old Are You
The exact date of the normalized version of the FVE wasn’t specifically stated although sources suggest it was a couple of years after the original. That would place it around 2005 to 2006 but the indicator we’re using was coded in 2020. Let’s check out the rest of the story.
Part 1 – The Explanation
The normalization period (one of the settings you’ll see below) is the lookback window used to scale, or “normalize” volume values so they can be compared consistently over time. The issue is that raw data can vary wildly depending on the pair or timeframe. The normalization period takes a fixed number of past bars (e.g., 20, 50, 100 periods) and uses them to compute a reference range—typically something like:
- highest volume in that period
- lowest volume in that period
- or an average/standard deviation
Then the current volume is rescaled relative to that window, often into a bounded range (like 0 to 1 or -1 to 1).
Trouble With The Curve
If you’ve ever been in a class where nearly everybody failed an exam, the instructor sometimes grades things on a curve. The same applies here:
- If today’s volume is high compared to the last number of periods, it scores near the top of the range
- If it’s low relative to that same window, it scores near the bottom.
Why Does it Matter
The normalization period controls the indicator’s reaction to price; sensitivity or stability.
- Shorter lookback periods like 10 – 20;
- Very reactive
- Adapts quickly to recent changes
- More noise / false signals
- Longer lookback periods like 50 – 100;
- Smoother and more stable
- Better for spotting major volume shifts
- Slower to react
Part II – The Calculation
We talked about the basic calculations of the original version in that log, but the next step explains the normalization portion.
NFVt=FVt(smooth)−min(FV(smooth),N)max(FV(smooth),N)−min(FV(smooth),N)
NFV_t = \frac{FV^{(smooth)}_t – \min(FV^{(smooth)}, N)}{\max(FV^{(smooth)}, N) – \min(FV^{(smooth)}, N)}
NFVt=max(FV(smooth),N)−min(FV(smooth),N)FVt(smooth)−min(FV(smooth),N)
Where:
- NNN = normalization period
- max(…,N)\max(…, N)max(…,N) = highest value over last N bars
- min(…,N)\min(…, N)min(…,N) = lowest value over last N bars
Part III – The Output
Output is usually scaled between 0 and 1 or -1 to +1. Either one tells the same story. Mathematically, it looks like this:
NFV(scaled)=2×NFVt−1NFV^{(scaled)} = 2 \times NFV_t – 1NFV(scaled)=2×NFVt−1
Part IV – Wrapping It Up
To sum it all up in a nutshell, the “NNN” in the formula defines the rolling window for min/max.
- Directly affects the denominator: max−min\max – \minmax−min
So a smaller number of periods means a tighter range where the indicator stretches more easily and the signal line is more sensitive to changes in the market. A larger number of periods means a wider range where it’s more difficult to reach extremes and is therefore, more stable.
Class Dismissed
That was some research project but we felt that you should have a basic understanding of why we’re doing a slightly different version of what is essentially the same indicator. Of course, the proof is in the testing…as we shall soon see.
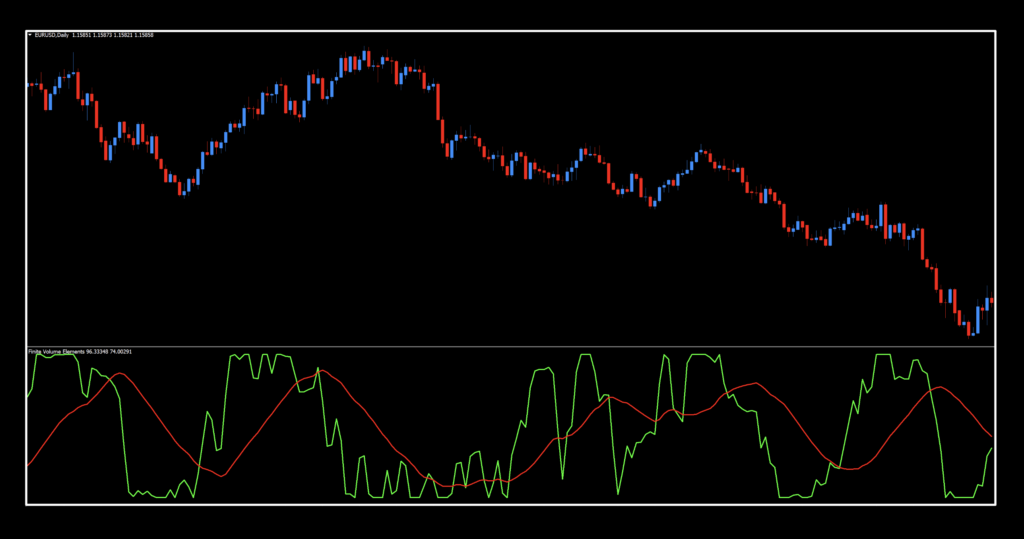
Let’s Take a Peek
With all that great information under our collective belts, let go see what this actually looks like.
Side By Side
Lets stack the regular version with the normalized version so you can actually see the difference. We’re keeping things on the default settings so it’s “apple to apple”.
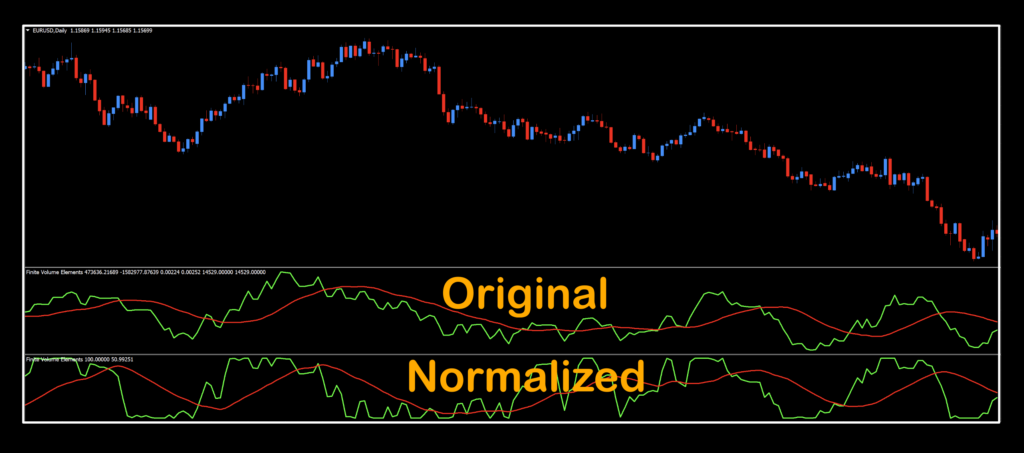
Looking closely, you can spot some small differences, but over time, those differences can result in better trades.
Settings
This indicator five settings (one extra than the original version) and yes, we use them all.
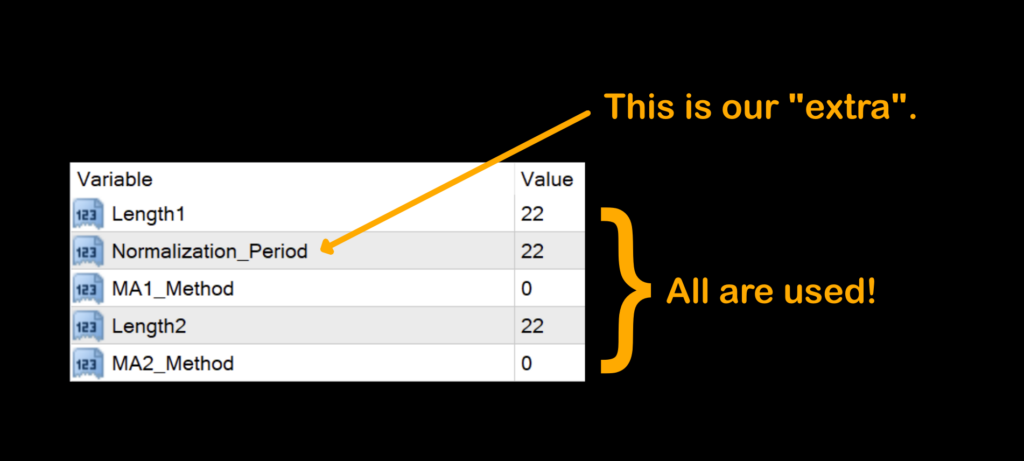
Length1: The number of periods which affect the FVE calculations (also affects the CINTRA – Intraday Coefficient and the CINTER – Interday Coefficient) and is the green line. The default setting is 22.
Normalization_Period: This is the “extra” which controls the number of periods in normalizing the output. The default setting is 22.
MA1_Method: The data set used in the Length1 variable where 0 – SMA, 1 – EMA, 2 – SMMA, and 3 – LWMA. The default value is 0 – SMA.
Length2: The number of periods for the moving average (red line). The default value is 22.
MA2_Method: The data set used in the Length2 variable where 0 – SMA, 1 – EMA, 2 – SMMA, and 3 – LWMA. The default value is 0 – SMA.
Daily Check-In
Once you’re ready to perform daily maintenance on your trades during the last 20–30 minutes of the trading day (1700 New York time), you’ll be presented with one of four options.
- Opening a trade.
- Closing a trade
- Maintaining a trade; i.e.
- Moving a stop loss level.
- Exiting a trade.
- Taking a pass (nothing to do).
Check It Out
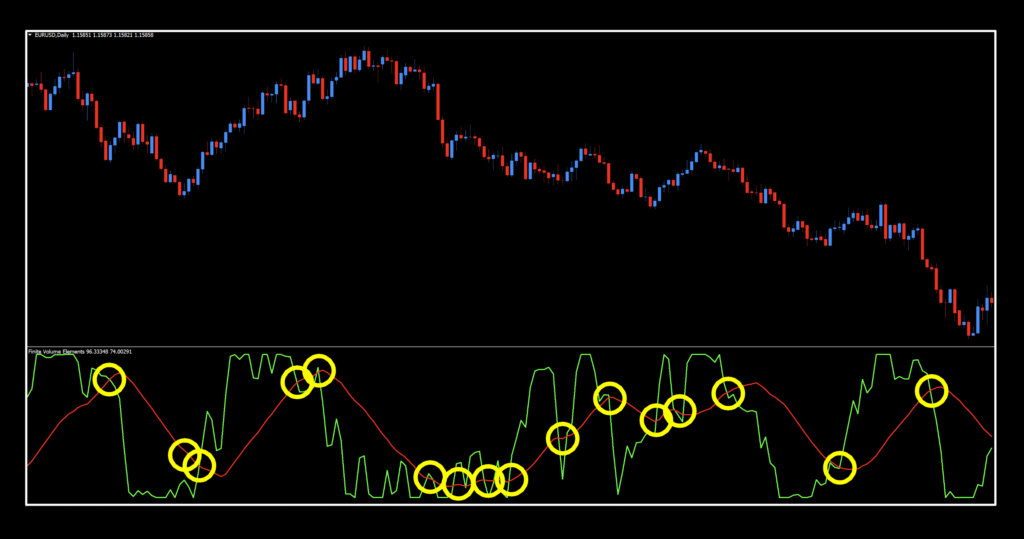
Comparing it to the original version, there are definitely more signals. That’s totally okay because we’re able to really tweak this indicator for some pretty stellar results. The coolest thing is that these were not the best settings.
Here They Are
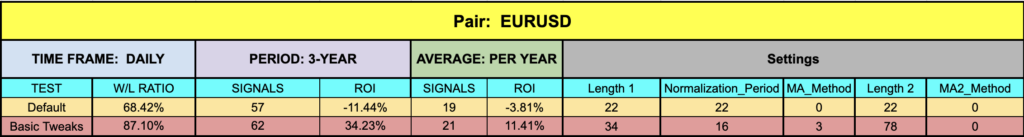
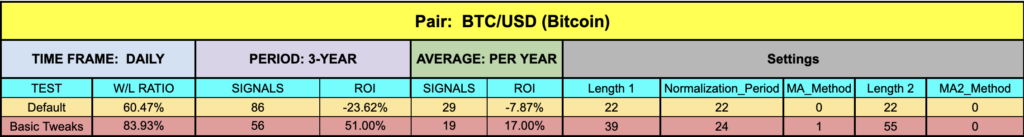
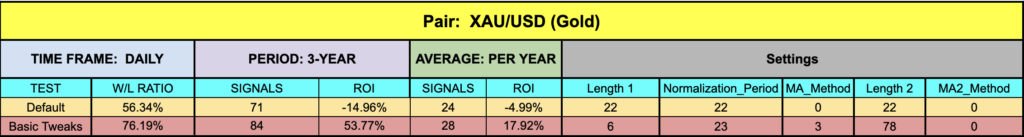
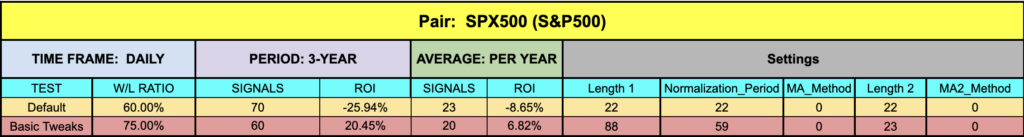
Really nice output on those tweaked settings. As mentioned, they are not the best we found but as we always say, that’s not the point of what we do. We give you a place to start and the rest is up to you. But the SPX500 and the EUR…we haven’t seen those in some time. We’re glad to be able to bring you something that could be your newest and sharpest tool in the trader’s toolbox. Now, go get it and get to work!
Resources
You can get this absolute banger for free and it’ll have “NEW” in red to alert you to its location. Get it HERE. Additionally, be sure you’re subscribed to the Stonehill Forex YouTube channel so you can see this beast in action. The Advanced NNFX Course is HERE to help fast track your trading career so you can cut your learning time in a fraction of conventional methods.
Our only goal is to make you a better trader.
*Our published testing results are based on money management strategies employed by the NNFX system and depend on varying external factors, which may be different between individuals and their specific broker conditions. No guarantee, trading recommendations, or other market suggestions are implied. Your results and subsequent trading activities are solely your own responsibility.
BTW — Any information communicated by Stonehill Forex Limited is solely for educational purposes. The information contained within the courses and on the website neither constitutes investment advice nor a general recommendation on investments. It is not intended to be and should not be interpreted as investment advice or a general recommendation on investment. Any person who places trades, orders or makes other types of trades and investments etc. is responsible for their own investment decisions and does so at their own risk. It is recommended that any person taking investment decisions consults with an independent financial advisor. Stonehill Forex Limited training courses and blogs are for educational purposes only, not a financial advisory service, and does not give financial advice or make general recommendations on investment.