Polychromatic Momentum
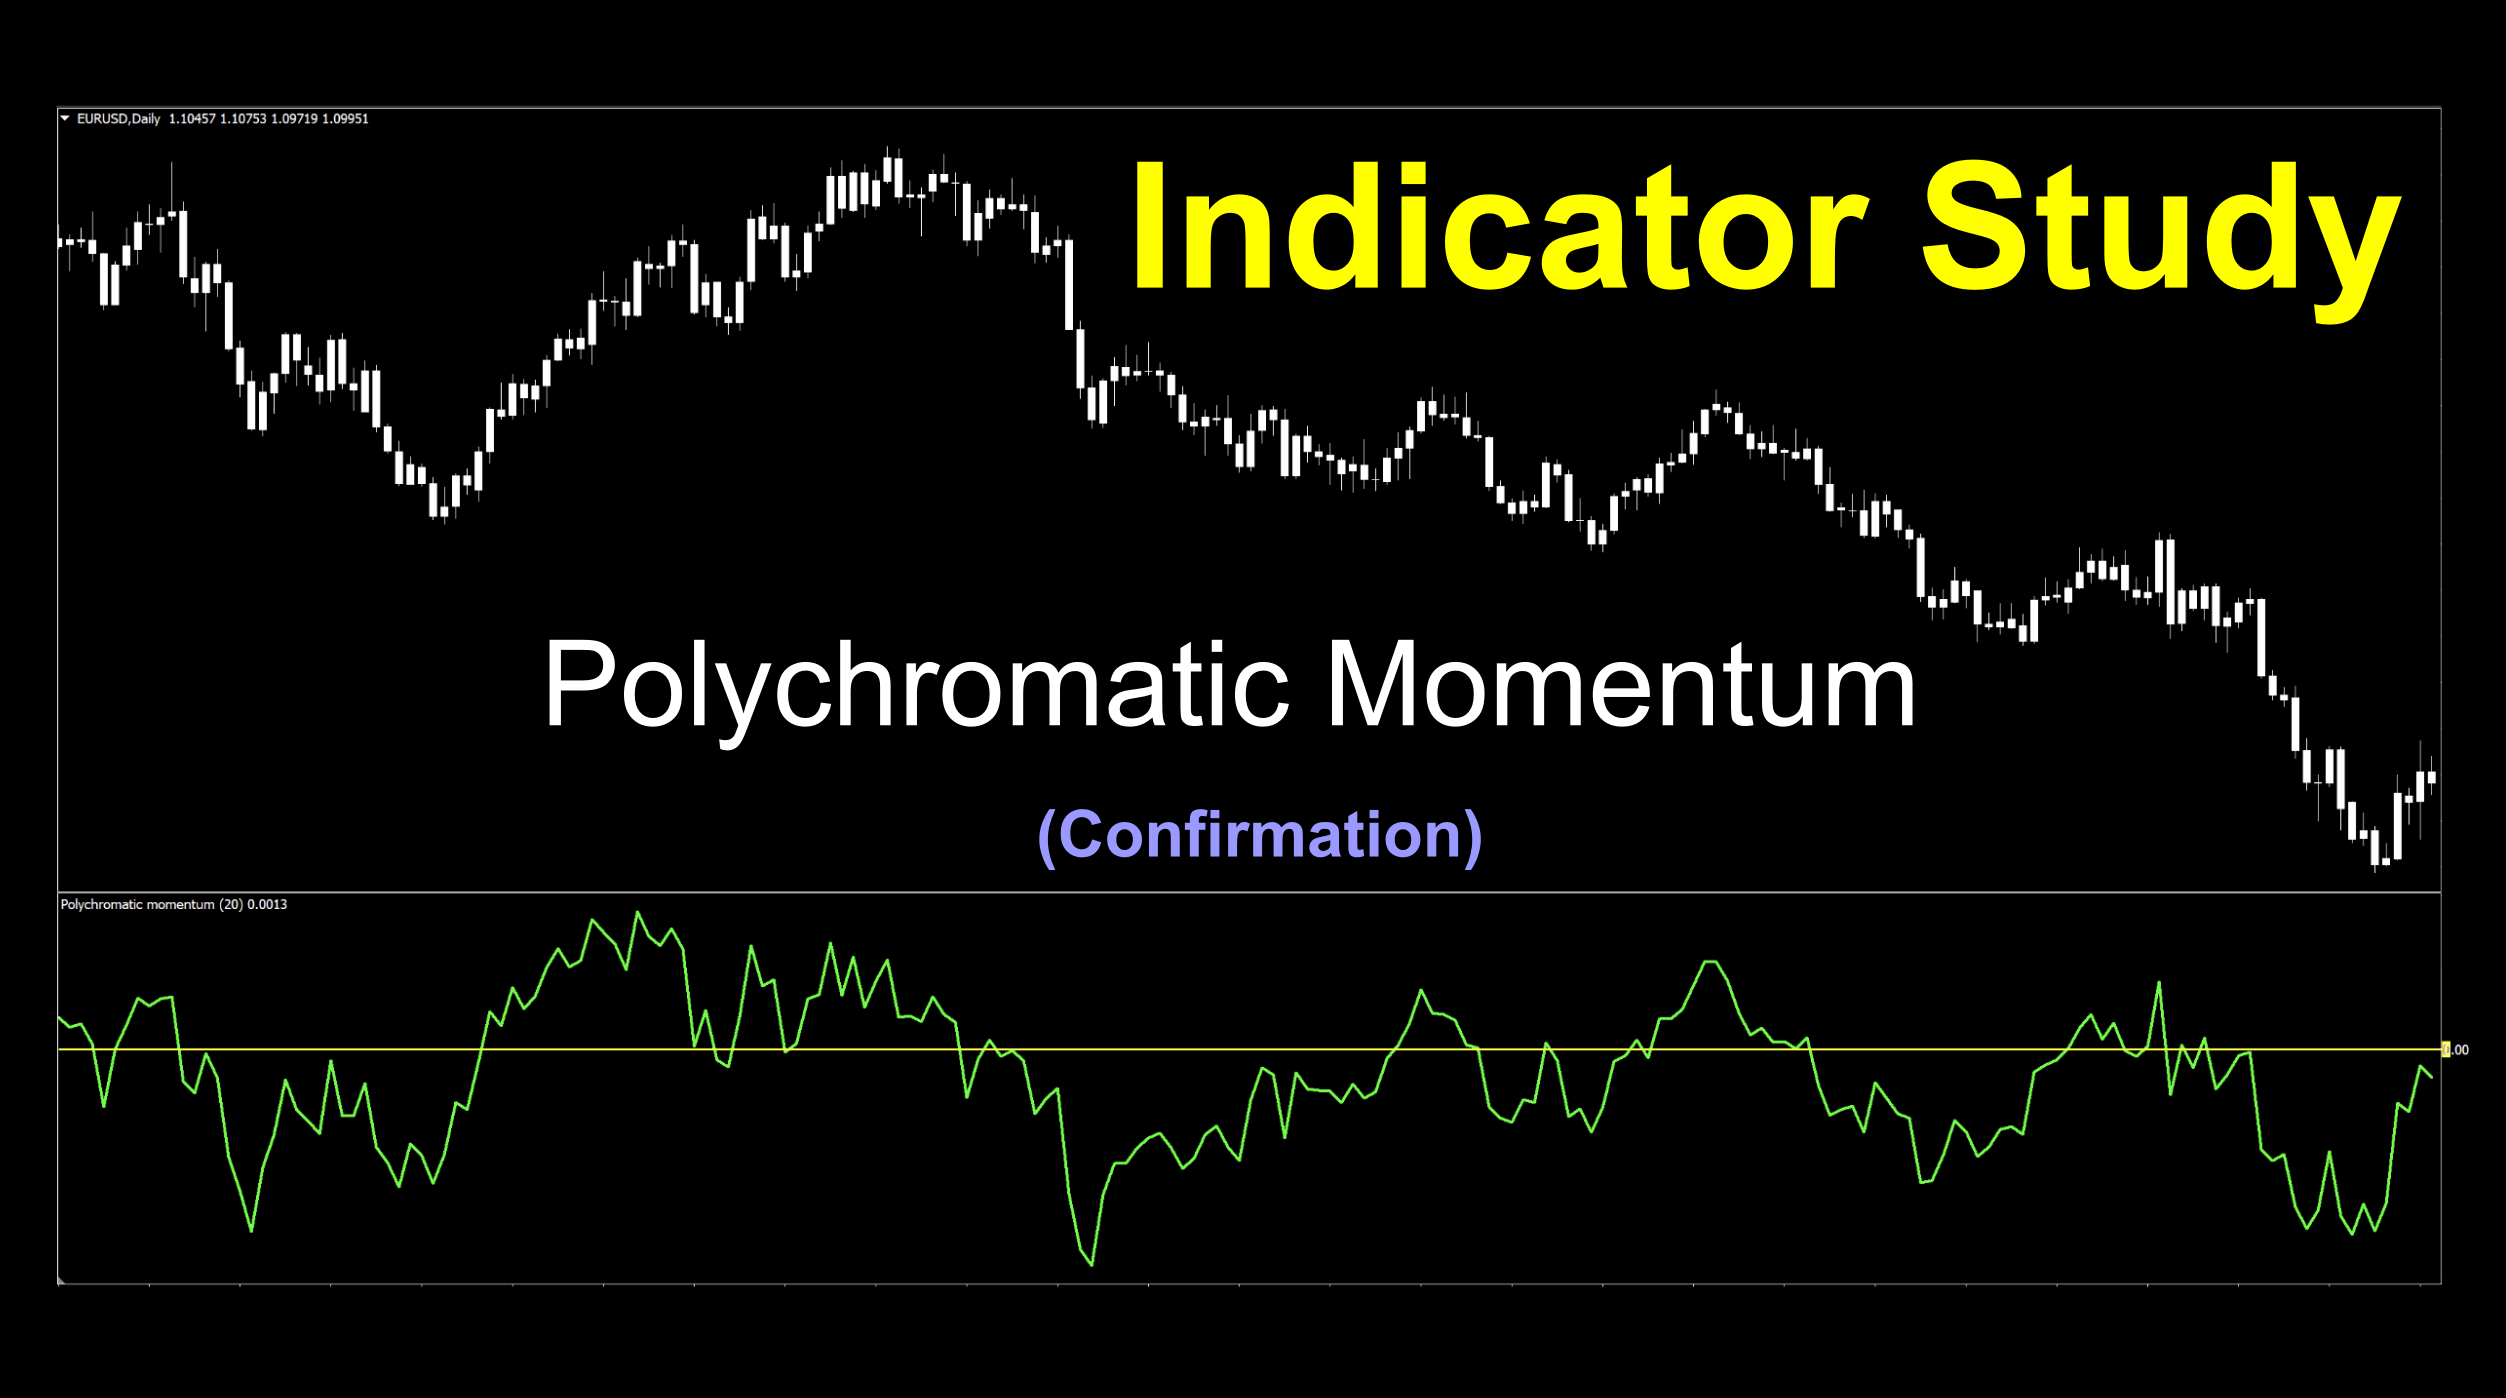
Color My Momentum
When we saw this title, we had to check it out. Coincidently, the word “polychromatic” is actually constructed of two words of Greek origin; “poli” coming from the word “πολλά” (polla) meaning many and “chromatic” from the word “χρώμα” (xroma) meaning color.
That being the case, we thought we were going to find something with a rainbow of colors. We did not – at least with this version. While there are other versions of this indicator which do have a multitude of colors, appearances can sometimes create more confusion than we bargain for. So, we went with simple.
Technical Work Up
The video on this one is pretty straight forward, with some interesting price/indicator interaction. We’re continuing to bring you this feature, so you can decide if you want to try the indicator for yourself. Sit back for a moment and enjoy the show.
Smarty Pants
The Polychromatic Momentum indicator was based on work by a super smart bloke named Dennis Meyers, who happens to have a Ph.D., written articles for Stocks and Commodities Magazine, and is the architect of this concept which was introduced in a 2002 academic article.
What Momentum Really Is
You’ve read the word “momentum” in some of these blogs, and we figured, let’s define it as described by someone who genuinely walks the walk. We’re just going to quote Dr. Meyers because…well, just because.
“Momentum is defined as the distance, or percentage change between the current bar (or candle) and a bar (or candle) some look back period in the past.”
Everybody still with me?
Changes in Latitude, Changes in Attitude
He goes on to explain that the issue with momentum is that it always changes over time and doesn’t “jive” well with the current look back period. That being said, he created an indicator that was able to take all the weighted averages of all the significant look back periods. He noted that the name (which I explained earlier) was a nod to the fact that the indicator is the sum of many momentums (momenta).
Simple is as Simple Does
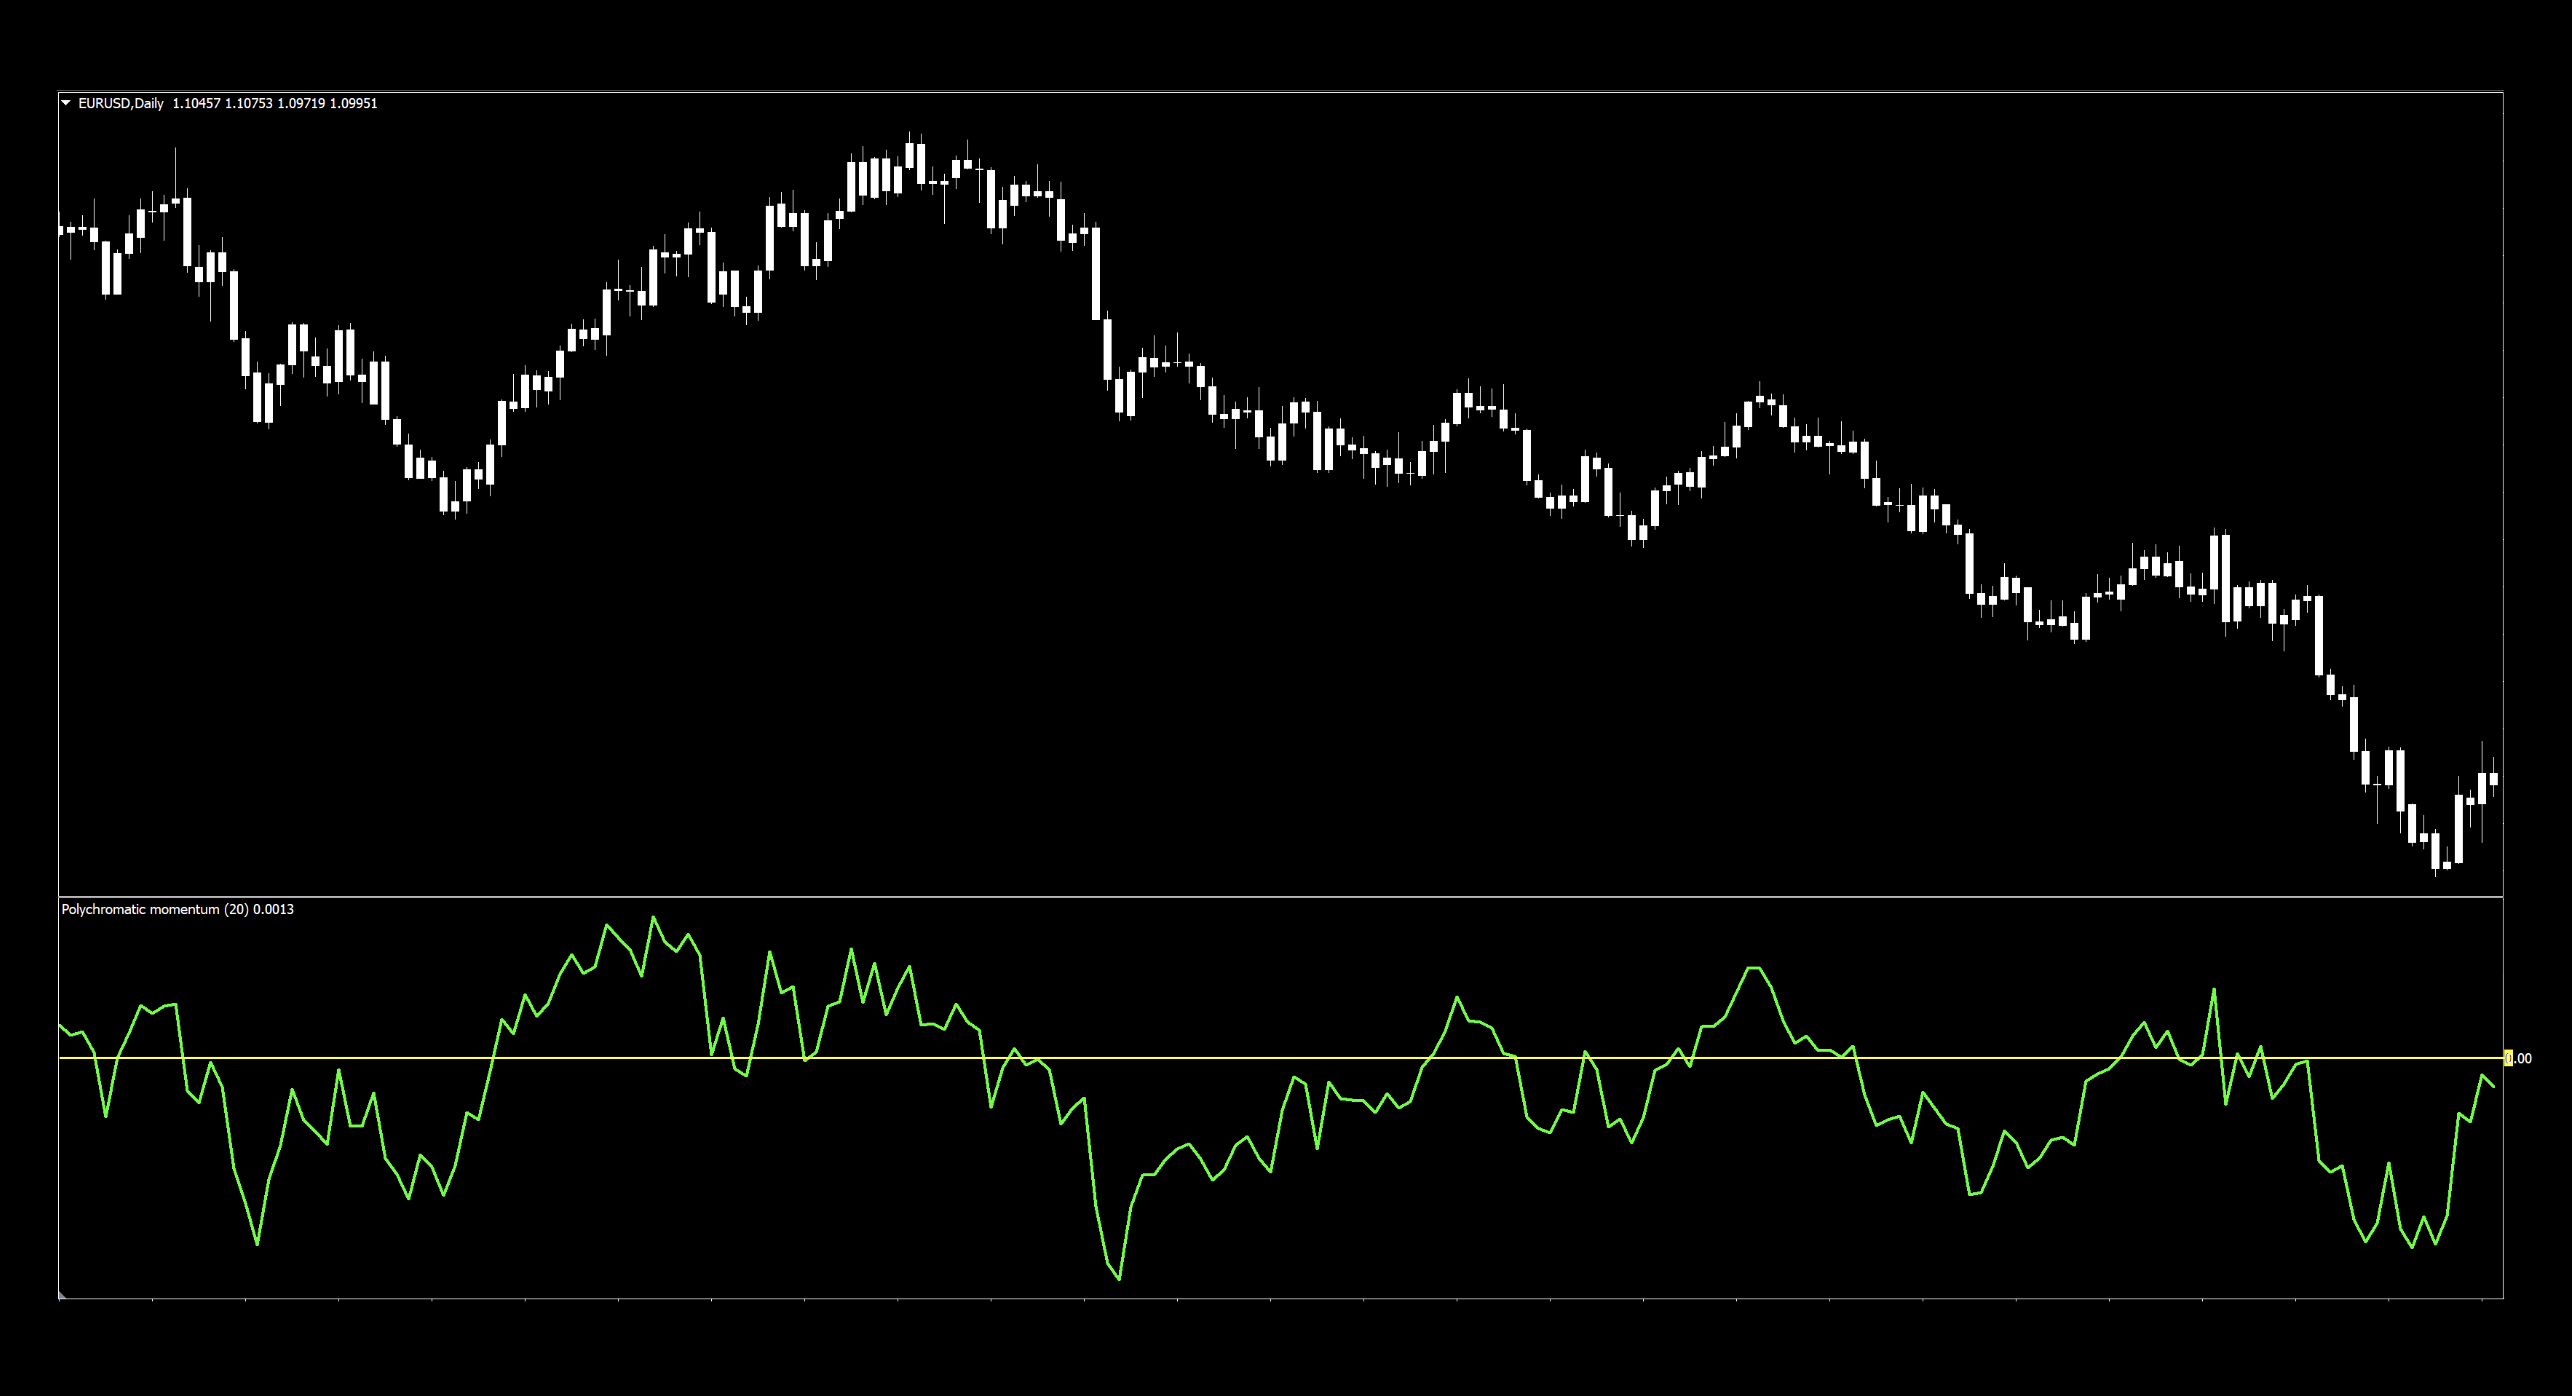
There wasn’t much adjustment needed for this indicator. The default signal line is “lime” so we just made it thicker. The zero line is “dark slate gray”, so we changed it to yellow and thickened it up a bit. Of course, if your background color is different from ours, then different colors may be preferred…
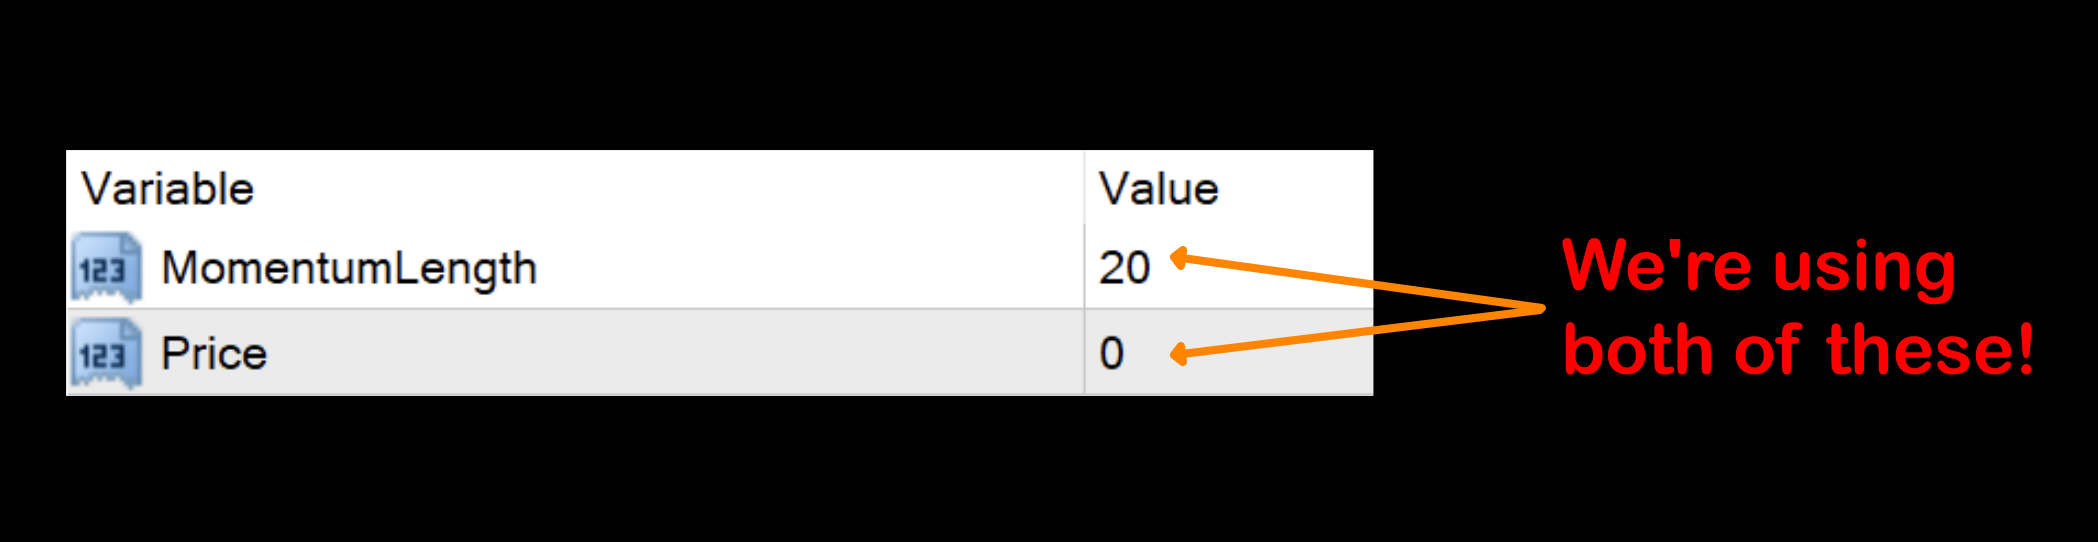
The Polychromatic Momentum indicator only has two settings. We use both of them.
Settings
We’re also going to explain why the default settings are what they are.
MomentumLength: The number of periods the formula uses to create the signal line. The default setting is 20.
Price: The data set used for the calculations. 0-Closed, 1-Open, 2-High, 3-Low, 4-Median, 5-Typical, 6-Weighted. The default setting is 0-Closed.
Advantages
* Easy to see signals – single color, signal level.
* Few settings for quicker testing.
We’ll take a look at the signals on the default chart and see how Polychromatic Momentum indicator presents in various market conditions.
How We Use It
Long signal – When the signal line crosses and closes above the zero line. The entry occurs on the open of the next candle.
Short signal – When the signal line crosses and closes below the zero line. The entry occurs on the open of the next candle.
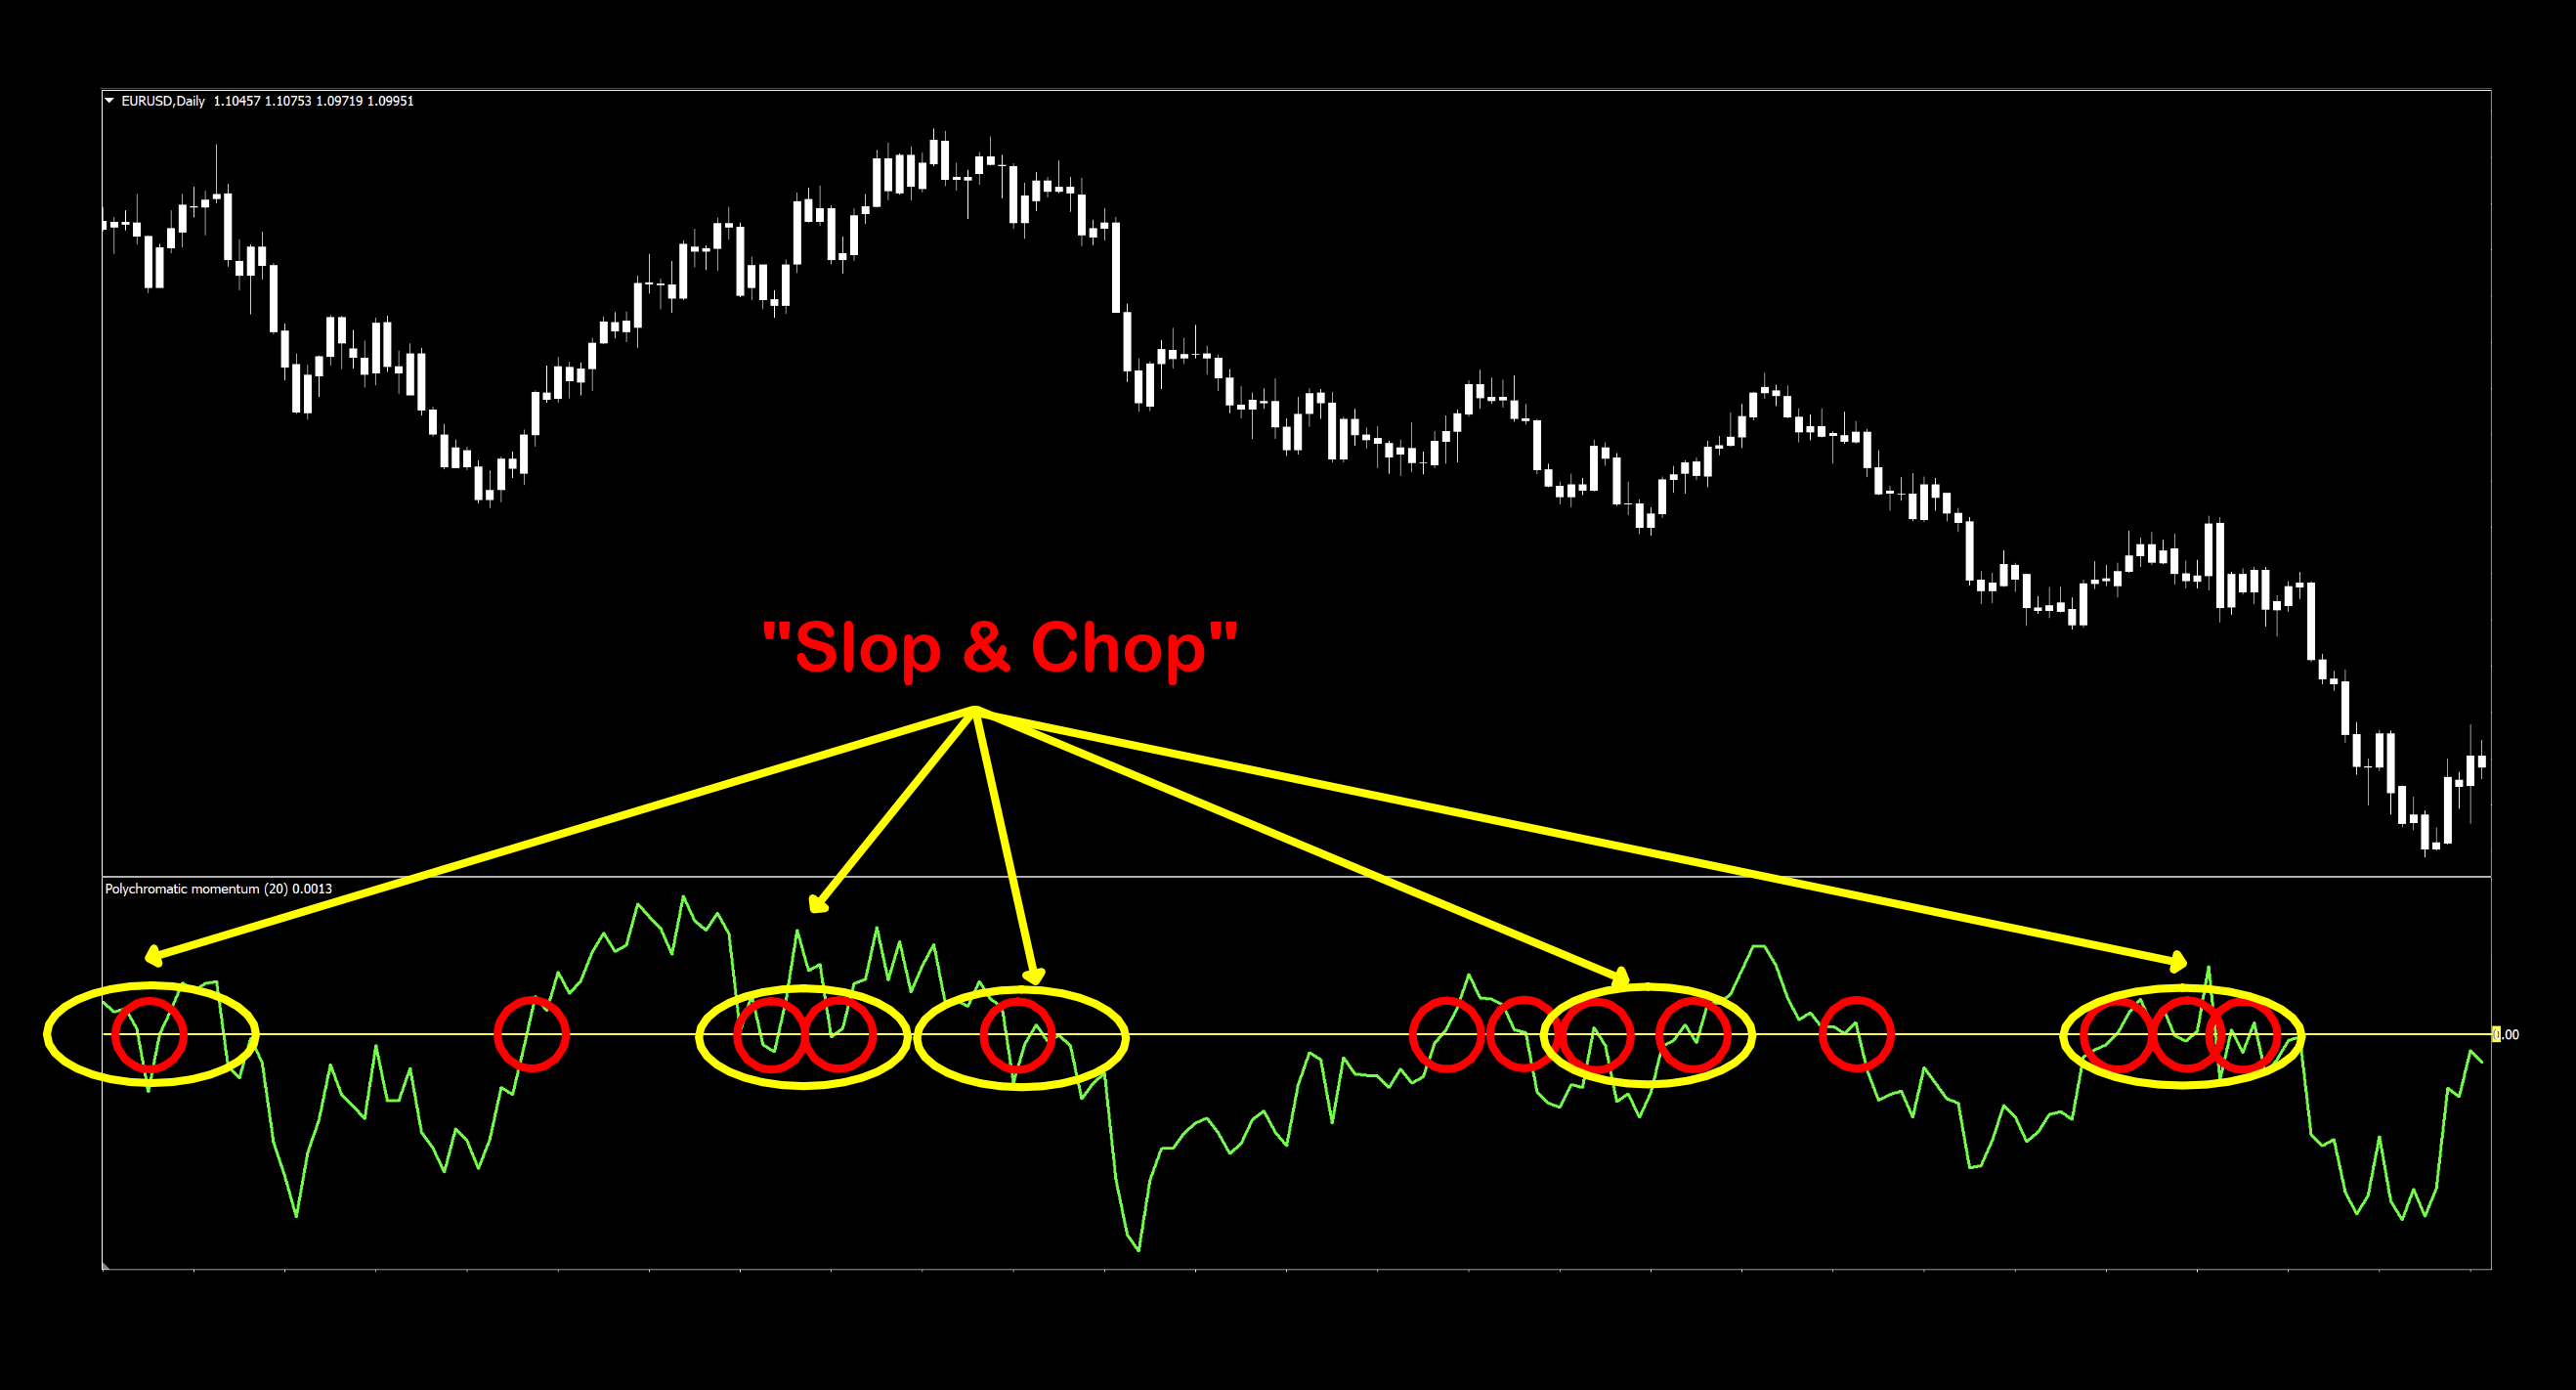
Slop & Chop
We immediately noticed two things; the signal line’s jagged appearance and some congestion along the zero line. Fooling around with the two settings smoothed the signal line, but not much. The double edge sword here is that the indicator does react quickly to price change and therefore boasts less lag than other indicators…but, its ragged appearance may give rise to false signals. This leads us to the second issue; congestion at the zero line. Like other indicators who exhibit this quality, the best defense is to have a quality algorithm that may prevent taking a trade resulting in a loss.
Testing…Testing…Testing…
Remember, comprehensive analysis is strongly suggested, and we advocate backwards and forward testing indicators or systems prior to trading actual funds. We propose conducting your tests on the following pairs.
EUR/USD
AUD/NZD
EUR/GBP
AUD/CAD
CHF/JPY
CAD/SGD
If it doesn’t work on these 6 pairs, chances are it won’t work on other pairs. This is not an absolute, but we’ve found this rule is reliable in most cases.
The markets we test our indicators are the:
EUR/USD (Euro/US Dollar)
BTC/USD (Bitcoin/US Dollar)
XAU/USD (Gold/US Dollar)
SPX500 (S&P500 Index)
Timeframes and Results
In our initial test, we’ll run the Polychromatic Momentum indicator on the EUR/USD, BTC/USD, XAU/USD, and the SPX500 using the default settings across the daily and 4-hour timeframes on the MT4 strategy tester. We use the fast method of testing the indicator to get a general idea; however, you may also run the tick-by-tick data set for a more precise result (which takes considerably more time).
As No Nonsense Traders – and therefore Swing Traders, we will not examine shorter time frames in these studies. We will also run an additional test, using different values for the settings, to analyze which one may work better and examine the following results:
Total trades
Win/Loss ratio
ROI (return on investment)
There are other metrics included in the strategy tester report, which can be compared, but these three metrics provide the necessary gauge to make quick decisions as to the usefulness of a particular indicator and its settings.
Next, for comparison, we’ll explore the following;
Daily – 1 year
4-hour – 3 months
The reason exceptionally long (or short) testing periods are not included is due to changing market conditions, which might return irrelevant information. A balance of statistically significant data is necessary for accurate results.
And the Outcome…
Below are the spreadsheets illustrating the results from our tests.
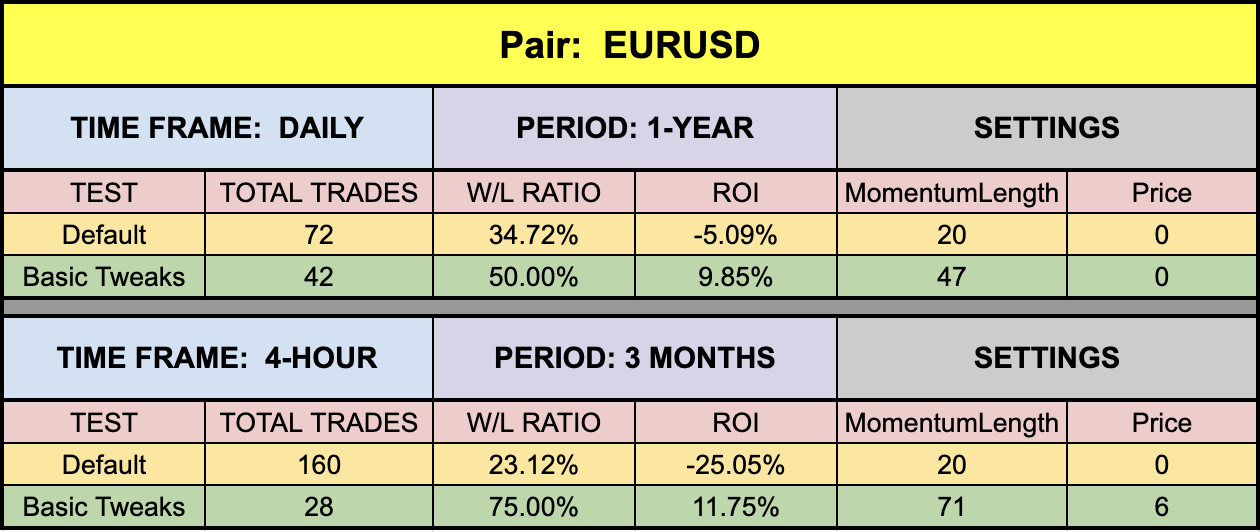
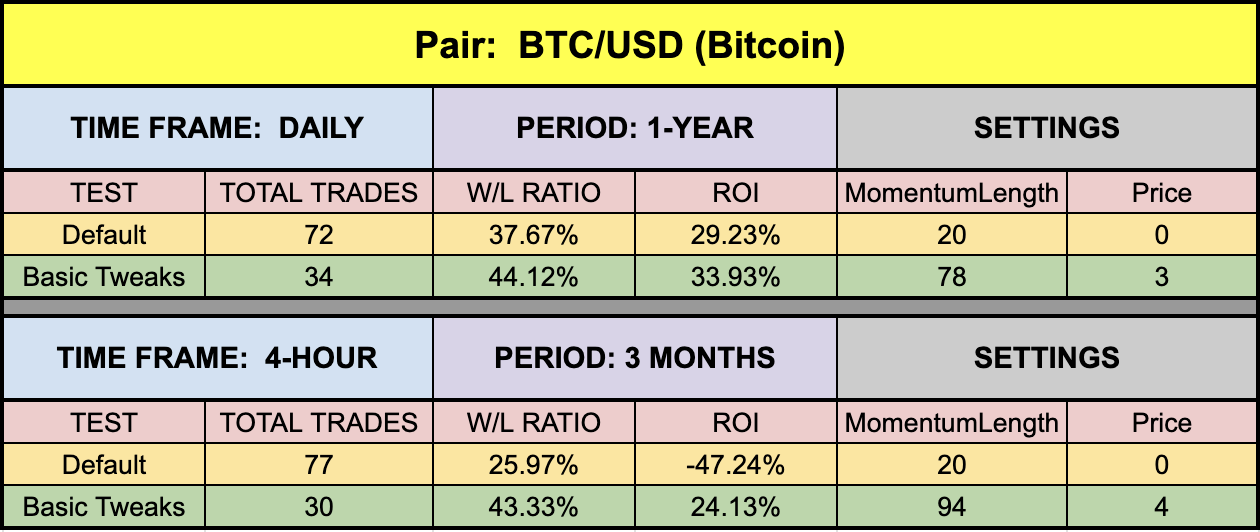
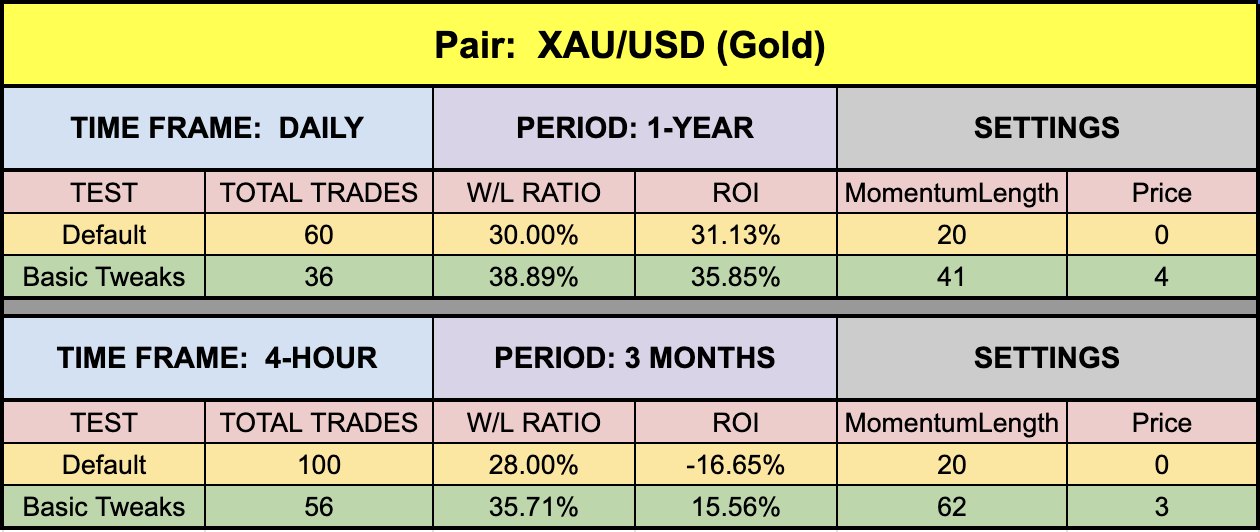
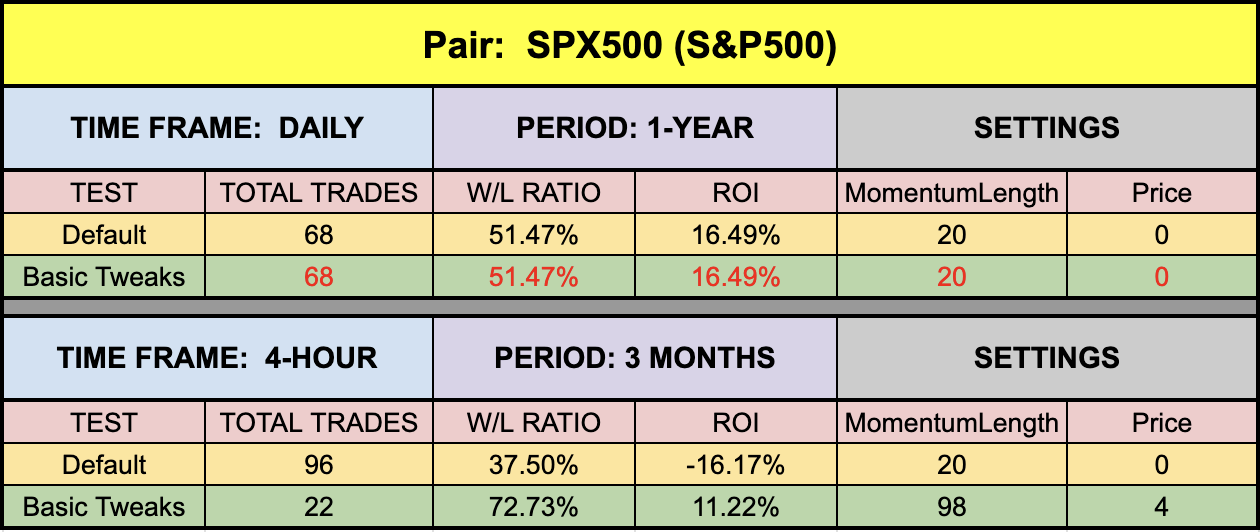
The green highlighted rows represent “basic tweaks” on the settings which returned better results. Are these the best? Not necessarily. Given that variables including testing date range and broker data are different from person to person, you may find better settings.
Trust In Yourself
Remember, the overall NNFX philosophy of taking profit, risk, and drawdown is that YOU are creating a system which YOU will be trading. Don’t let anybody else take that away from you. Part of the learning process is digging in and doing the work yourself. To learn more about these topics, check out the Advanced Course!
That being said, the results we post in these blogs should never be considered specific trading advice.
***Note: Remember, never use just this one indicator as your decision of whether to open or close a trade. It should be part of a system.
Money Management
If you are curious as to what money management is used on our tests; we have a certain way of determining wins and losses, which can be found in the Advanced Course. Our goal here is to determine how well the indicator reacts to price with respect to producing a long or short signal. Your system, with its risk profile, will dictate individual returns.
Resources
As we did with past indicator studies, we’ve made the Polychromatic Momentum is available for download on our site from the indicator library. We will keep adding better indicators with each study for your use, at no charge. When you’re ready to get it, click HERE.
More to Come
There’s a lot more to come. We are excited to provide more trading tips in the near future. Sign up on our contacts page or subscribe to our YouTube channel. Receive early notifications as we continue to publish helpful, relevant, and informative Forex related material to support your quest to become a better trader.
And, now you are aware of another indicator that many traders don’t know or use.
Our only goal is to make you a better trader.
BTW – Any information communicated by Stonehill Forex Limited is solely for educational purposes. The information contained within the courses and on the website neither constitutes investment advice nor a general recommendation on investments. It is not intended to be and should not be interpreted as investment advice or a general recommendation on investment. Any person who places trades, orders or makes other types of trades and investments etc. is responsible for their own investment decisions and does so at their own risk. It is recommended that any person taking investment decisions consults with an independent financial advisor. Stonehill Forex Limited training courses and blogs are for educational purposes only, not a financial advisory service, and does not give financial advice or make general recommendations on investment.