Sometimes an old favorite can be made a little better. And in our line of business, we like better…right? We stumbled across this next indicator kind of by accident. Comparing it to the original, we thought there might be some possibilities here with respect to better signals.
Bonus…Just For You
As an added feature in the blogs, we’re now going to create a short video of the indicator in action. But this isn’t just a video watching paint dry. We’re creating time-lapse videos sped up 20,000% over a longer period to really see what the indicator is doing. Naturally, we’ll identify signals and make any relevant comments right in the videos. These won’t be long enough to have popcorn and put your feet up. They will be just long enough to whet your appetite and give you a sense of what to expect. We think you’ll definitely find them helpful.
This Week’s Feature
This week, we’re featuring an indicator whose roots go back in time, really far back…like all the way back to the 1700s. The original concept of the Heiken Ashi chart was developed for the Japanese rice trading at the Dojima trading exchange by Munhisa Homma. The smoothed (and adjustable) version we’ll be looking at was developed much more recently; 2009.
Heiken Ashi Math
If you’re not sure what Heiken Ashi candles look like, we’ll post an image down below and give it a quick explanation. The candlesticks have a similar appearance in their “look” on the chart, but they’re plotted differently than standard candles. A normal candle has the open, high, low, and close whereas a Heiken Ashi candle is computed as follows;
The open, high, low and close on the Heiken Ashi chart (to create the candle) is calculated as follows:
Close = Open + High + Low + Close/4 – This is nothing but the average price of the session.
Open = Open + Close/2 + Close – This is the average of the open and closing prices and the closing price of the previous session
High = Maximum value of the High, Open, Close
Low = Minimum value of the Low, Open, Close
The interesting thing about Heiken Ashi charts is that the indicator changes (and replaces) the normal candles. The smoothed version we’re looking at here is actually a chart overlay. The biggest difference between old school and new kid on the block is that it plots Heiken Ashi as a moving average.
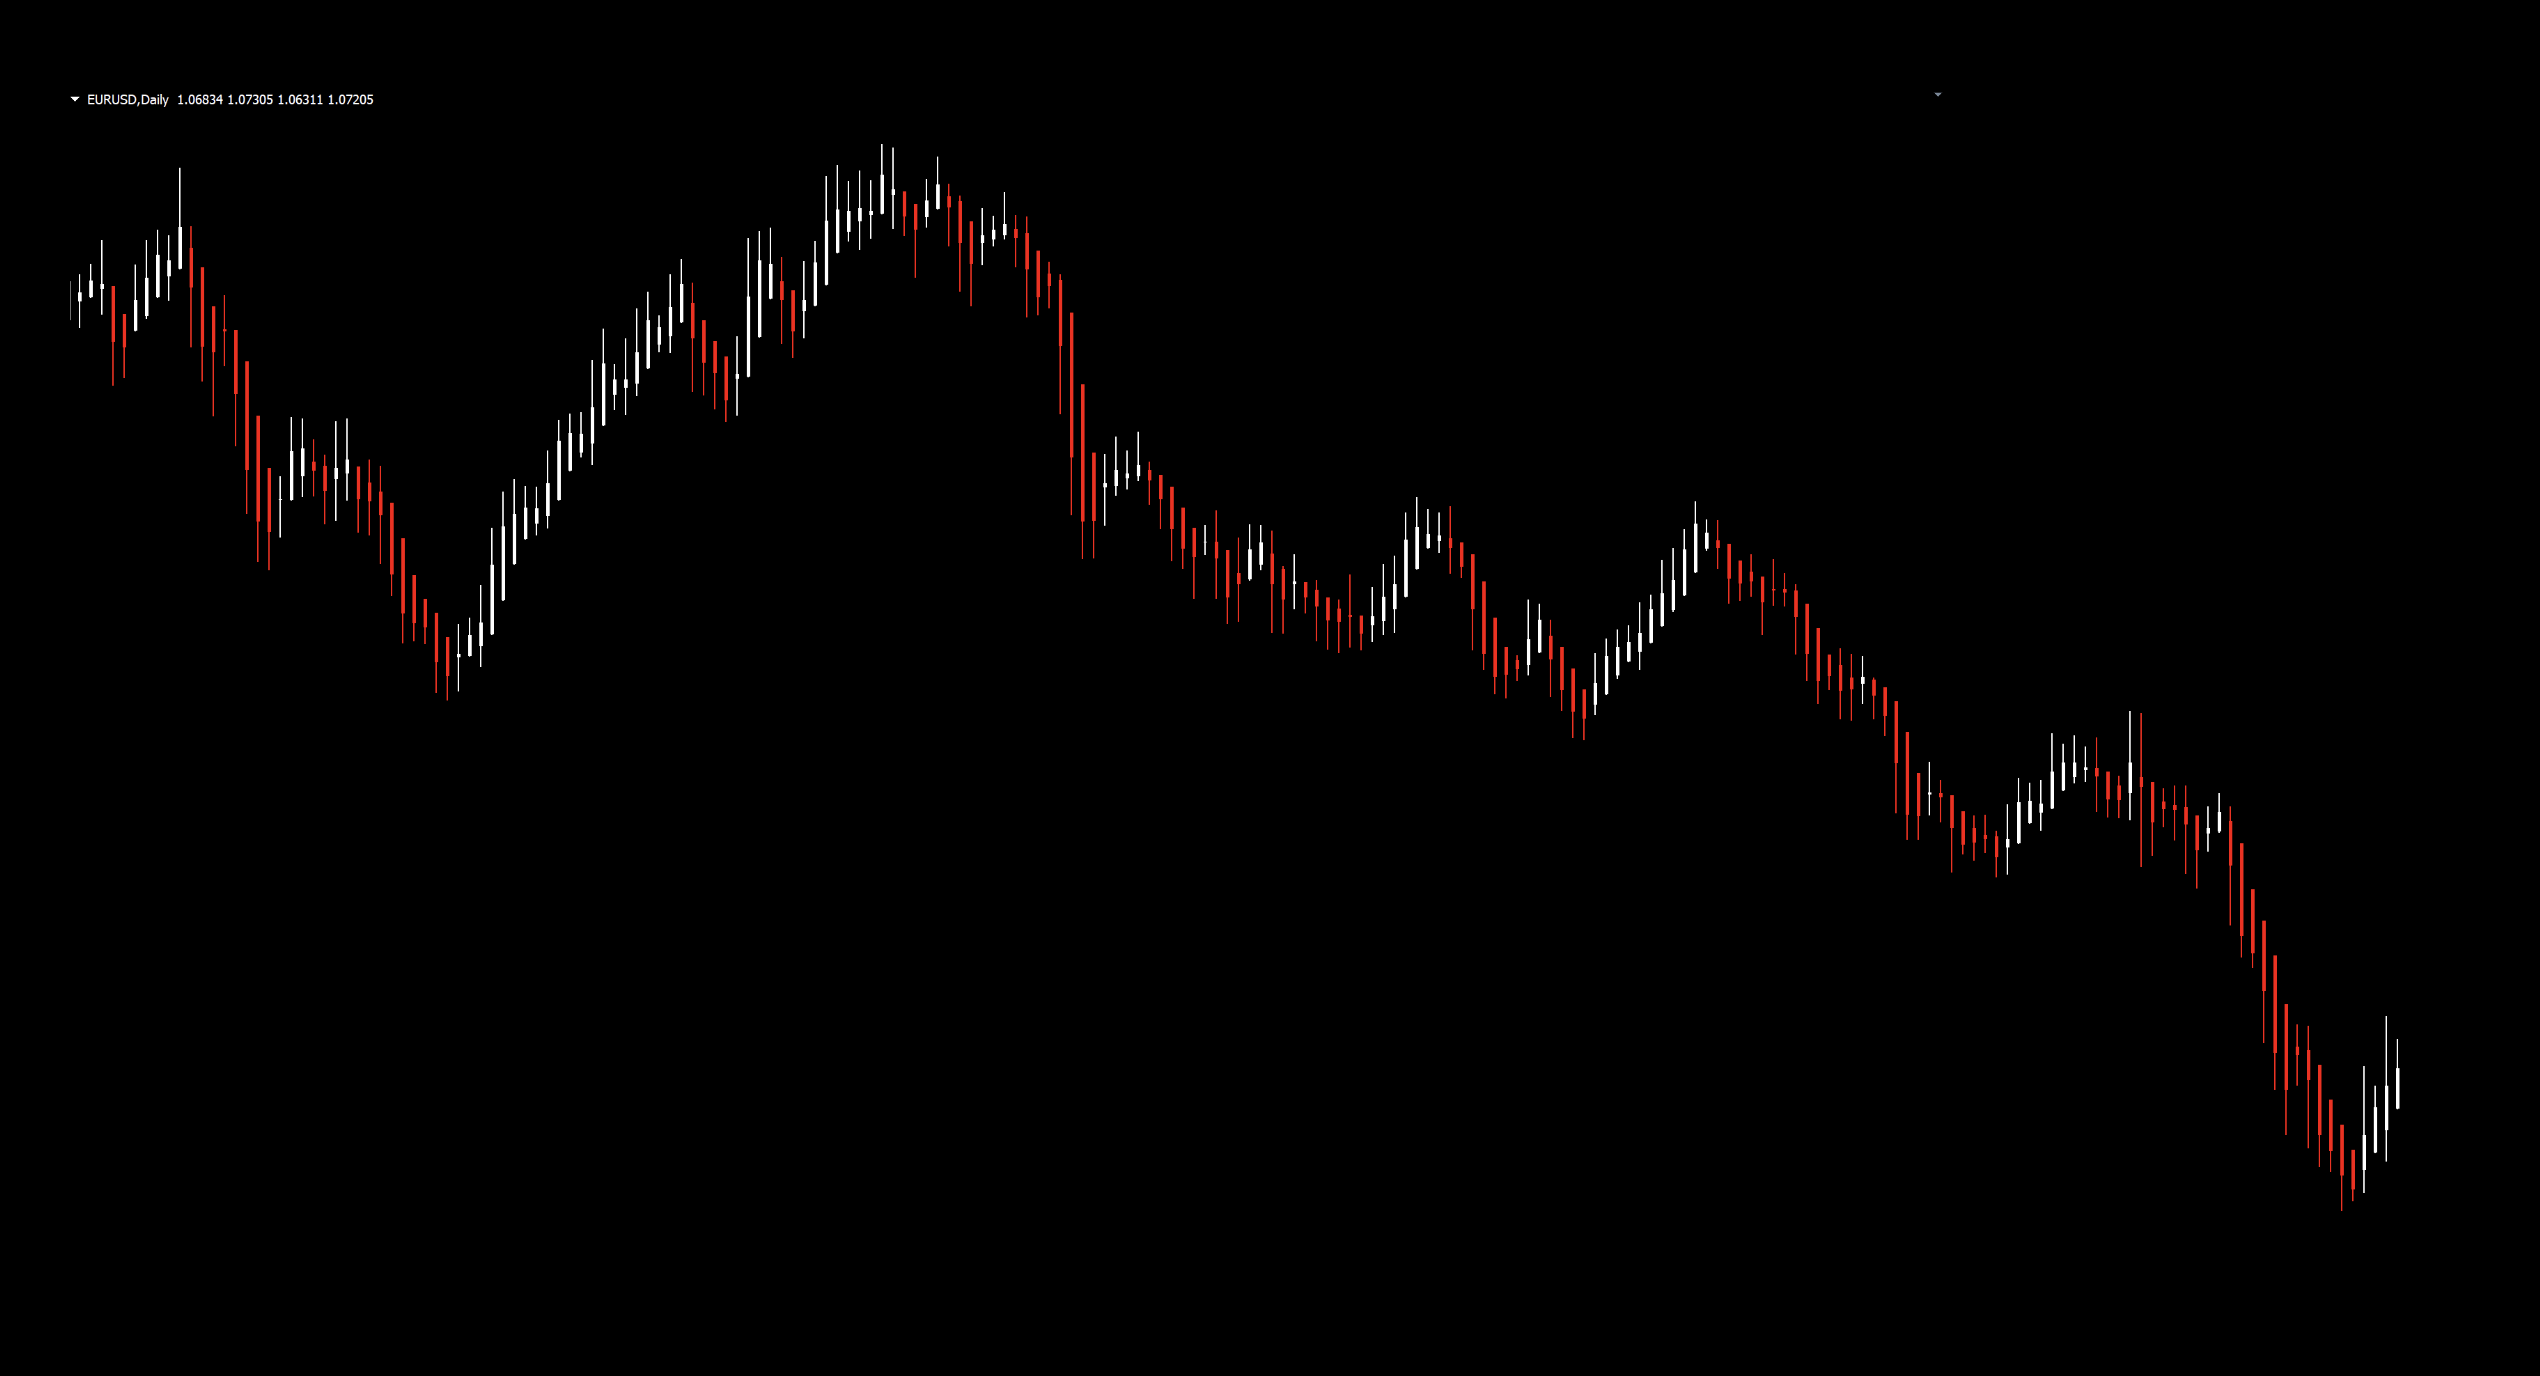
A Look Into The Past
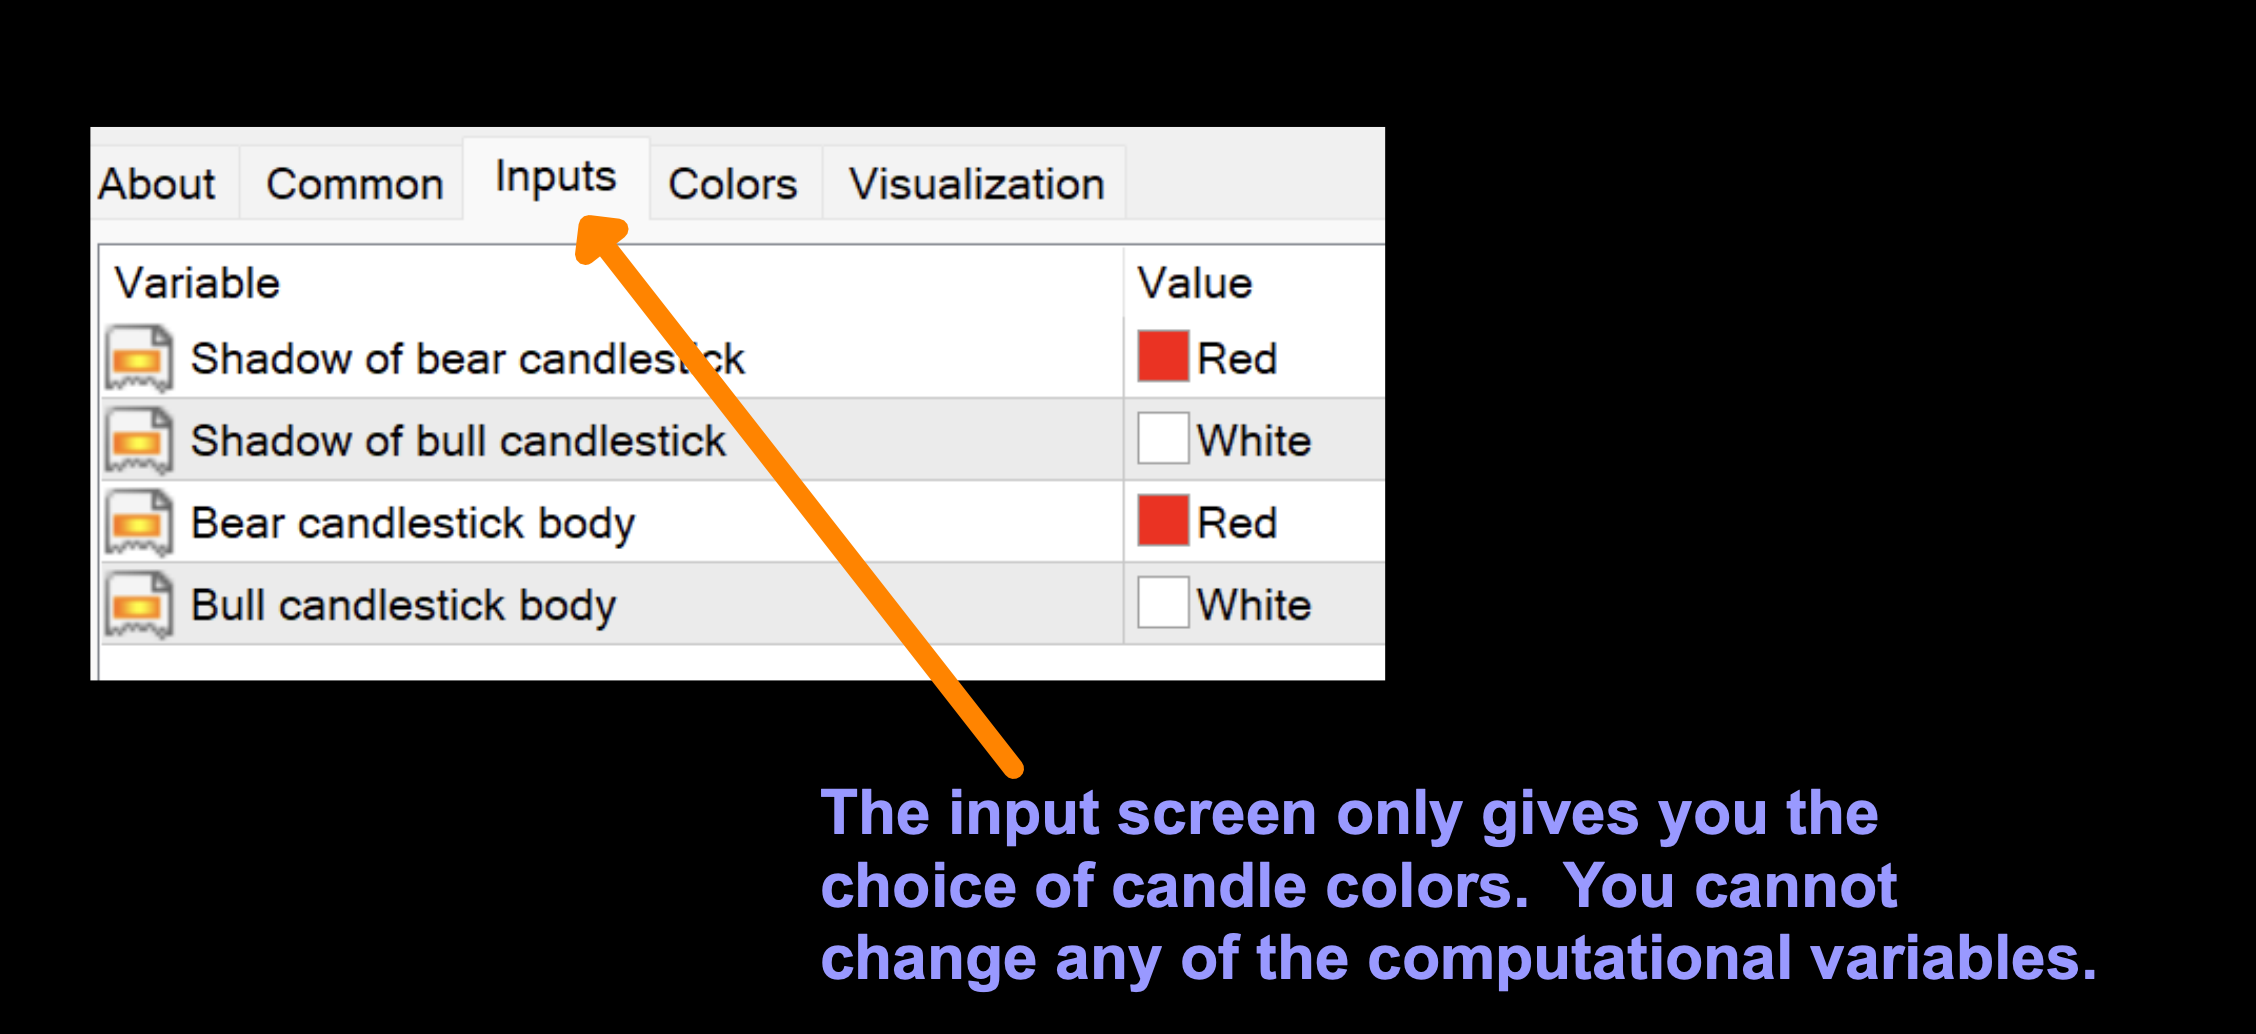
Below is a screenshot of what the original Heiken Ashi looks like.
In the classic version, you cannot change any of the settings, except for candle colors. So whatever you saw, that’s what you traded.
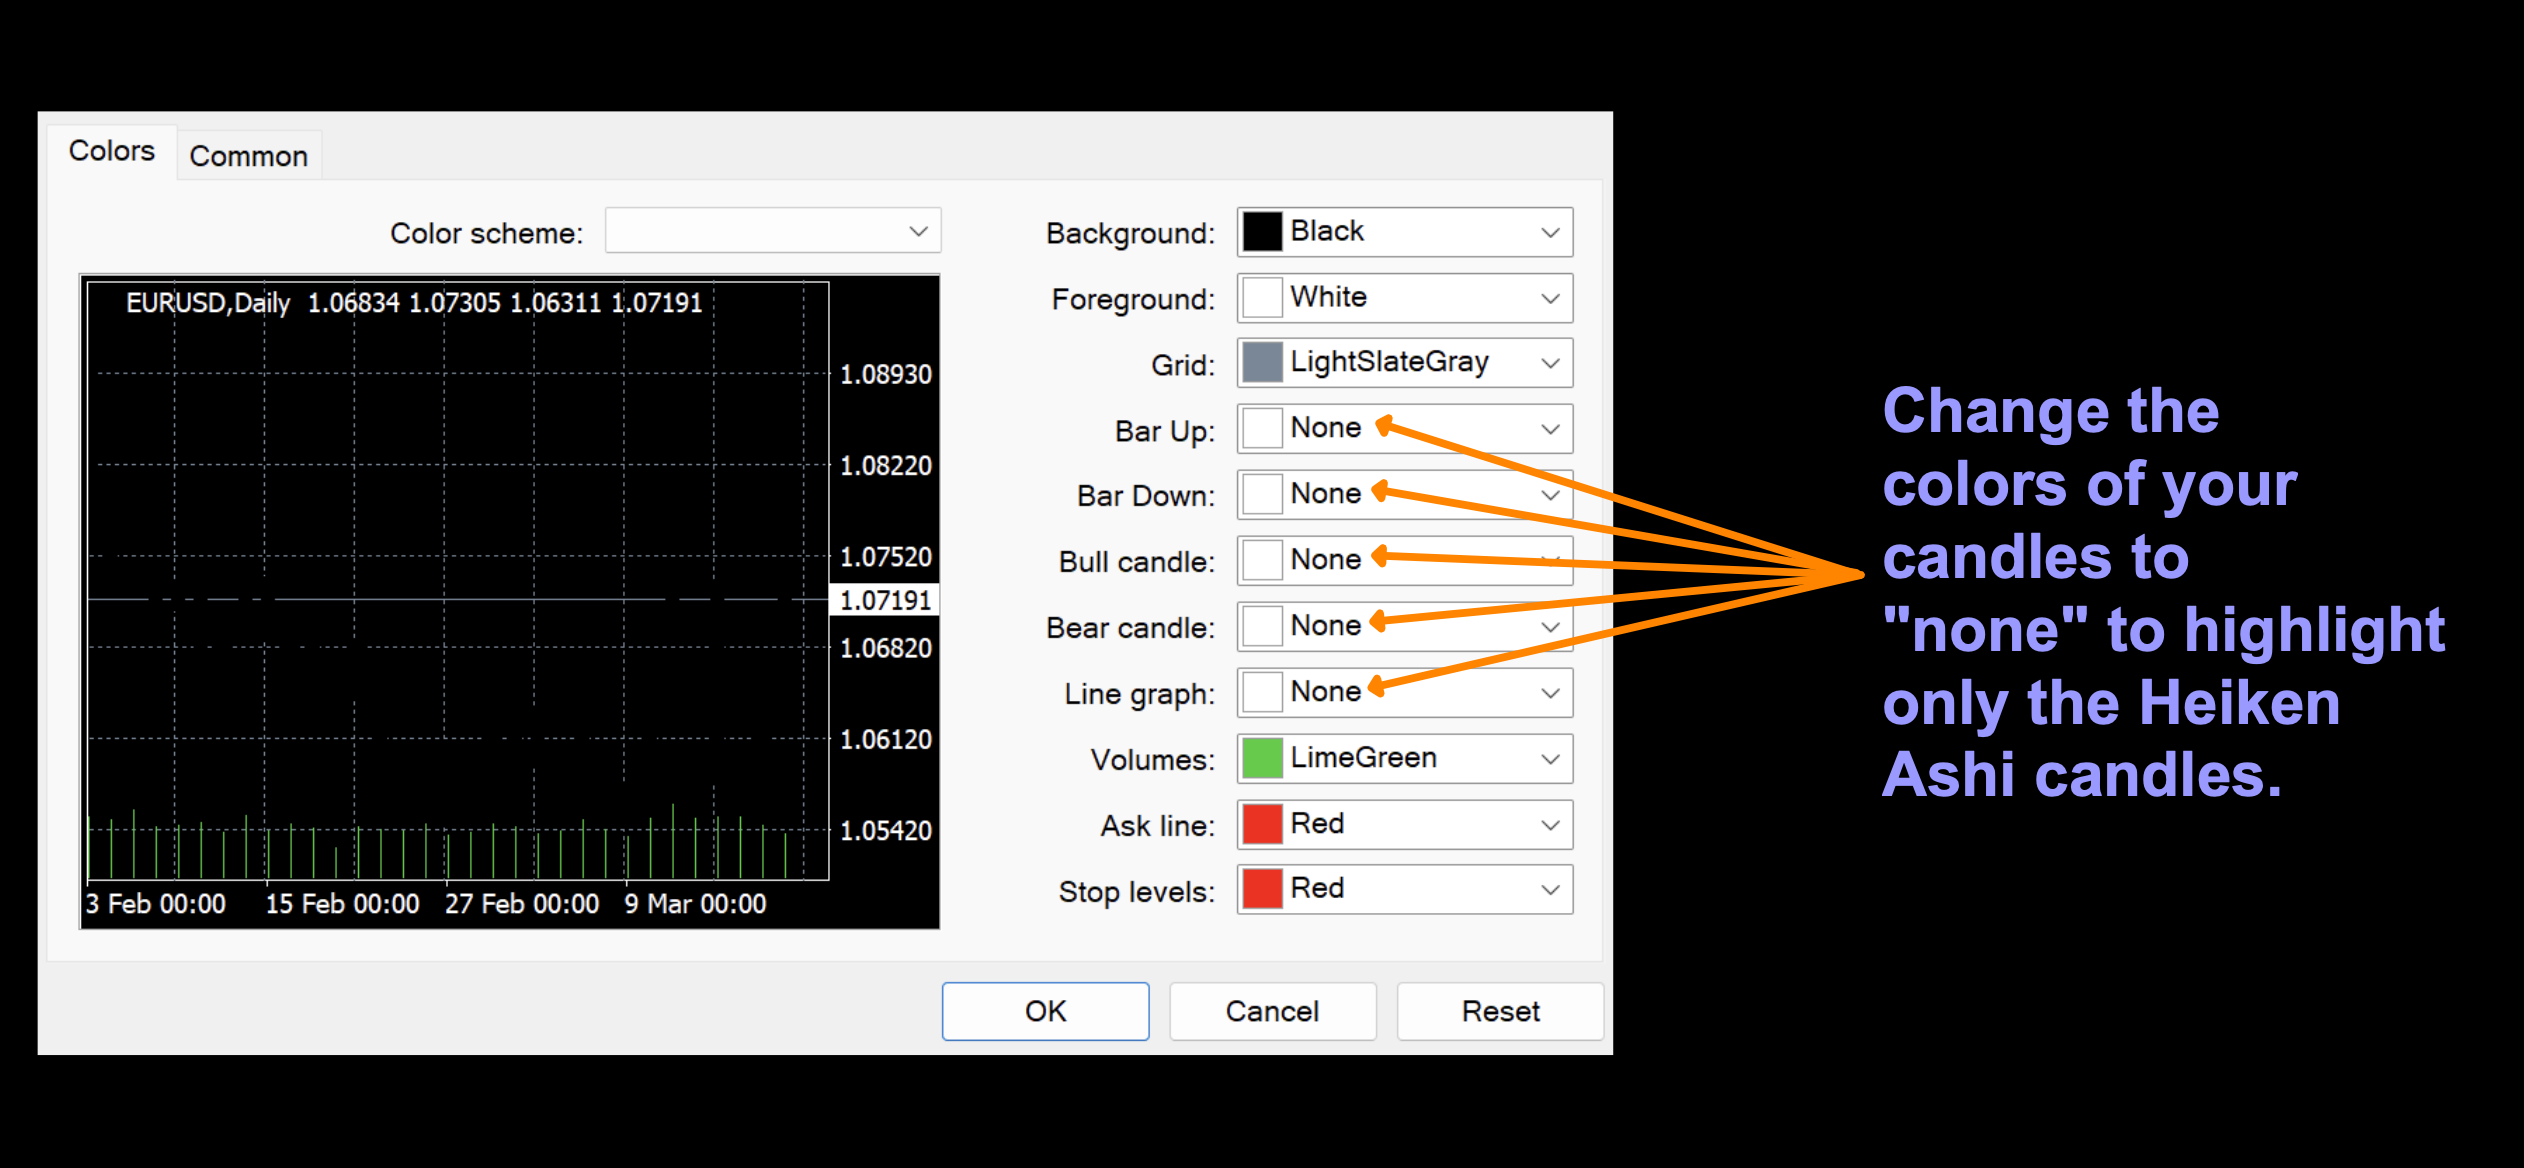
You may also have to change the candle colors in the general properties screen to “none” in case you get weird looking candles based on the colors of your normal candles, as noted below.
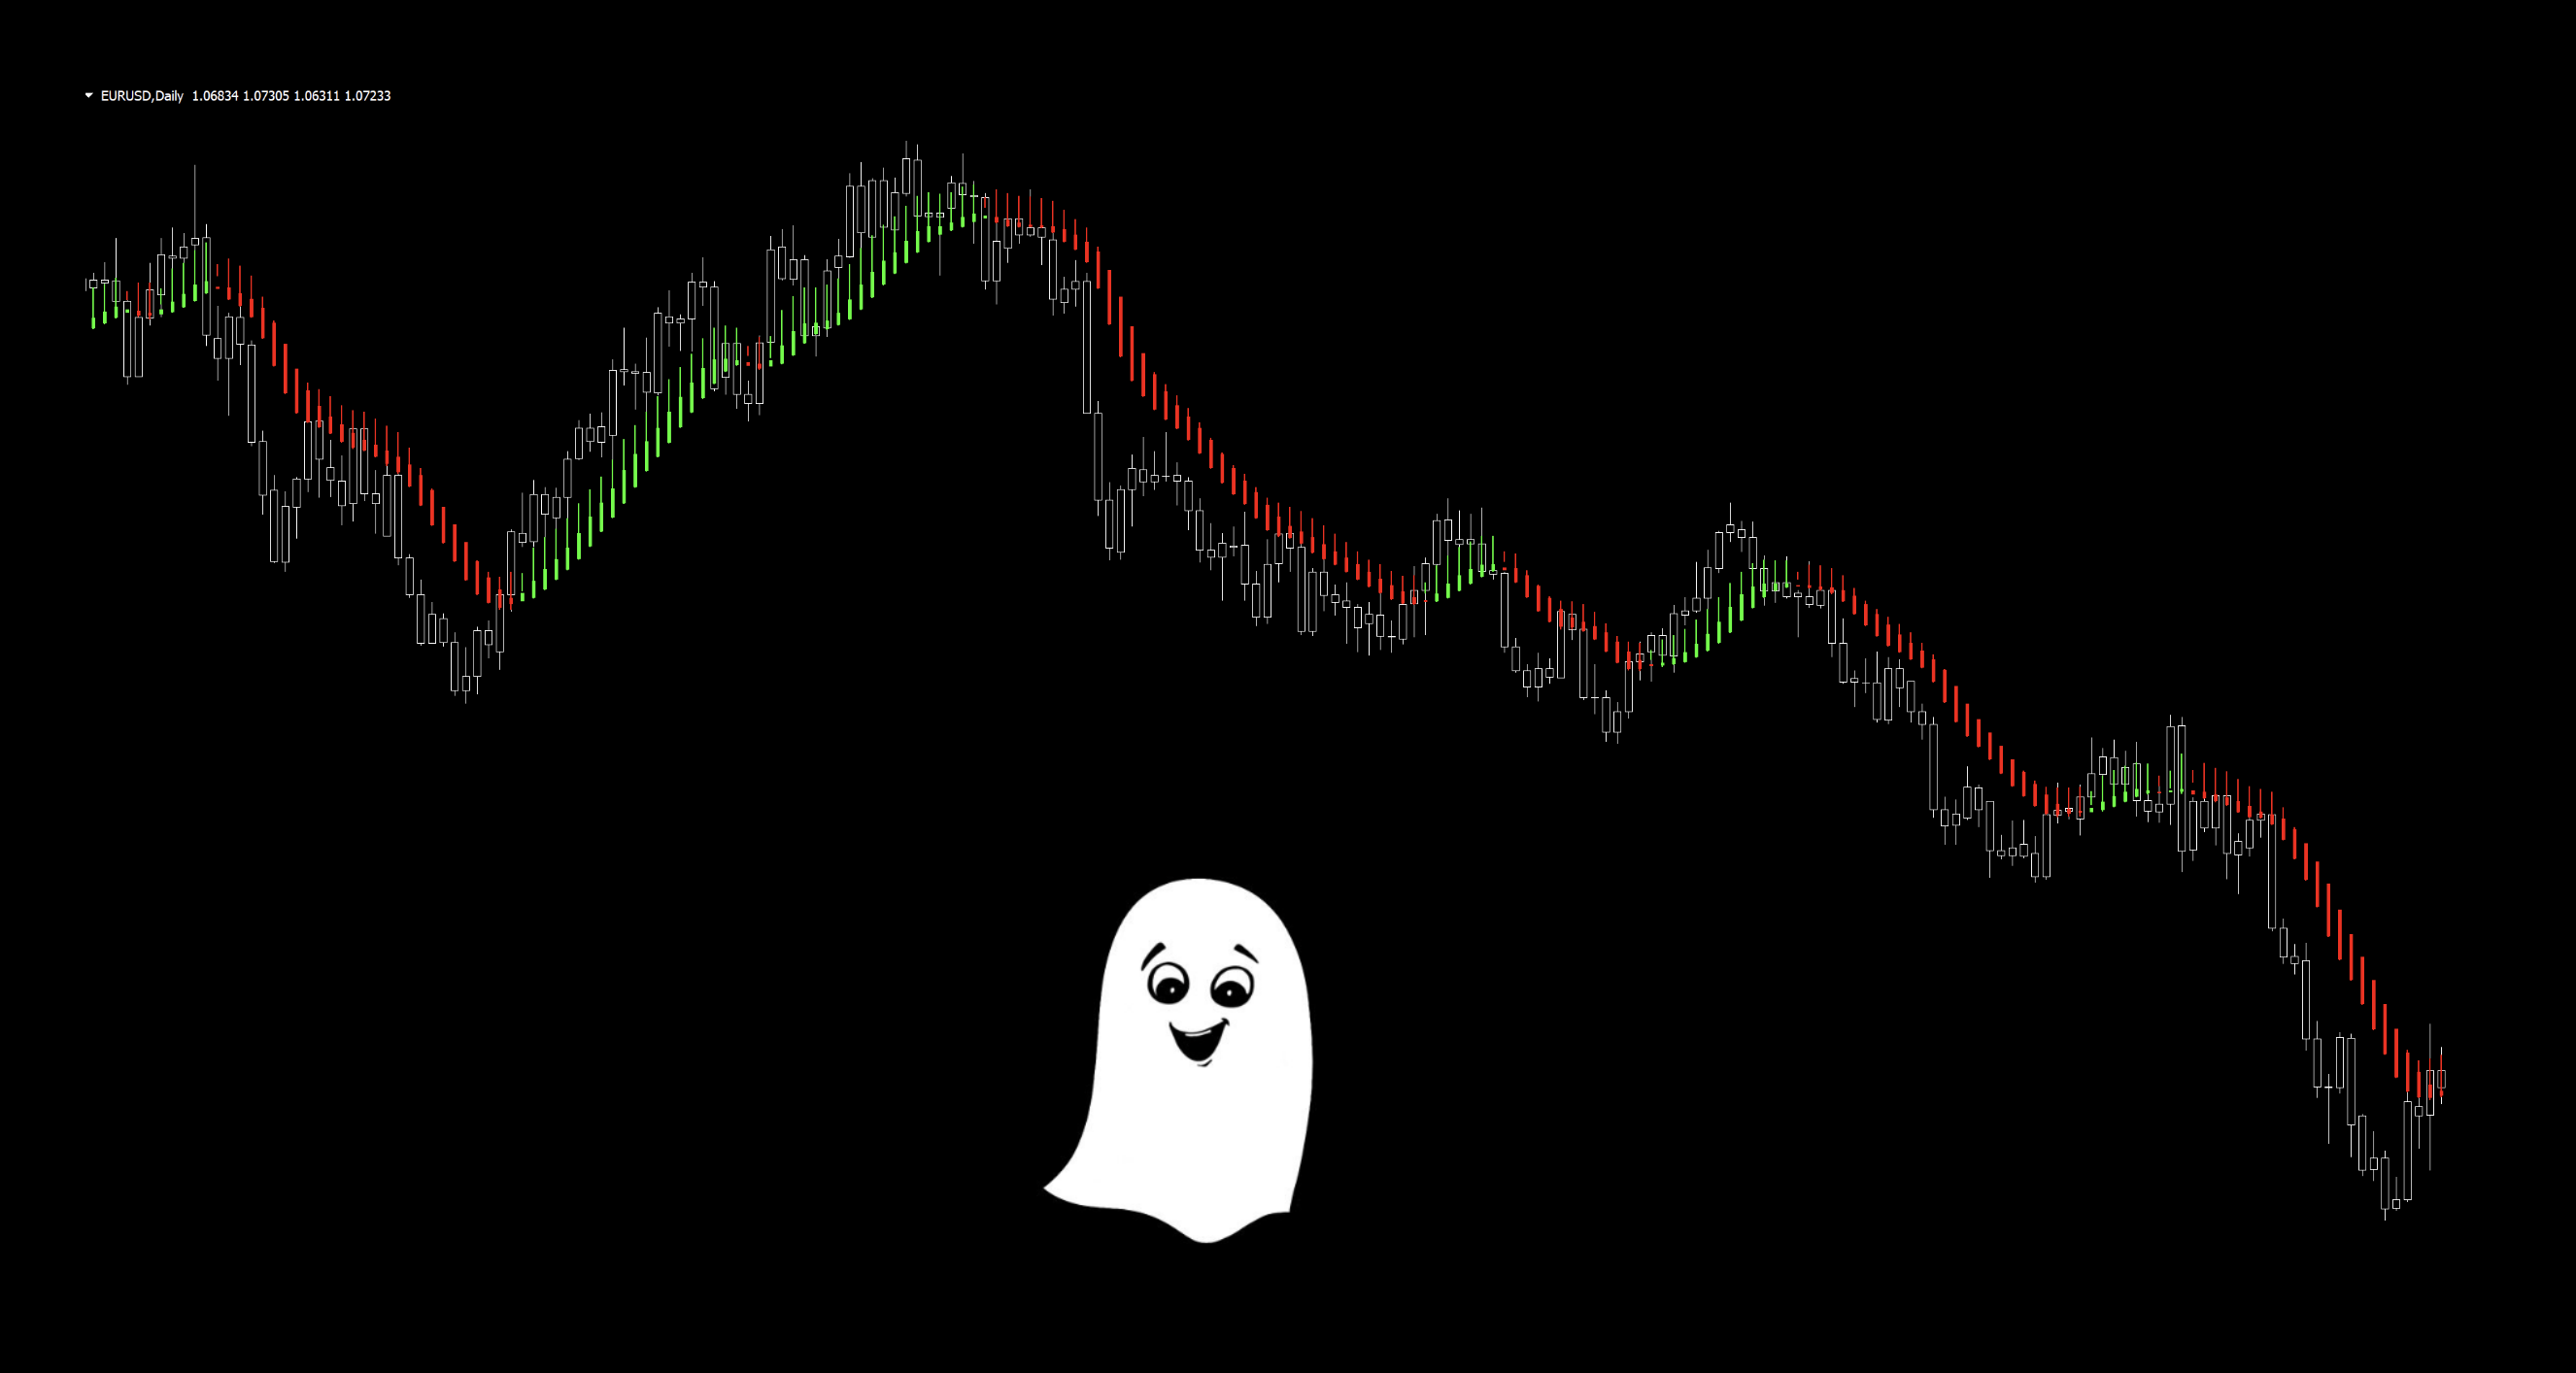
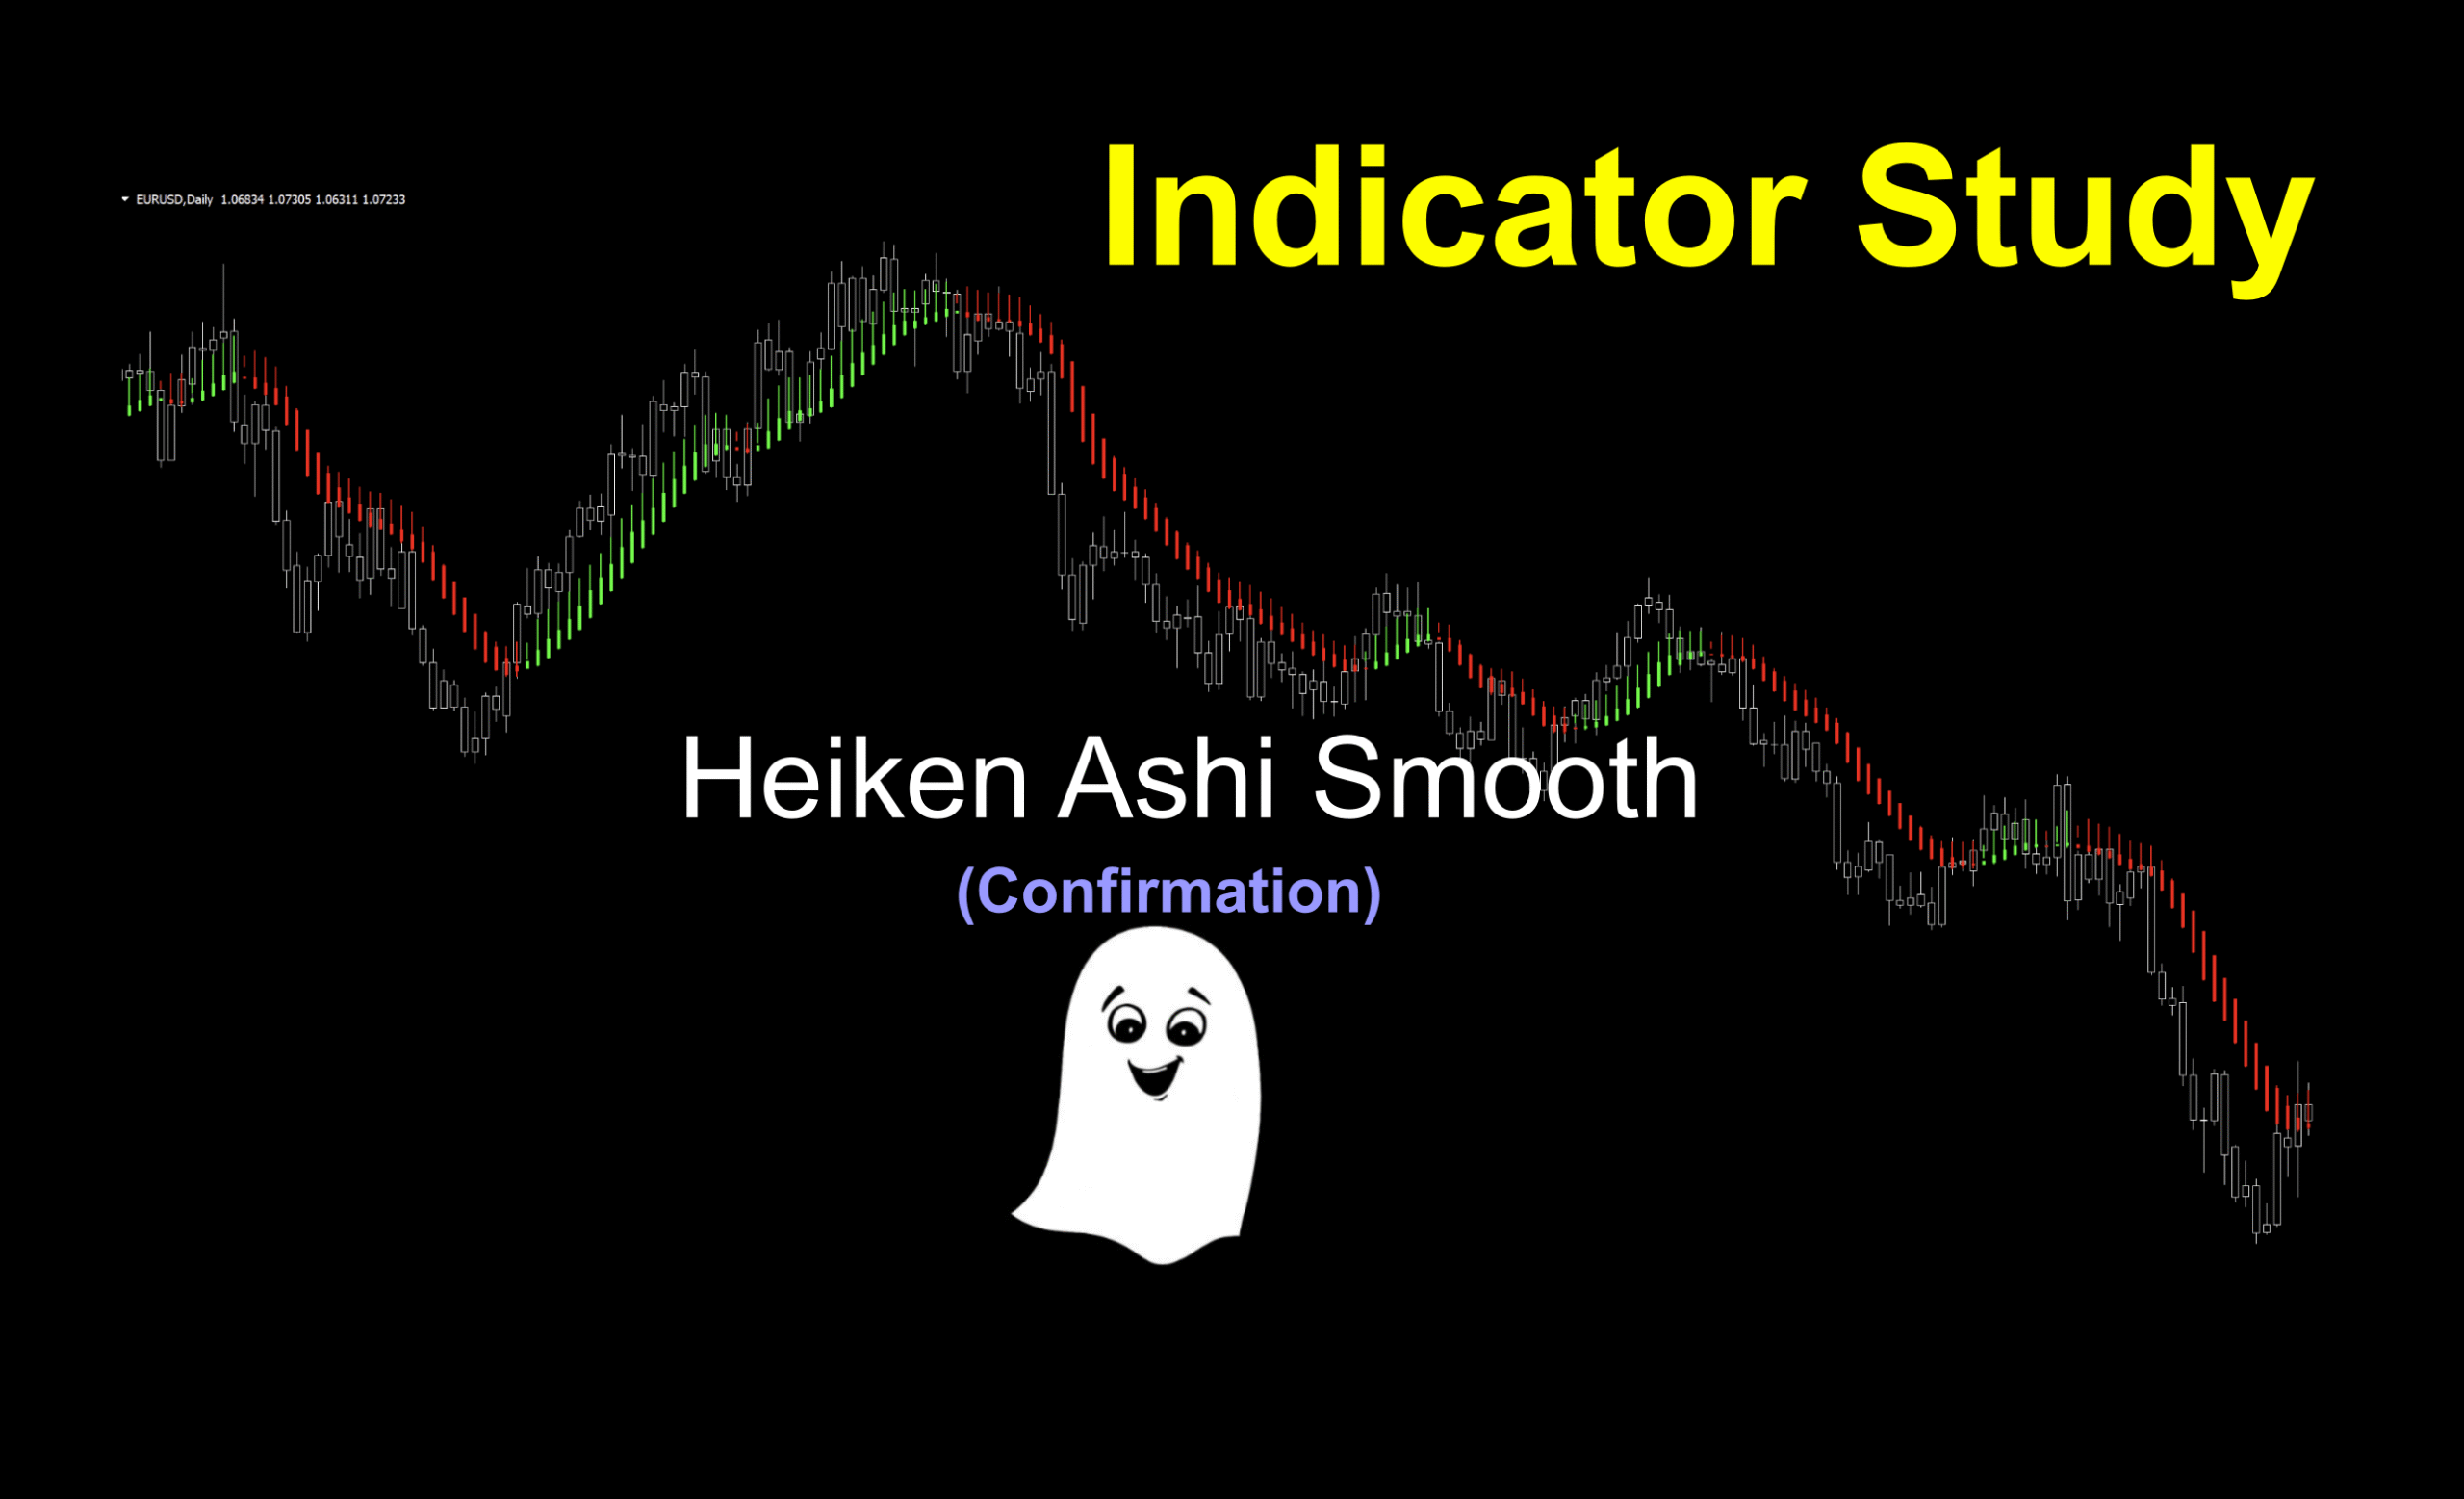
Ghost in the Machine
What we’re going to do is plot the Heiken Ashi Smooth on top of a chart, like we always do. The difference here is that instead of white candles, we’ll create “ghost” candles by removing the interior colors. This will highlight the indicator more clearly.
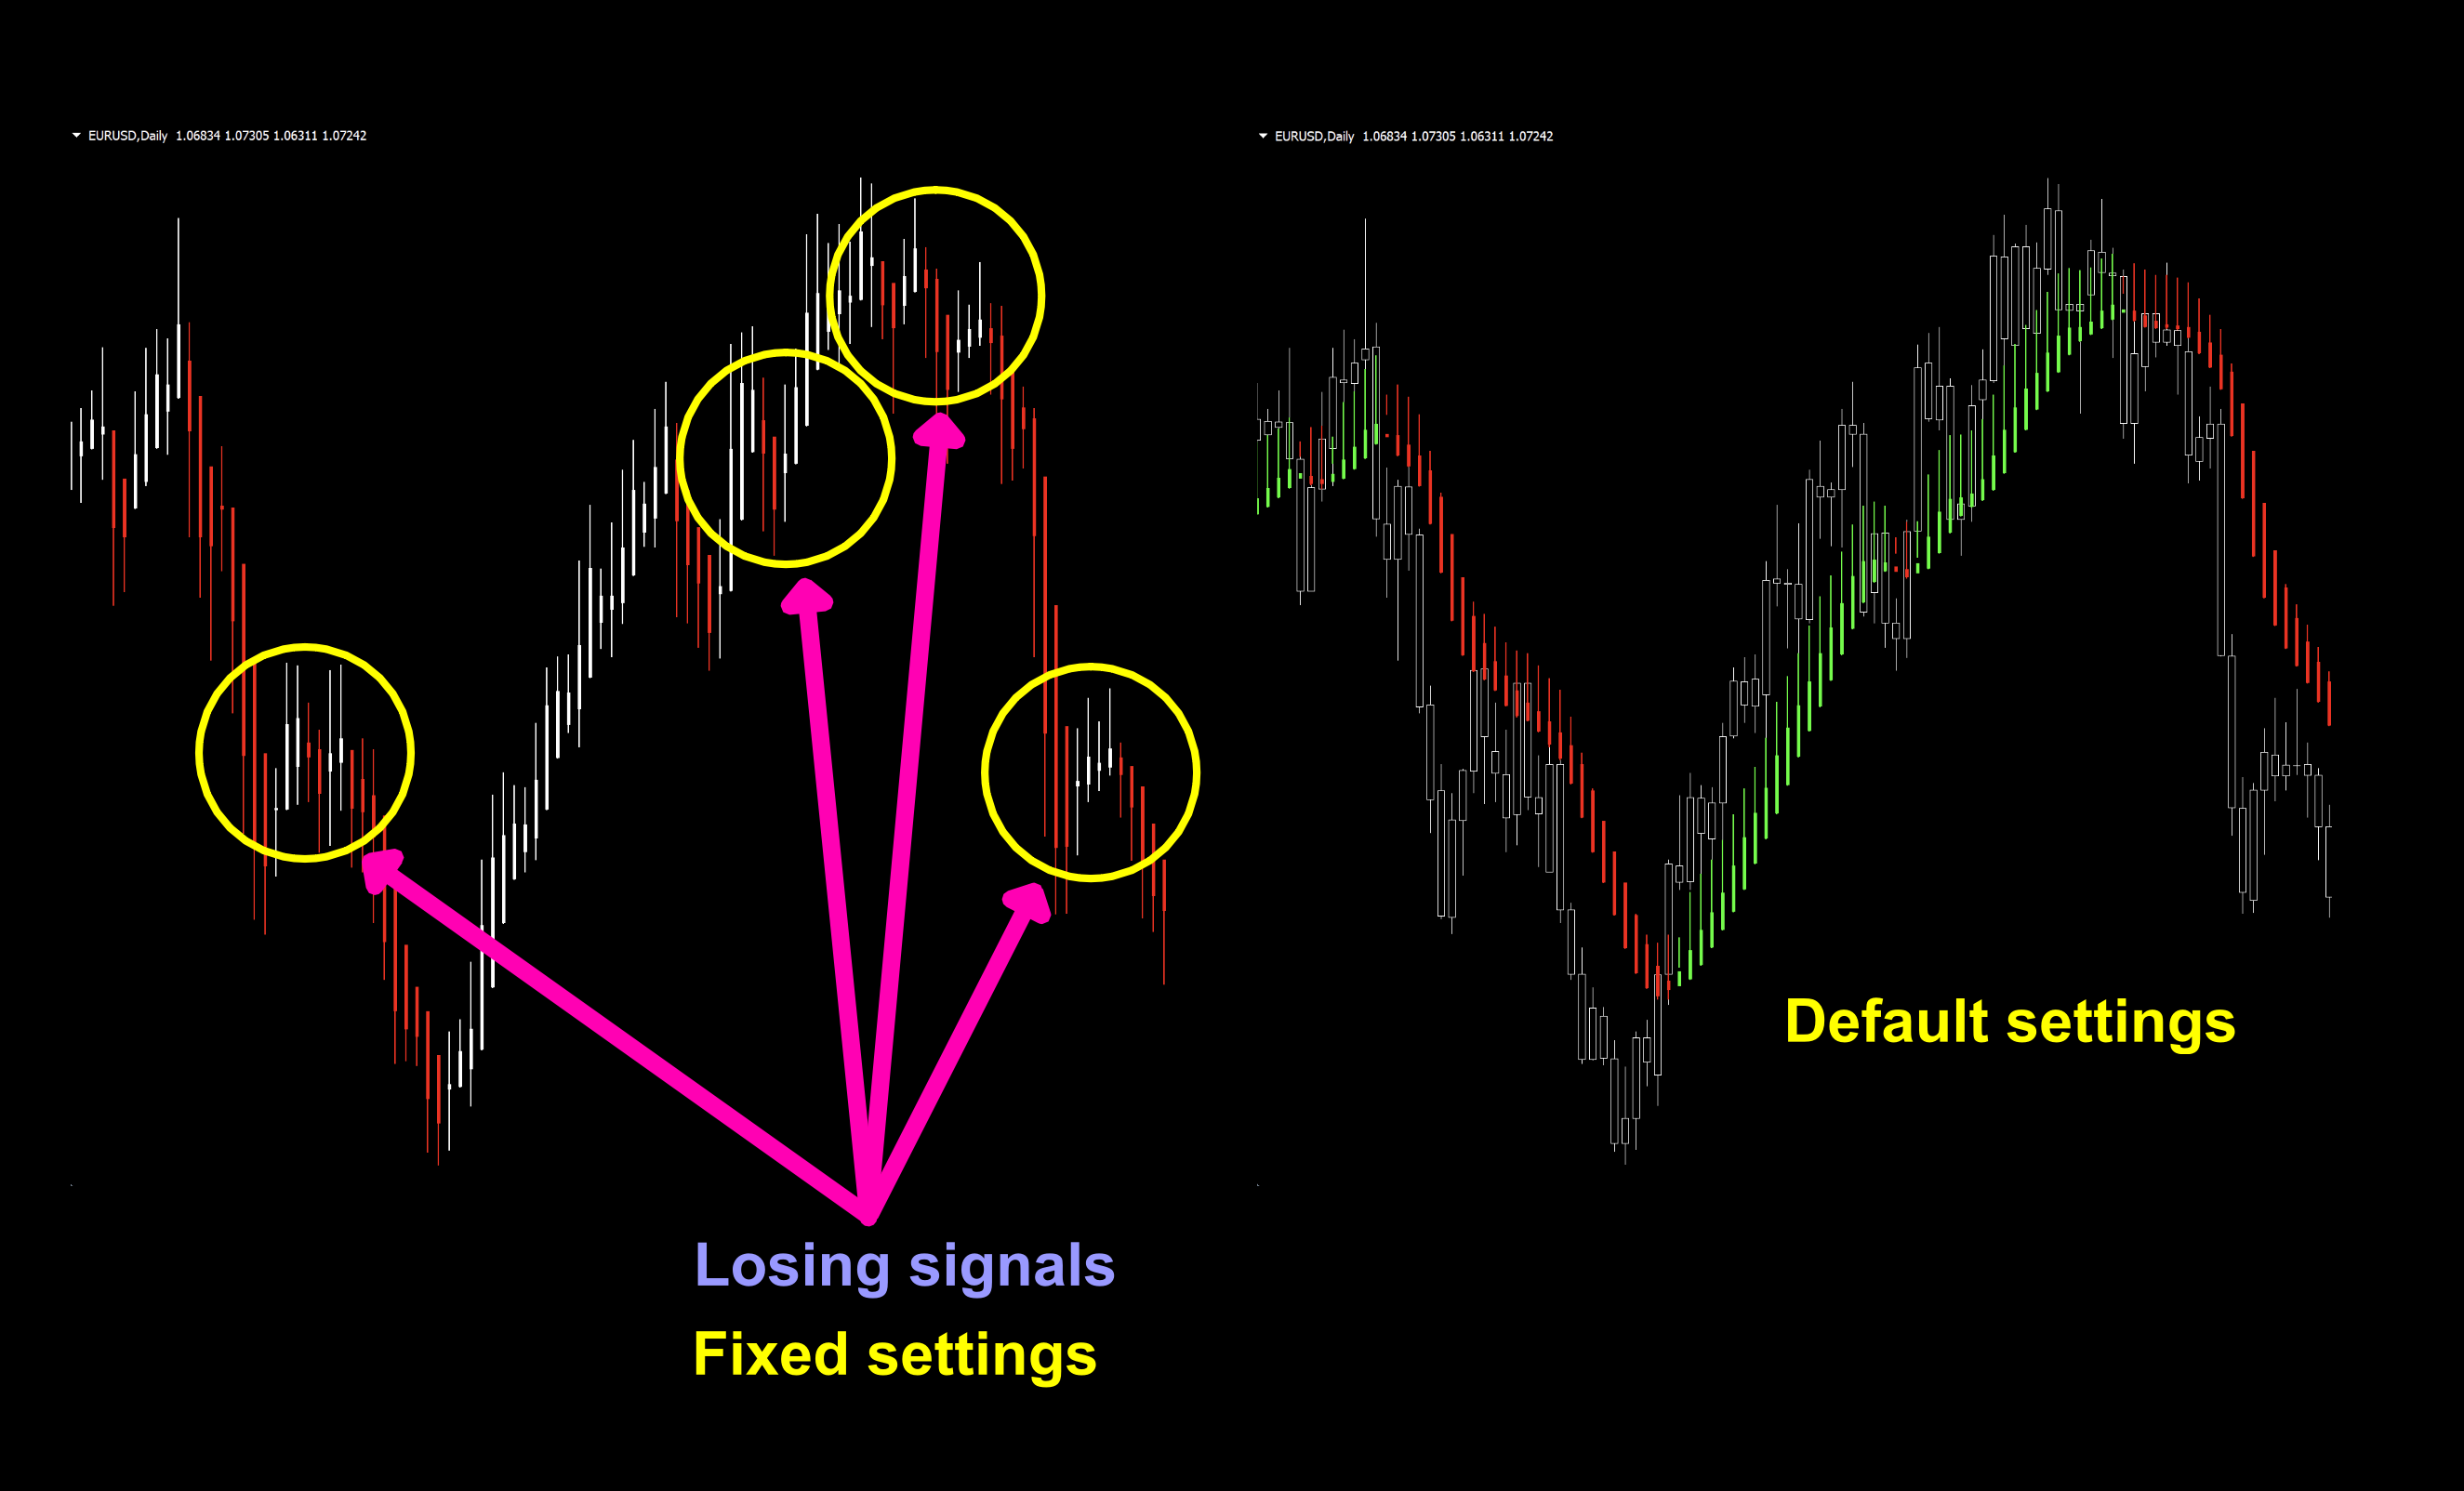
The first thing you might notice is that there are fewer signals on the smooth chart than the original indicator. Let’s put them side by side.
Before we get into the settings, let’s go to the videotape and watch a time-lapse of the two indicators side by side, so we can get a feel for what’s going on. This visual gives us a better idea as to how the indicator reacts with price. As an added bonus, we’ve got “old school” next to it as a comparison.
Settings
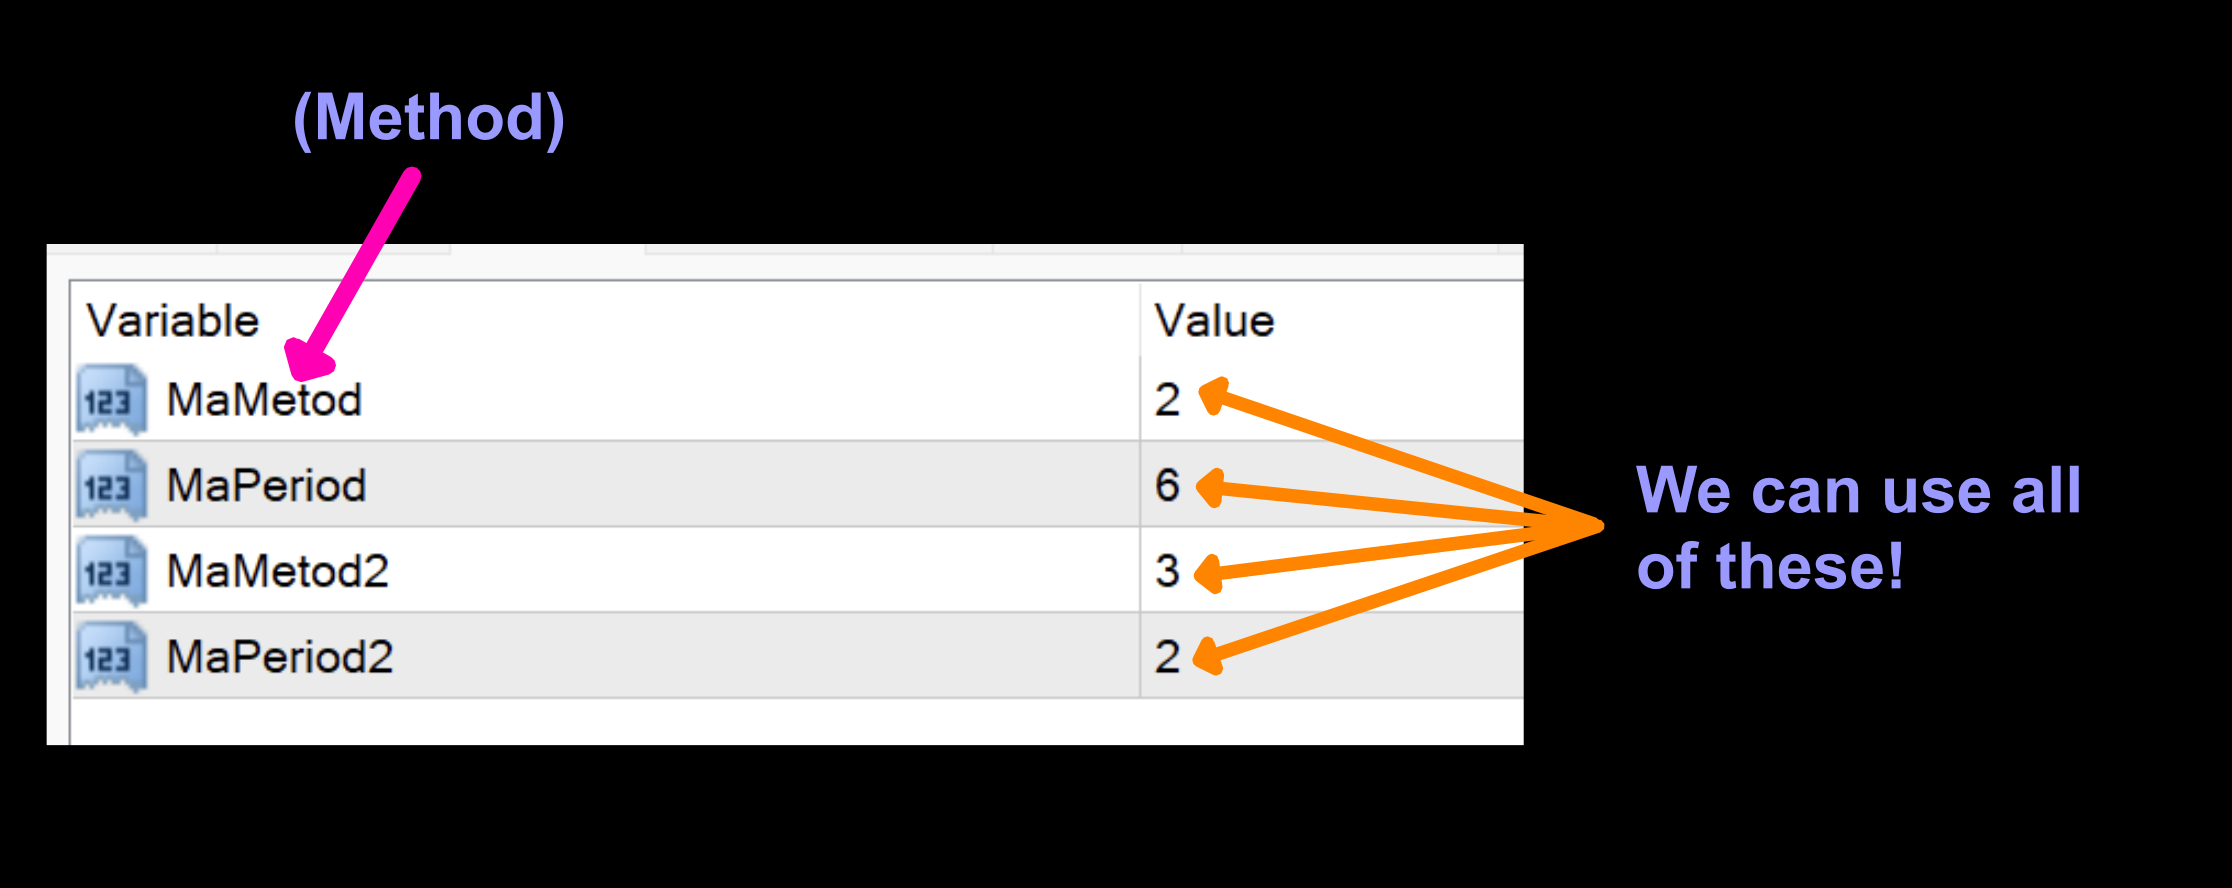
There are four settings in this indicator, so testing should give you a few choices for your algorithm.
MaMetod: This is the method (price data set) used for the first moving average calculation. 0-open, 1-closed, 2-high, 4-low. The default setting is 2.
MaPeriod: The number of periods used to calculate the first moving average. The default setting is 6.
MaMetod2: This is the method (price data set) used for the second moving line calculation. 0-open, 1-closed, 2-high, 3-low. The default setting is 3.
MaPeriod2: The number of periods used to calculate the second moving average. The default setting is 2.
Advantages
* Takes a known indicator to the next level.
* Color changes are easy to see.
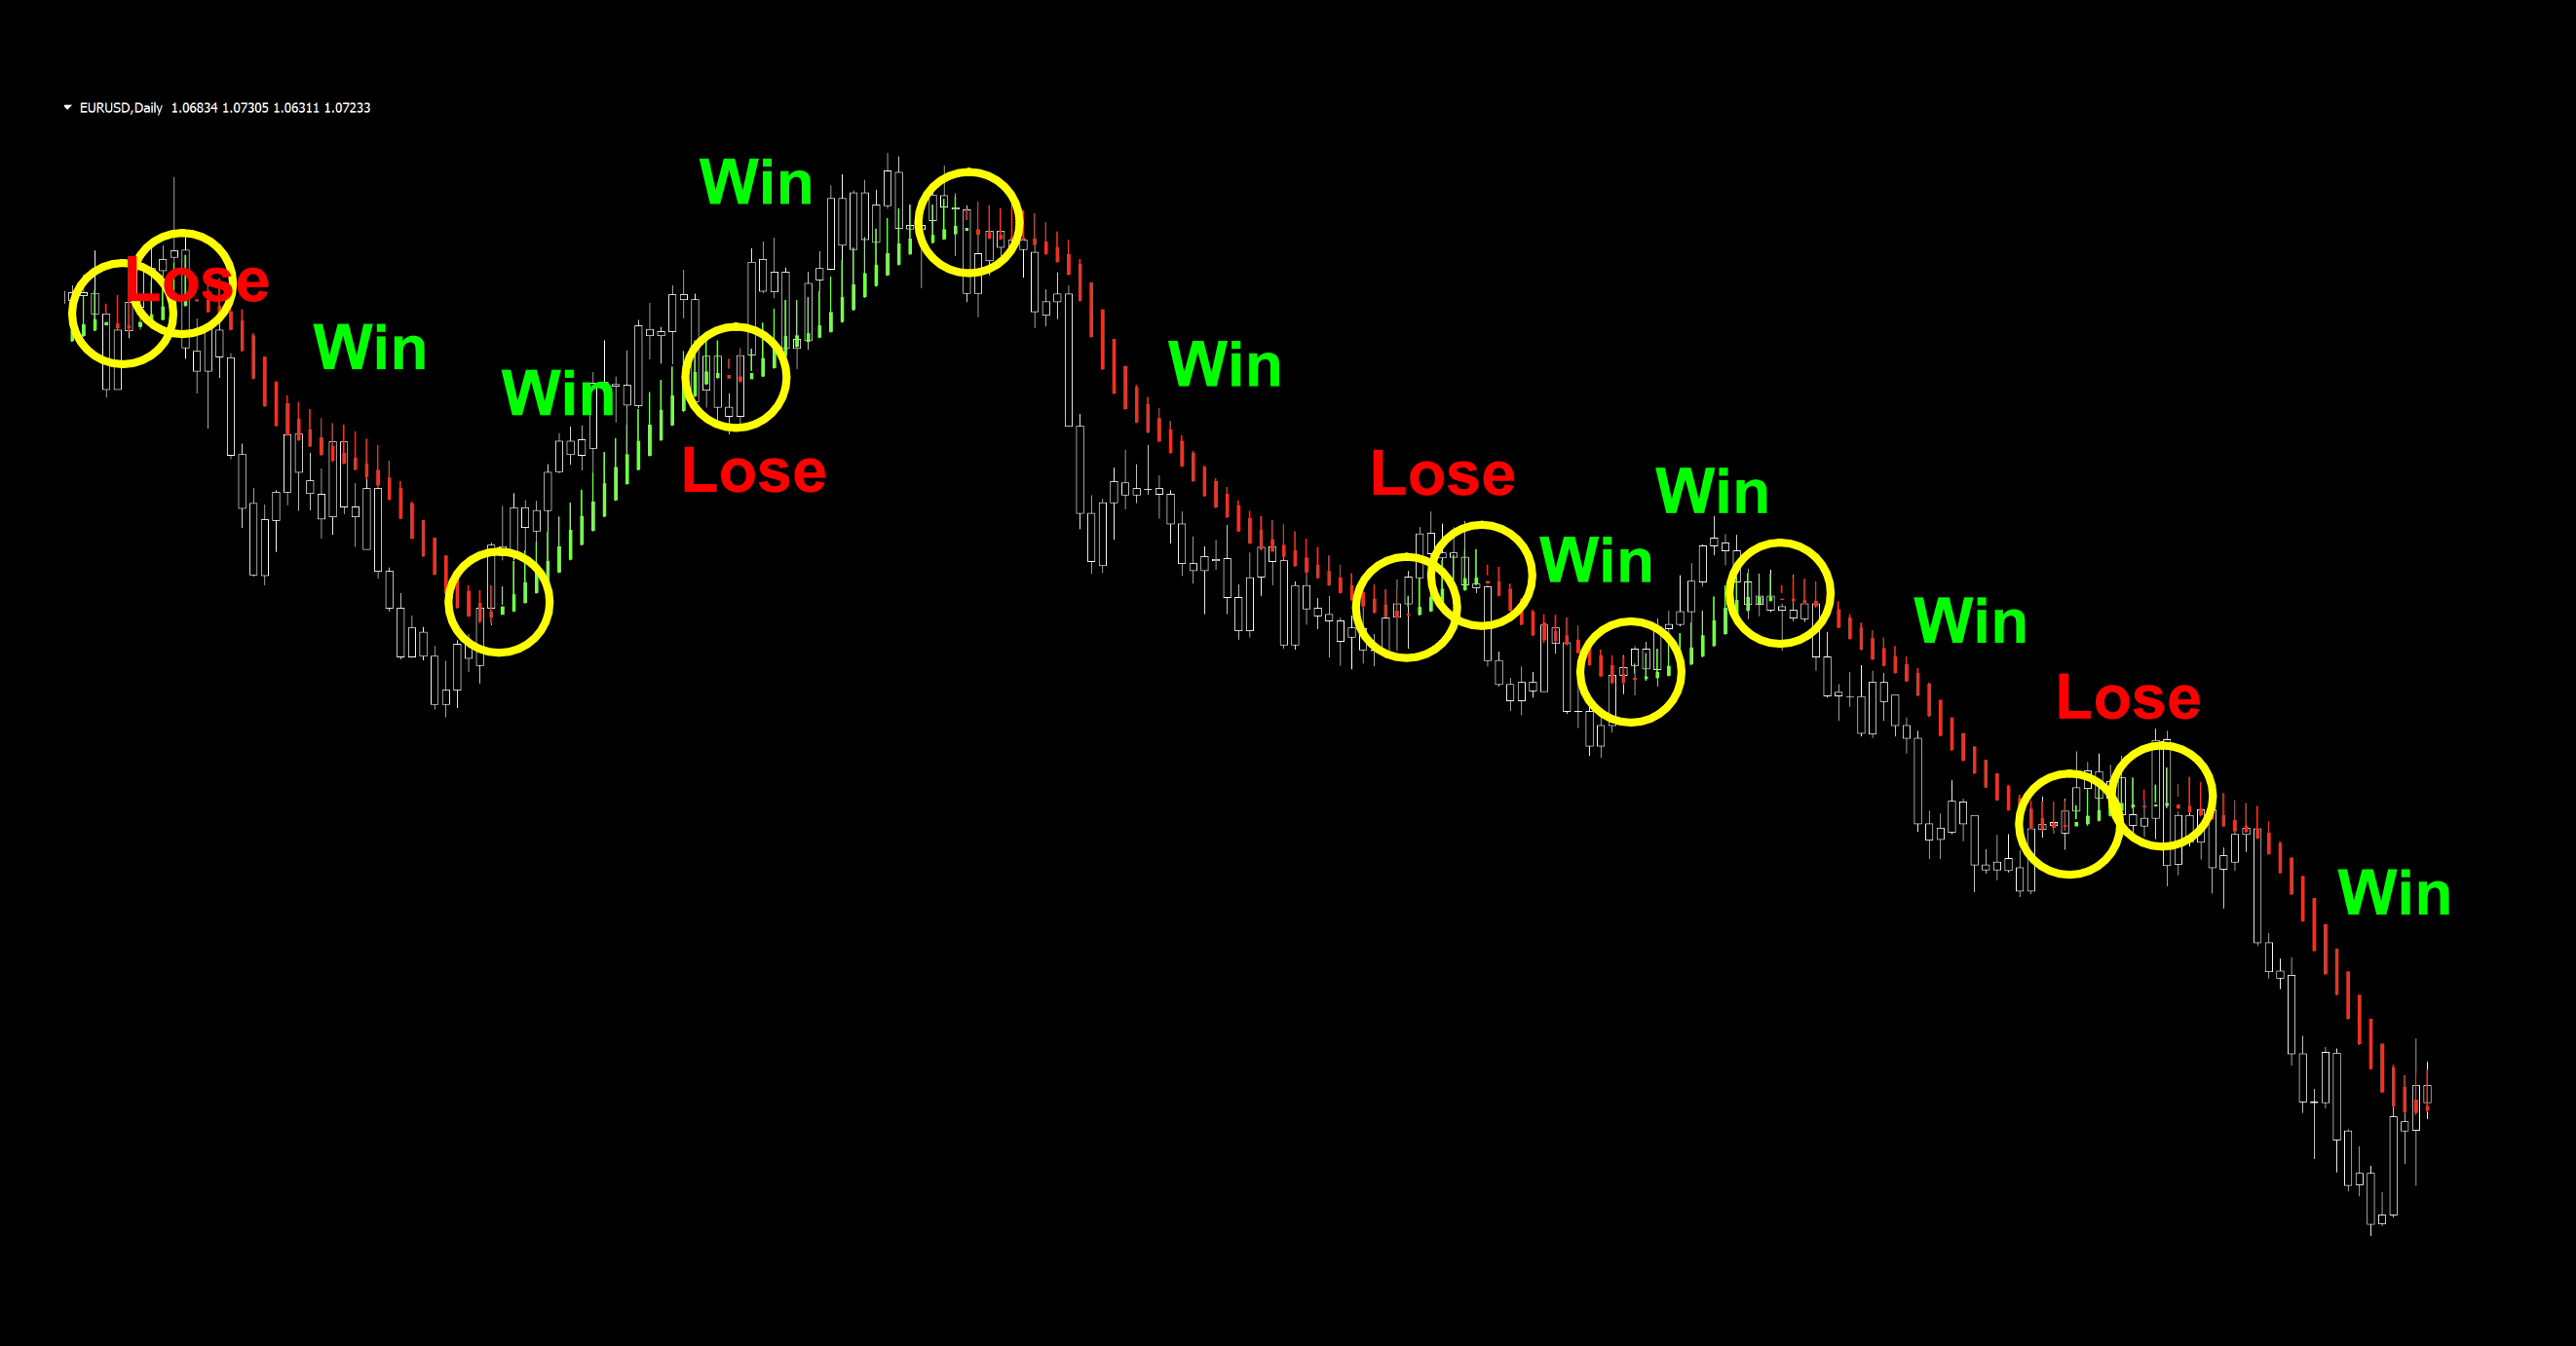
We’ll take a look at the signals on the default chart and see what we see…
How We Use It
This confirmation indicator is easy, right? Color change! Not much to think about here. And, it can make a decent exit indicator as well.
Long signal – When the candles change from red to green. The entry occurs on the open of the next candle.
Short signal – When the candles change from green to red. The entry occurs on the open of the next candle.
Is New Better?
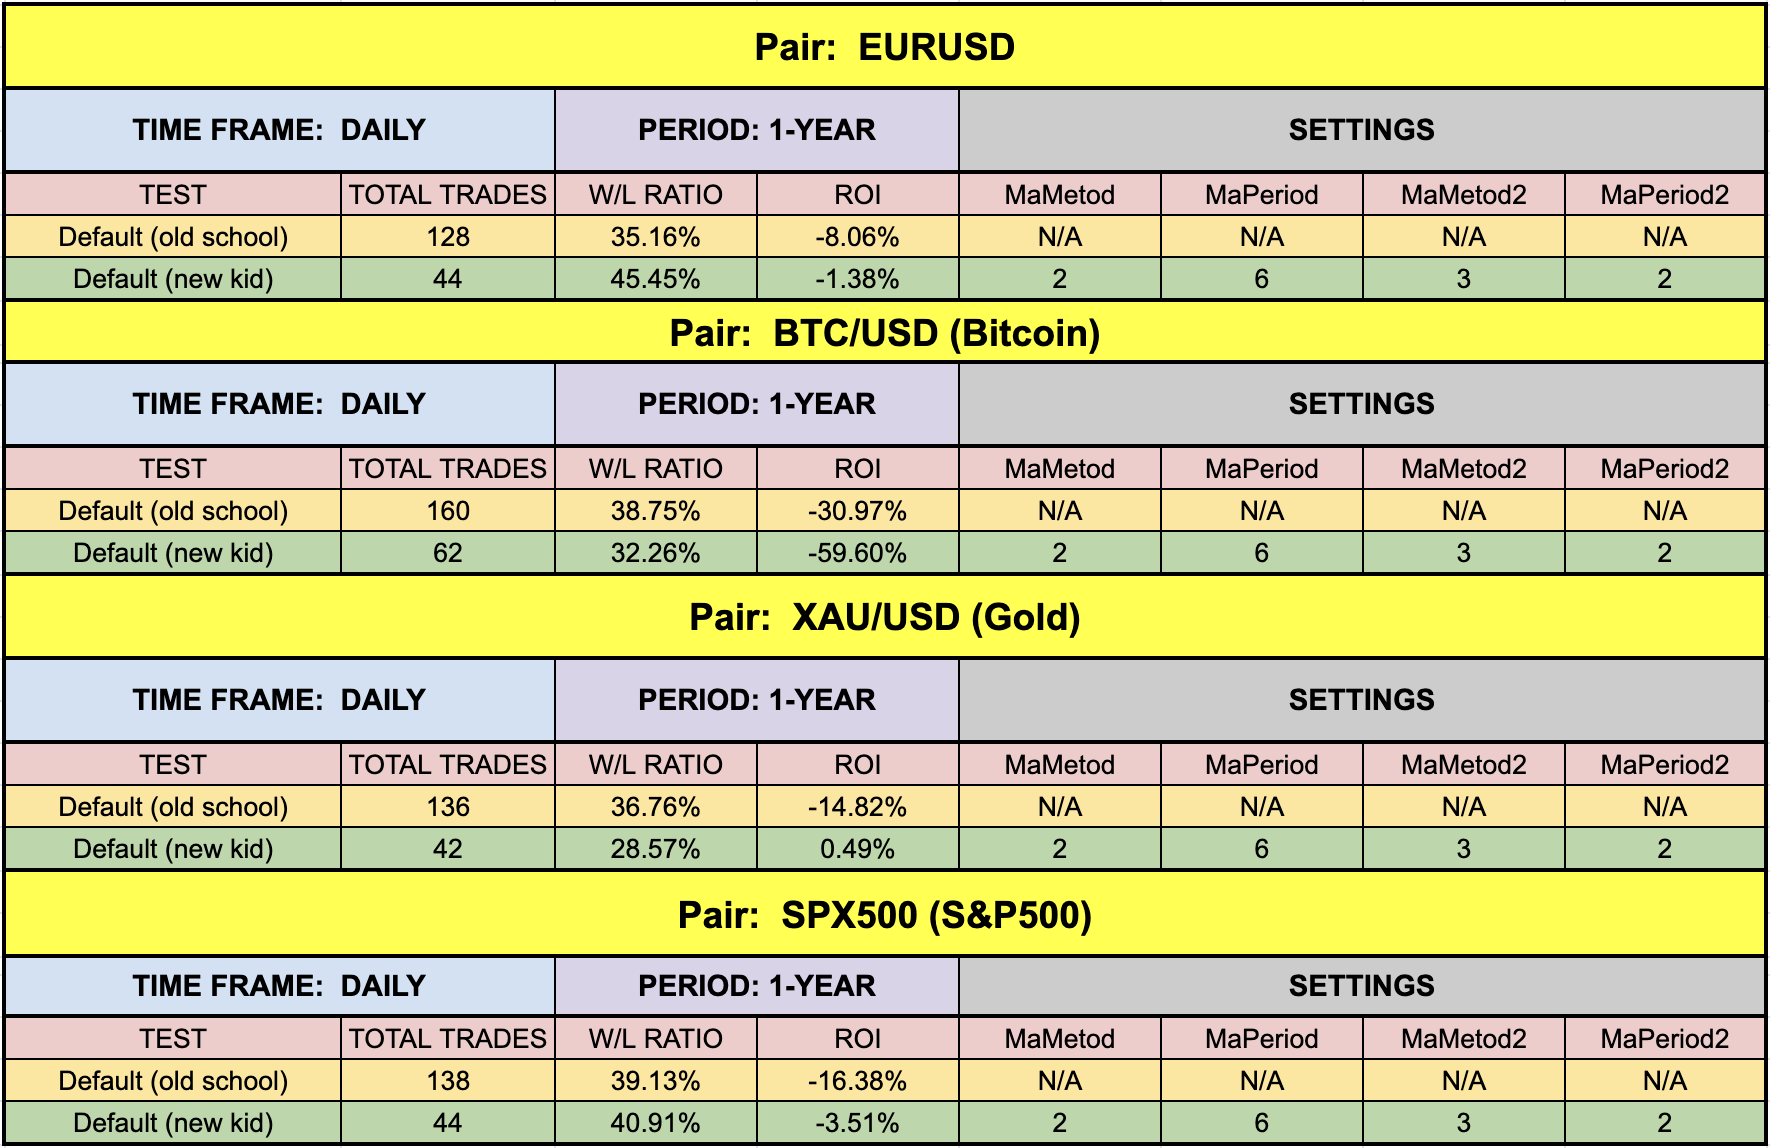
Great question. Why mess with a good thing. Old school has been around for 300 years. Why improve it? That being said, let’s do a simple side by side comparison. We’ll run tests on the Heiken Ashi against the smoothed version (using default values) before we get into the full on testing with the tweaked settings.
EUR/USD – Nearly break even on the smooth version.
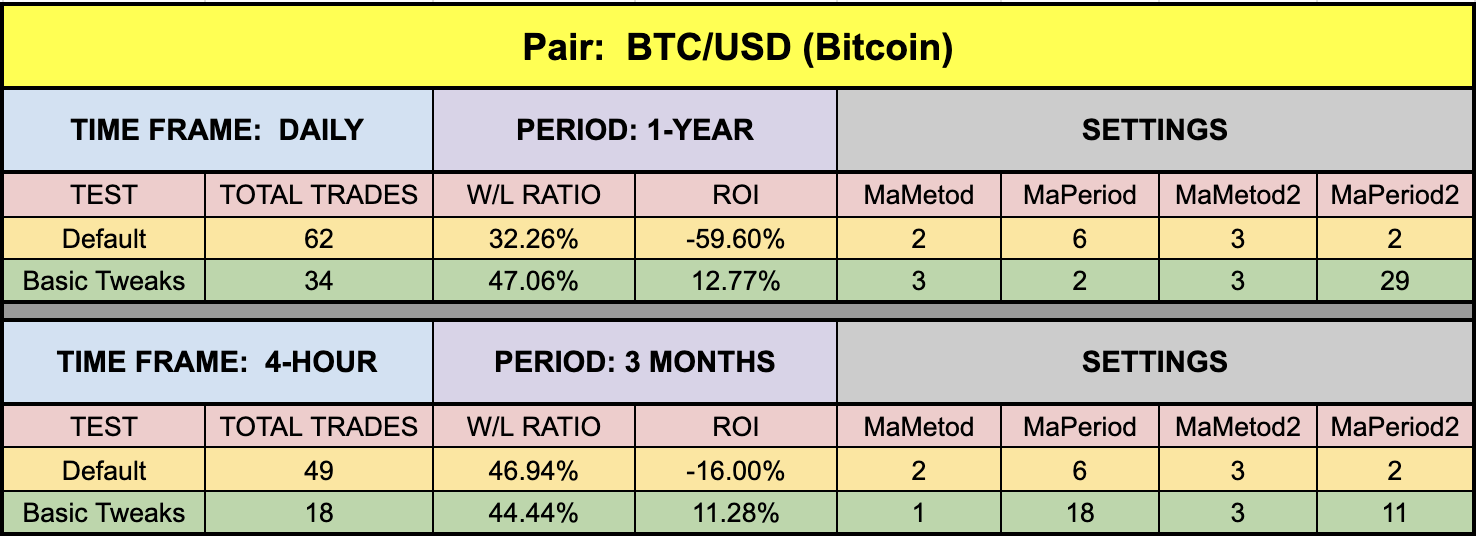
BTC/USD – Old school did less terrible here, but both ROI are awful.
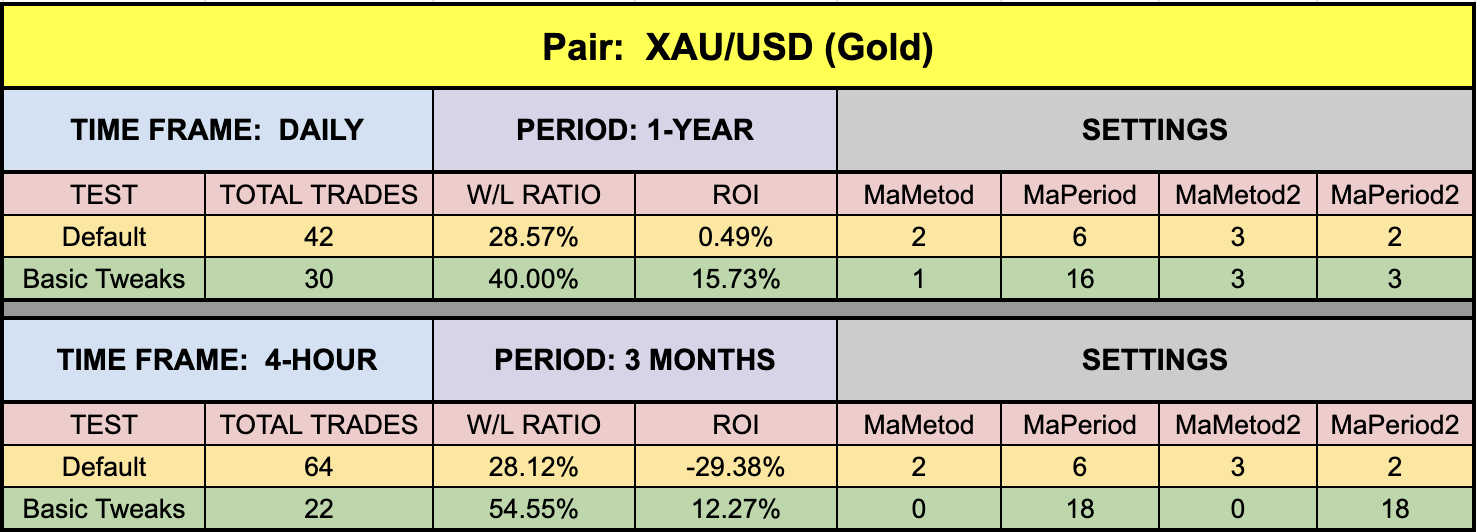
XAU/USD – Smoothed actually posted a slightly positive ROI!
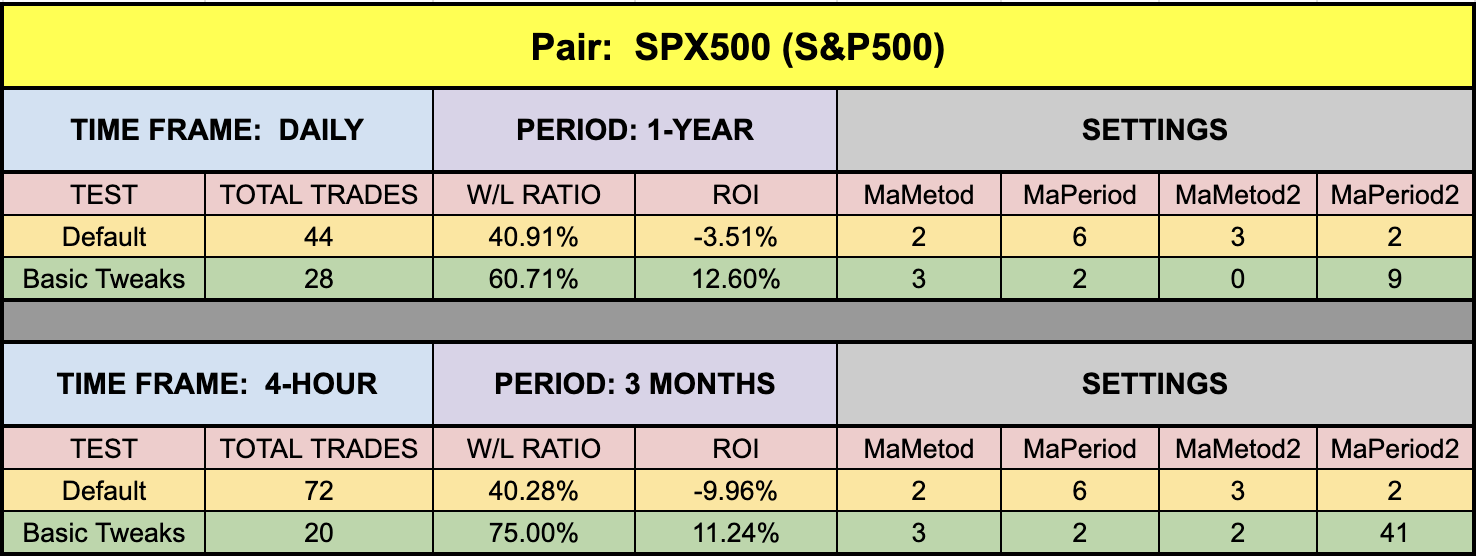
SPX500 – Smoothed was a little below break even.
Now that we’ve decided that the smooth version is a better place to start, let’s get on with the full on testing…drivers; start your engines!
Testing…Testing…Testing…
Remember, comprehensive analysis is strongly suggested, and we advocate backwards and forward testing indicators or systems prior to trading actual funds. We propose conducting your tests on the following pairs.
EUR/USD
AUD/NZD
EUR/GBP
AUD/CAD
CHF/JPY
CAD/SGD
If it doesn’t work on these 6 pairs, chances are it won’t work on other pairs. This is not an absolute, but we’ve found this rule is reliable in most cases.
The markets we test our indicators are the:
EUR/USD (Euro/US Dollar)
BTC/USD (Bitcoin/US Dollar)
XAU/USD (Gold/US Dollar)
SPX500 (S&P500 Index)
Timeframes and Results
In our initial test, we’ll run the Heiken Ashi Smooth indicator on the EUR/USD, BTC/USD, XAU/USD, and the SPX500 using the default settings across the daily and 4-hour timeframes on the MT4 strategy tester. We use the fast method of testing the indicator to get a general idea; however, you may also run the tick-by-tick data set for a more precise result (which takes considerably more time).
As No Nonsense Traders – and therefore Swing Traders, we will not examine shorter time frames in these studies. We will also run an additional test, using different values for the settings, to analyze which one may work better and examine the following results:
Total trades
Win/Loss ratio
ROI (return on investment)
There are other metrics included in the strategy tester report, which can be compared, but these three metrics provide the necessary gauge to make quick decisions as to the usefulness of a particular indicator and its settings.
Next, for comparison, we’ll explore the following;
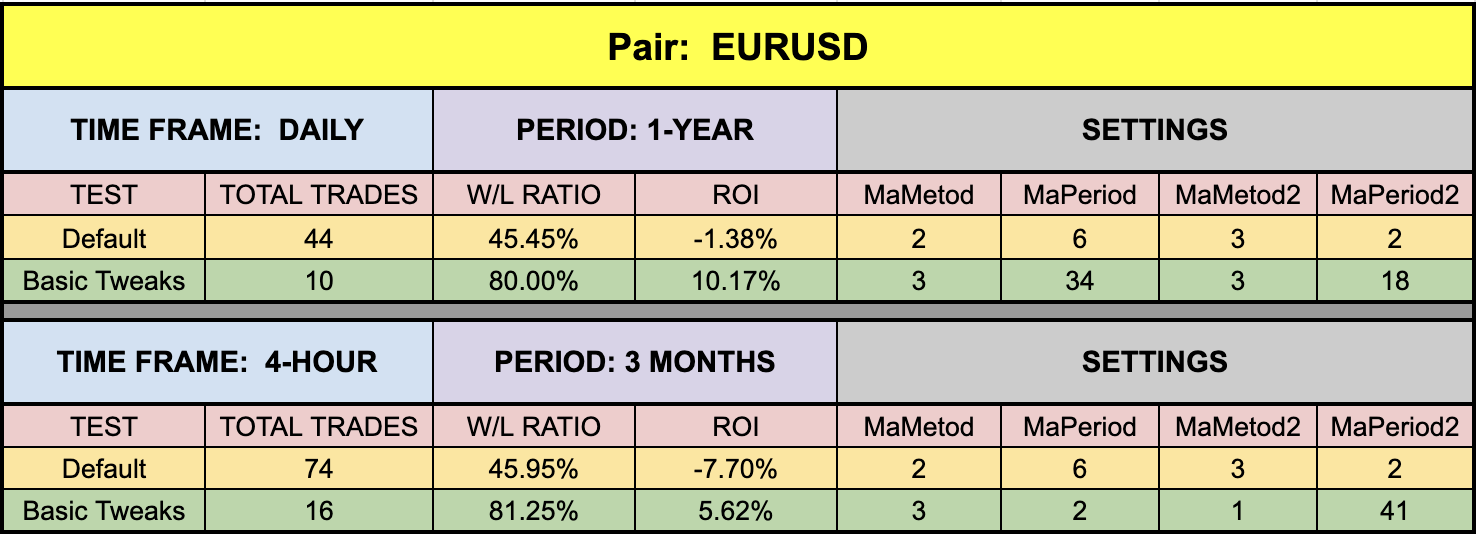
Daily – 1 year
4-hour – 3 months
The reason exceptionally long (or short) testing periods are not included is due to changing market conditions, which might return irrelevant information. A balance of statistically significant data is necessary for accurate results.
And the Outcome…
Below are the spreadsheets illustrating the results from our tests.
The green highlighted rows represent “basic tweaks” on the settings which returned better results. Are these the best? Not necessarily. Given that variables including testing date range and broker data are different from person to person, you may find better settings.
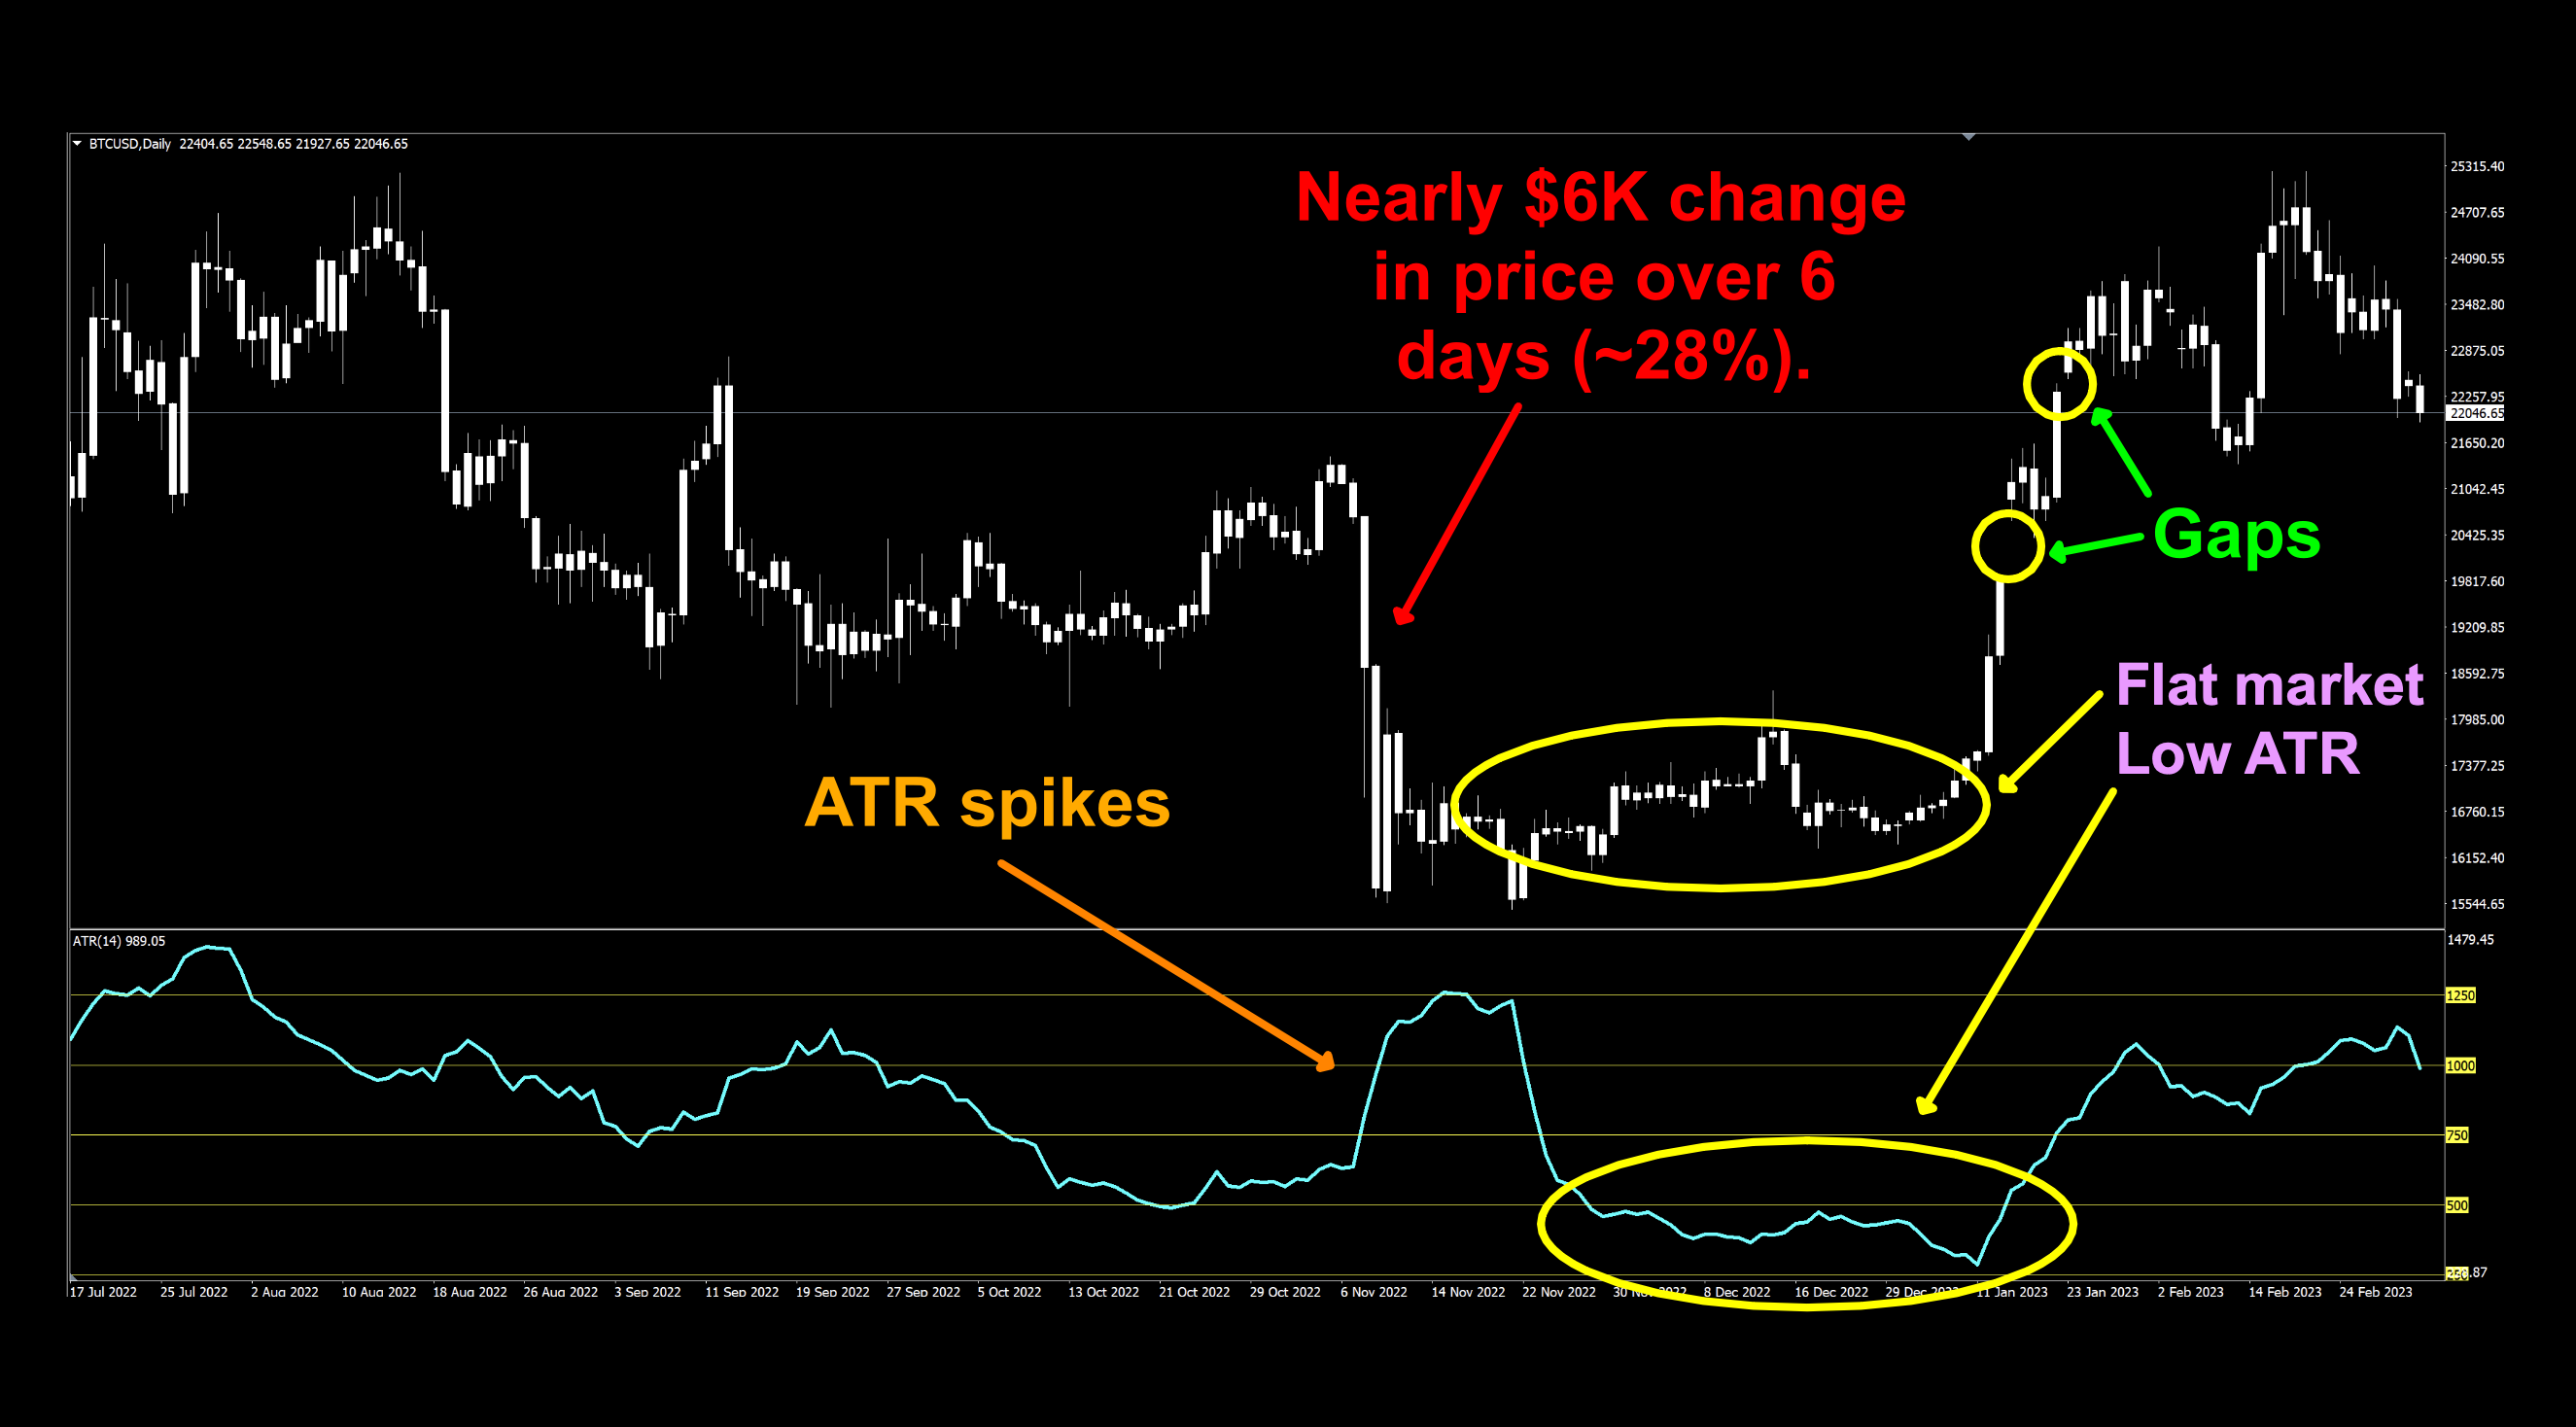
Bitcoin – Why So Lousy?
As you’ve read in the past couple of weeks, we’re including the issue with Bitcoin again this week for those who are just finding us. The default ROI is horrible…and that’s because of a few issues with price and its relationship with the indicator. There are reasons…
Massive price swings
Huge ATR spikes
Flat market conditions
Gaps in price action
Daily ATR levels are on the right side (in yellow); $250, $500, $750, $1000, $1250 to demonstrate just how wide the ATR range really is.
Craziness
With the highly reactive and volatile movements of Bitcoin, many indicators just can’t keep up with the action. This creates strange numbers. Naturally, trending markets will yield better results, but we report what we see.
Trust In Yourself
Remember, the overall NNFX philosophy of taking profit, risk, and drawdown is that YOU are creating a system which YOU will be trading. Don’t let anybody else take that away from you. Part of the learning process is digging in and doing the work yourself. To learn more about these topics, check out the Advanced Course!
That being said, the results we post in these blogs should never be considered specific trading advice.
***Note: Remember, never use just this one indicator as your decision of whether to open or close a trade. It should be part of a system.
Money Management
If you are curious as to what money management is used on our tests; we have a certain way of determining wins and losses, which can be found in the Advanced Course. Our goal here is to determine how well the indicator reacts to price with respect to producing a long or short signal. Your system, with its risk profile, will dictate individual returns.
Resources
As we did with past indicator studies, we’ve made the Heiken Ashi Smooth is available for download on our site from the indicator library. We will keep adding better indicators with each study for your use, at no charge. When you’re ready to get it, click HERE.
More to Come
There’s a lot more to come. We are excited to provide more trading tips in the near future. Sign up on our contacts page or subscribe to our YouTube channel. Receive early notifications as we continue to publish helpful, relevant, and informative Forex related material to support your quest to become a better trader.
And, now you are aware of another indicator that many traders don’t know or use.
Our only goal is to make you a better trader.
BTW – Any information communicated by Stonehill Forex Limited is solely for educational purposes. The information contained within the courses and on the website neither constitutes investment advice nor a general recommendation on investments. It is not intended to be and should not be interpreted as investment advice or a general recommendation on investment. Any person who places trades, orders or makes other types of trades and investments etc. is responsible for their own investment decisions and does so at their own risk. It is recommended that any person taking investment decisions consults with an independent financial advisor. Stonehill Forex Limited training courses and blogs are for educational purposes only, not a financial advisory service, and does not give financial advice or make general recommendations on investment.
Join WaitlistWe will inform you when the product arrives in stock. Please leave your valid email address below.
 In the classic version, you cannot change any of the settings, except for candle colors. So whatever you saw, that’s what you traded.