It’s Been a Minute
So…it’s been a bit since we’ve done a baseline indicator…eleven blogs to be exact. That being said, we figured we’d throw one in the mix. This indicator is called T3, and we can guarantee it won’t be found on a fresh MT4 download.
Cool Math Guy
The T3 indicator was developed in 1998 by Tim Tillson and featured in the January 1998 issue of Stocks & Commodities. Mr. Tillson was not only a Project Manager at Hewlett-Packard, he traded multiple markets for 15 years. We love a math guy who trades. It gives us a higher level of trust. By the way, the indicator version we use was coded much more recently by our prolific coder friend Gehtsoft in 2015.
Hide And Seek
While a baseline may seem pretty innocuous because it’s just a simple line, there is a lot going on in the background. Not only are there components in this indicator that smooth the signal line (filter), it reacts quicker than most moving averages. So it can be said that it is both “composite” and “adaptive”.
Baseline Indicator
The way we’re going to use the T3 is a baseline is like any other baseline. Naturally, it overlays price action and serves as either the first or second “check point” of your algorithm. Be careful with this one, though. The very nature of it can cause the signal line to “overshoot” as it attempts to align itself with changing market conditions.
In a Loop
The math involved with this indicator is as follows:
T3 = c1*e6 + c2*e5 + c3*e4 + c4*e3, where:
e1 = EMA (Close, Period)
e2 = EMA (e1, Period)
e3 = EMA (e2, Period)
e4 = EMA (e3, Period)
e5 = EMA (e4, Period)
e6 = EMA (e5, Period)
– “a” is the volume factor, which is one of the settings which we’ll take a look at later.
– c1 = – a^3
– c2 = 3*a^2 + 3*a^3
– c3 = – 6*a^2 – 3*a – 3*a^3
– c4 = 1 + 3*a + a^3 + 3*a^2
And there you go…
Follow the Yellow Brick Road
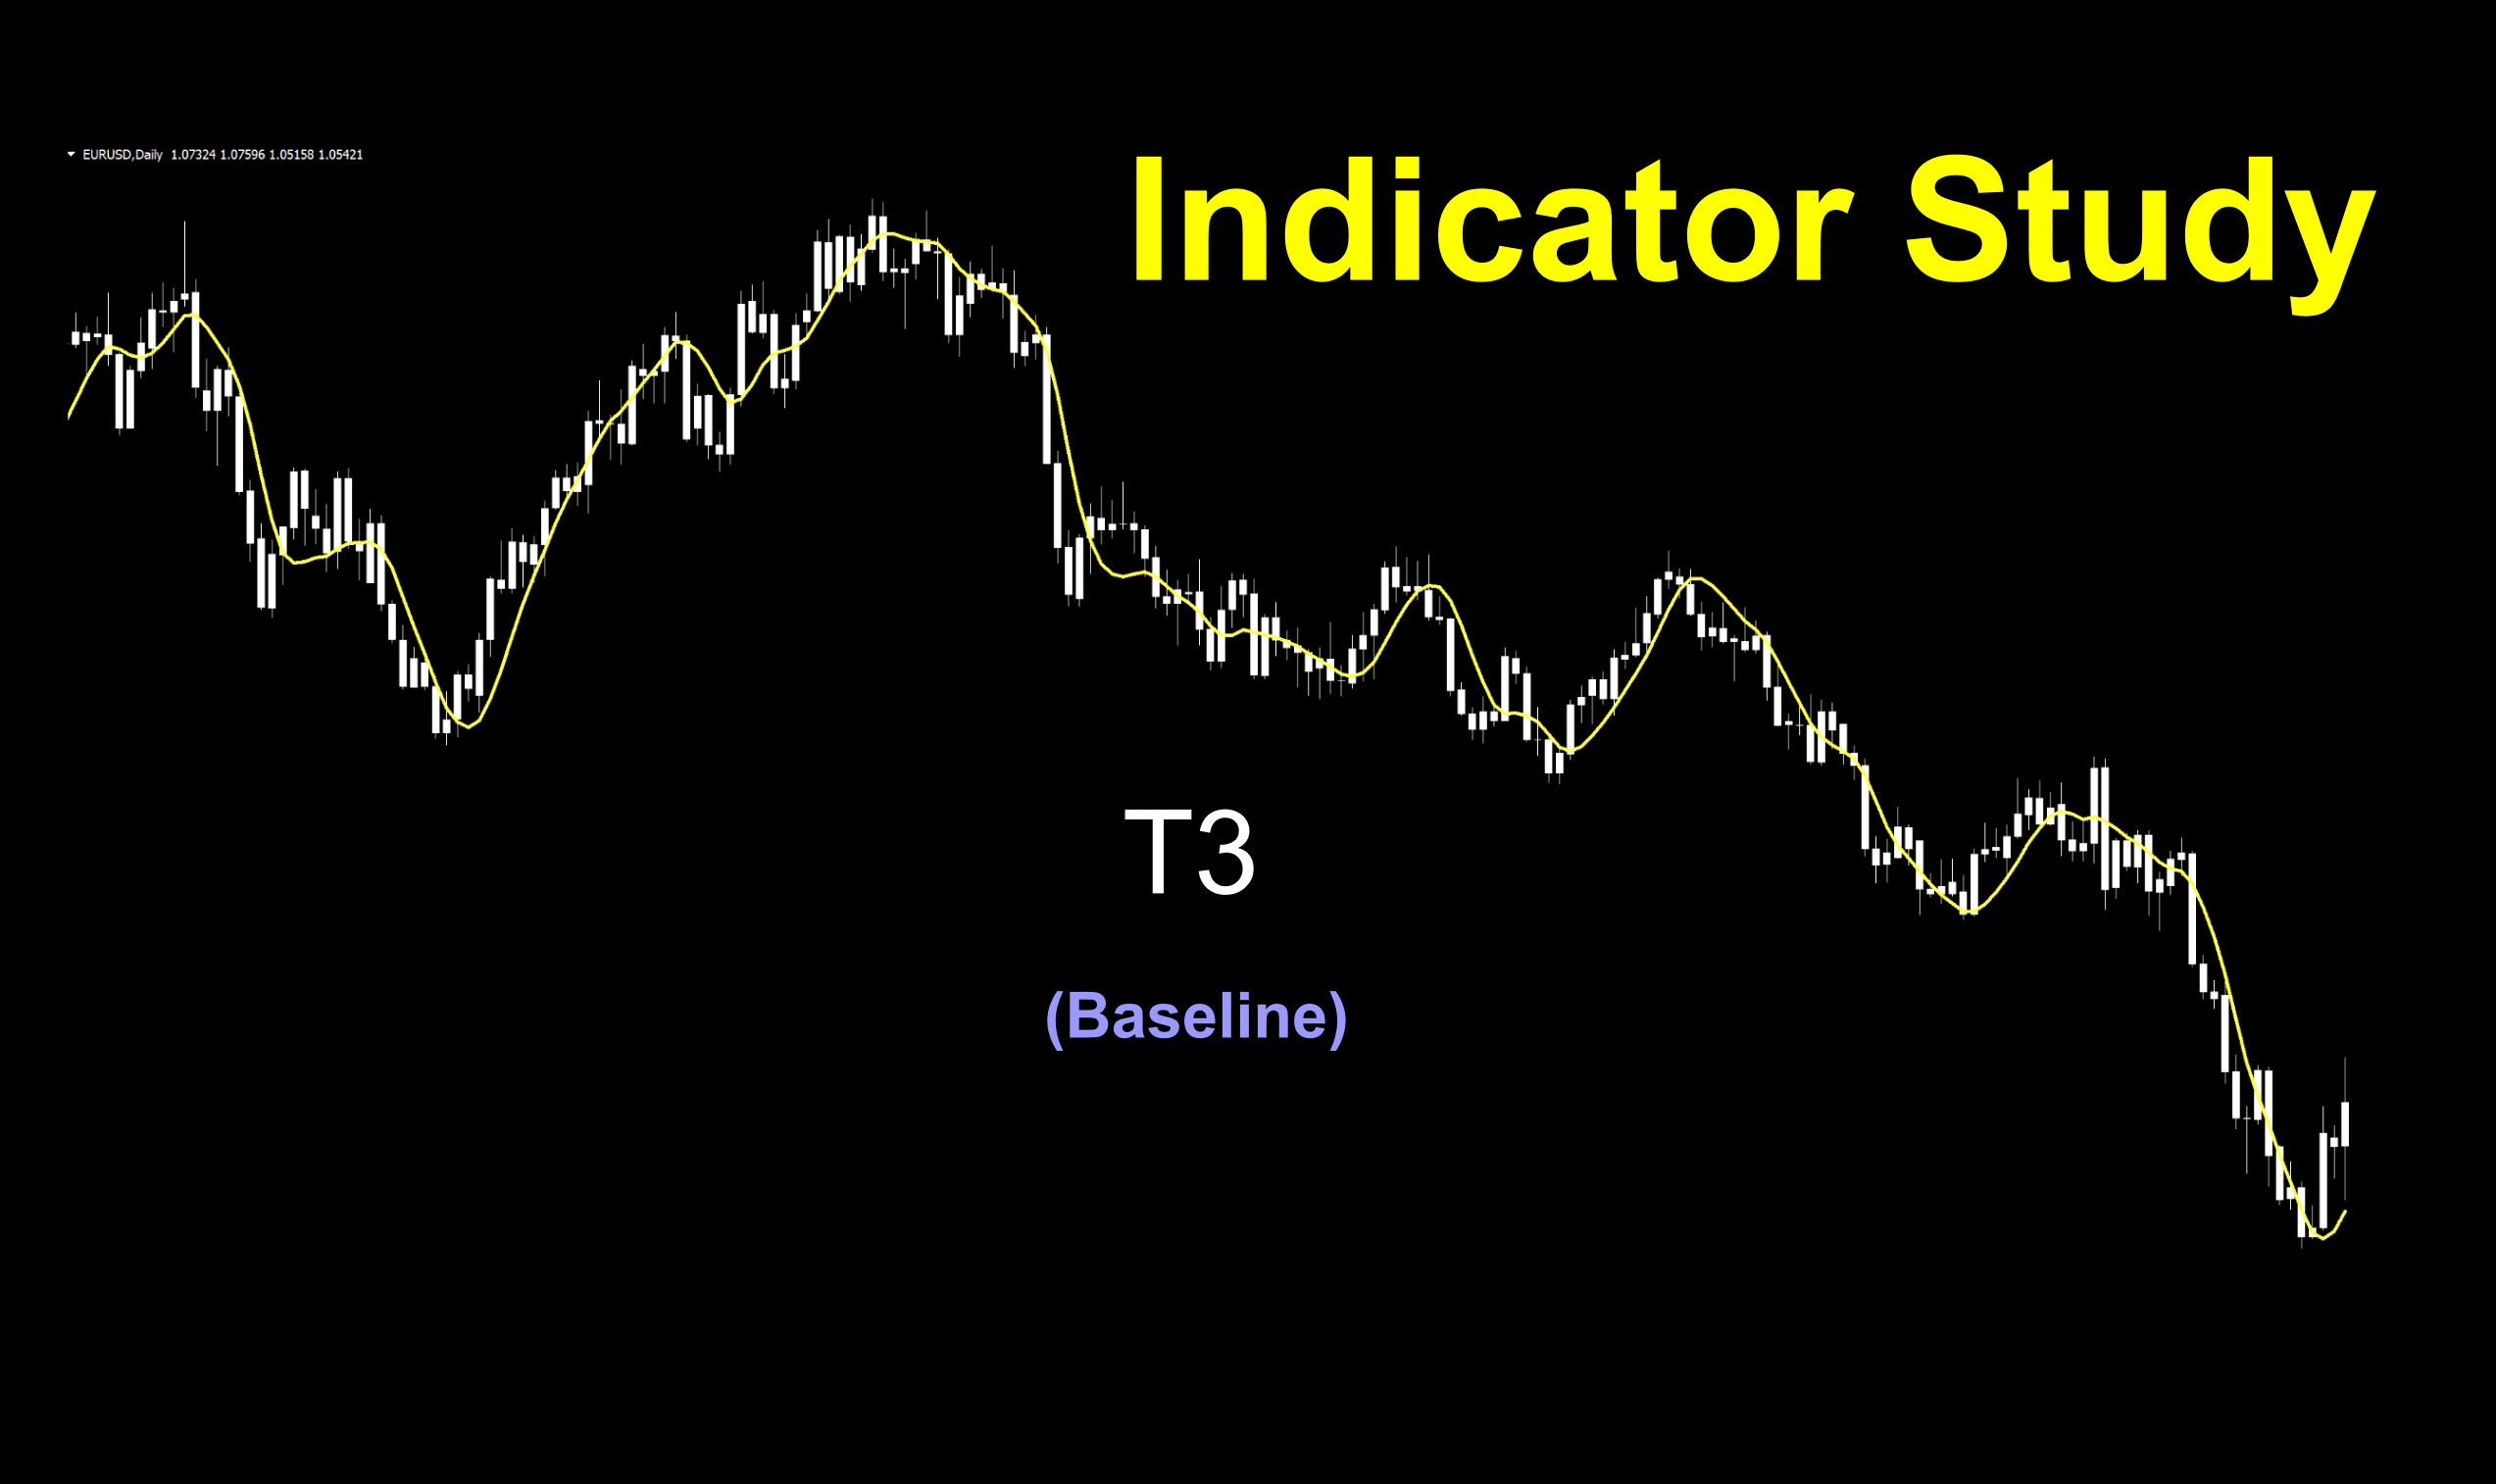
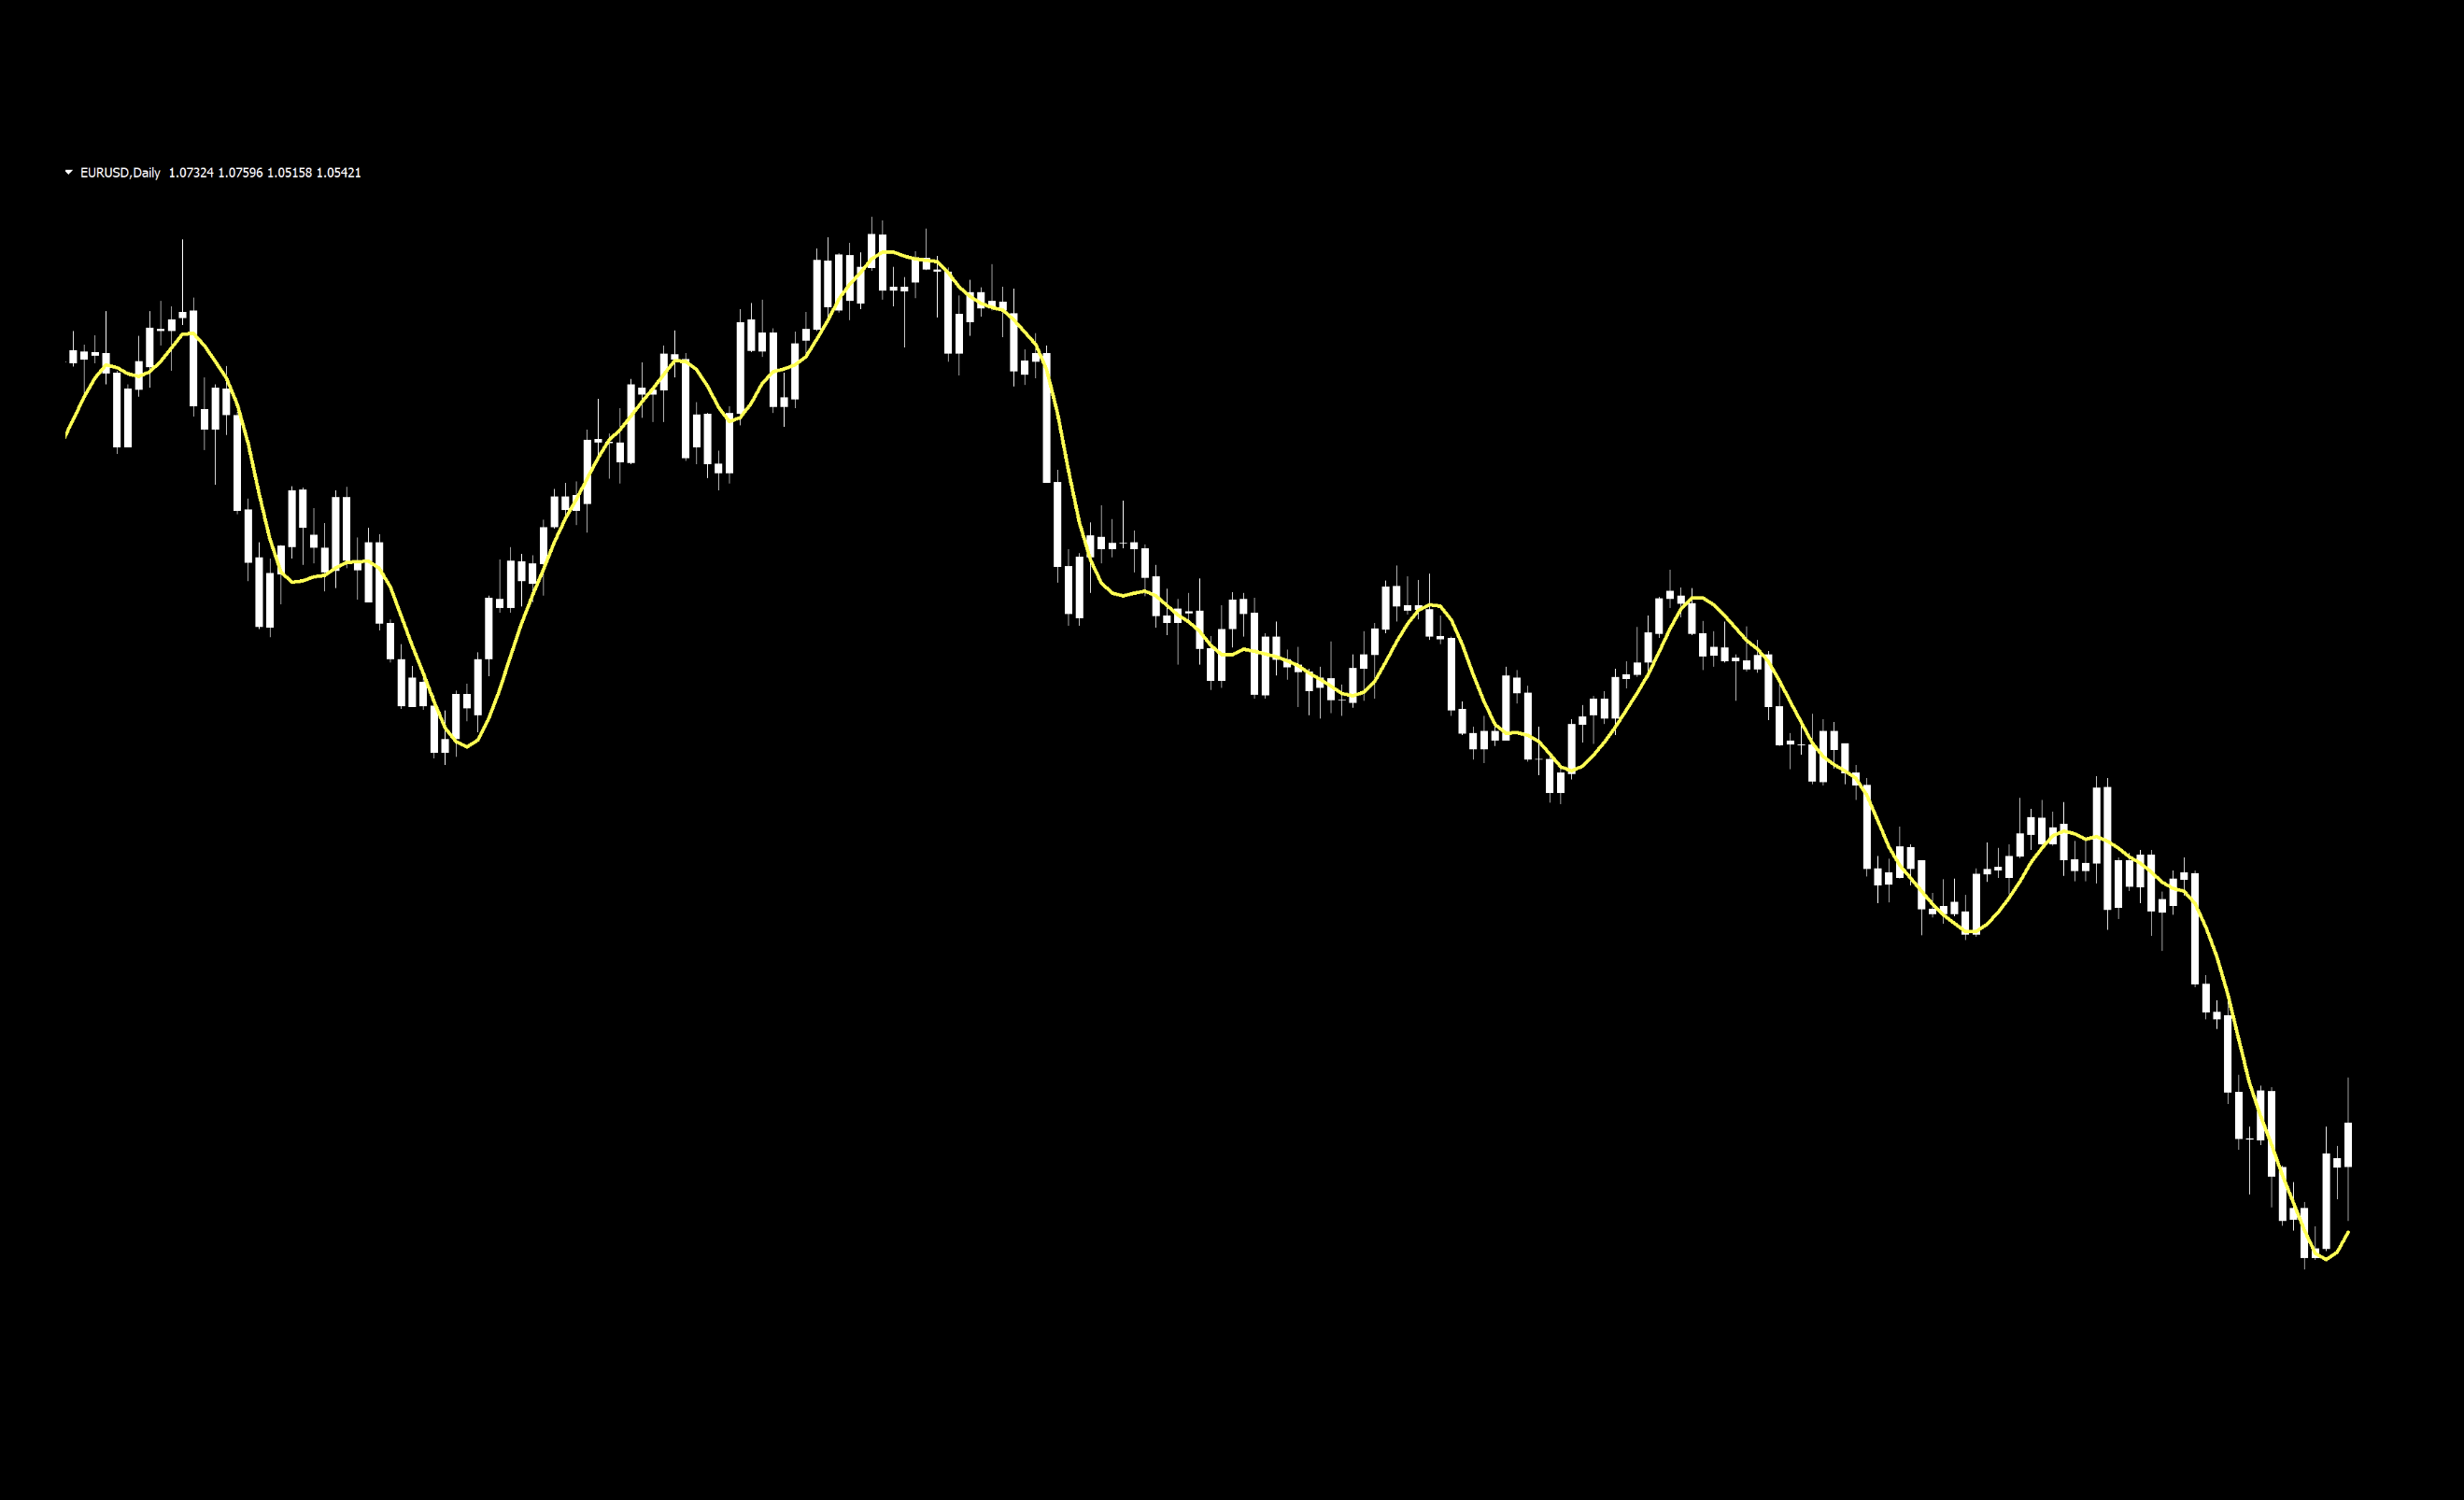
The default view of the indicator is pretty simple. Just a single line on the chart. We’ve made it a bit thicker (but left it yellow) for easier viewing. And naturally, the candles are white to give it some contrast and to remove any chart bias of colored candles. But we’ll change the candles shortly to see where the signals are.
Settings
This indicator has three variables in the settings window. We use all of them. Below is the settings screen.
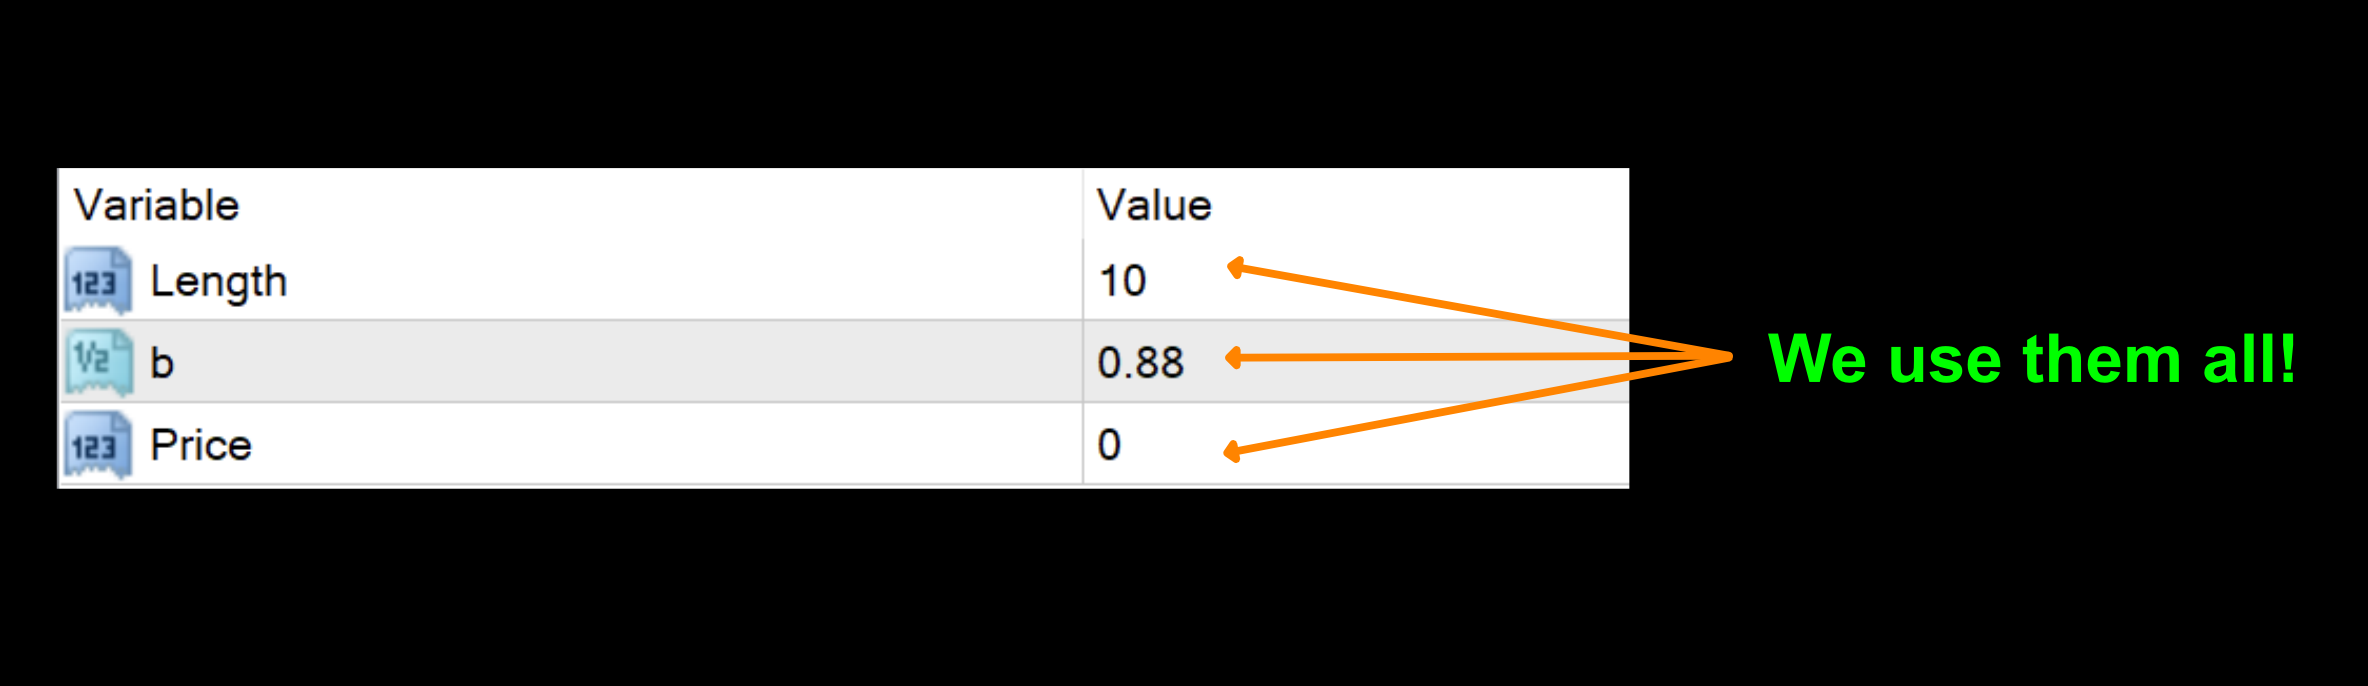
Length: The number of bars (or periods) the indicator looks back to gather data for consideration. The default value is 10.
b: This is the volume component of the formula. The default value is 0.88, but we used 1.0 as our starting point for testing.
Price: The specific price data set used for the calculations; 0-close, 1-open, 2-high, 3-low, 4-median, 5-typical, and 6-weighted. The default value is 0-closed.
Advantages
* Easy to identify long/short signals.
* One color, instead of multiple colors & lines.
* Easy to test.
How we use it
Long signal – When price crosses and closes above the signal line, your entry is made on the open of the next period.
Short signal – When price crosses and closes below the signal line, your entry is made on the open of the next period.
Let’s take a look at a marked up default chart to see where the entries would be.
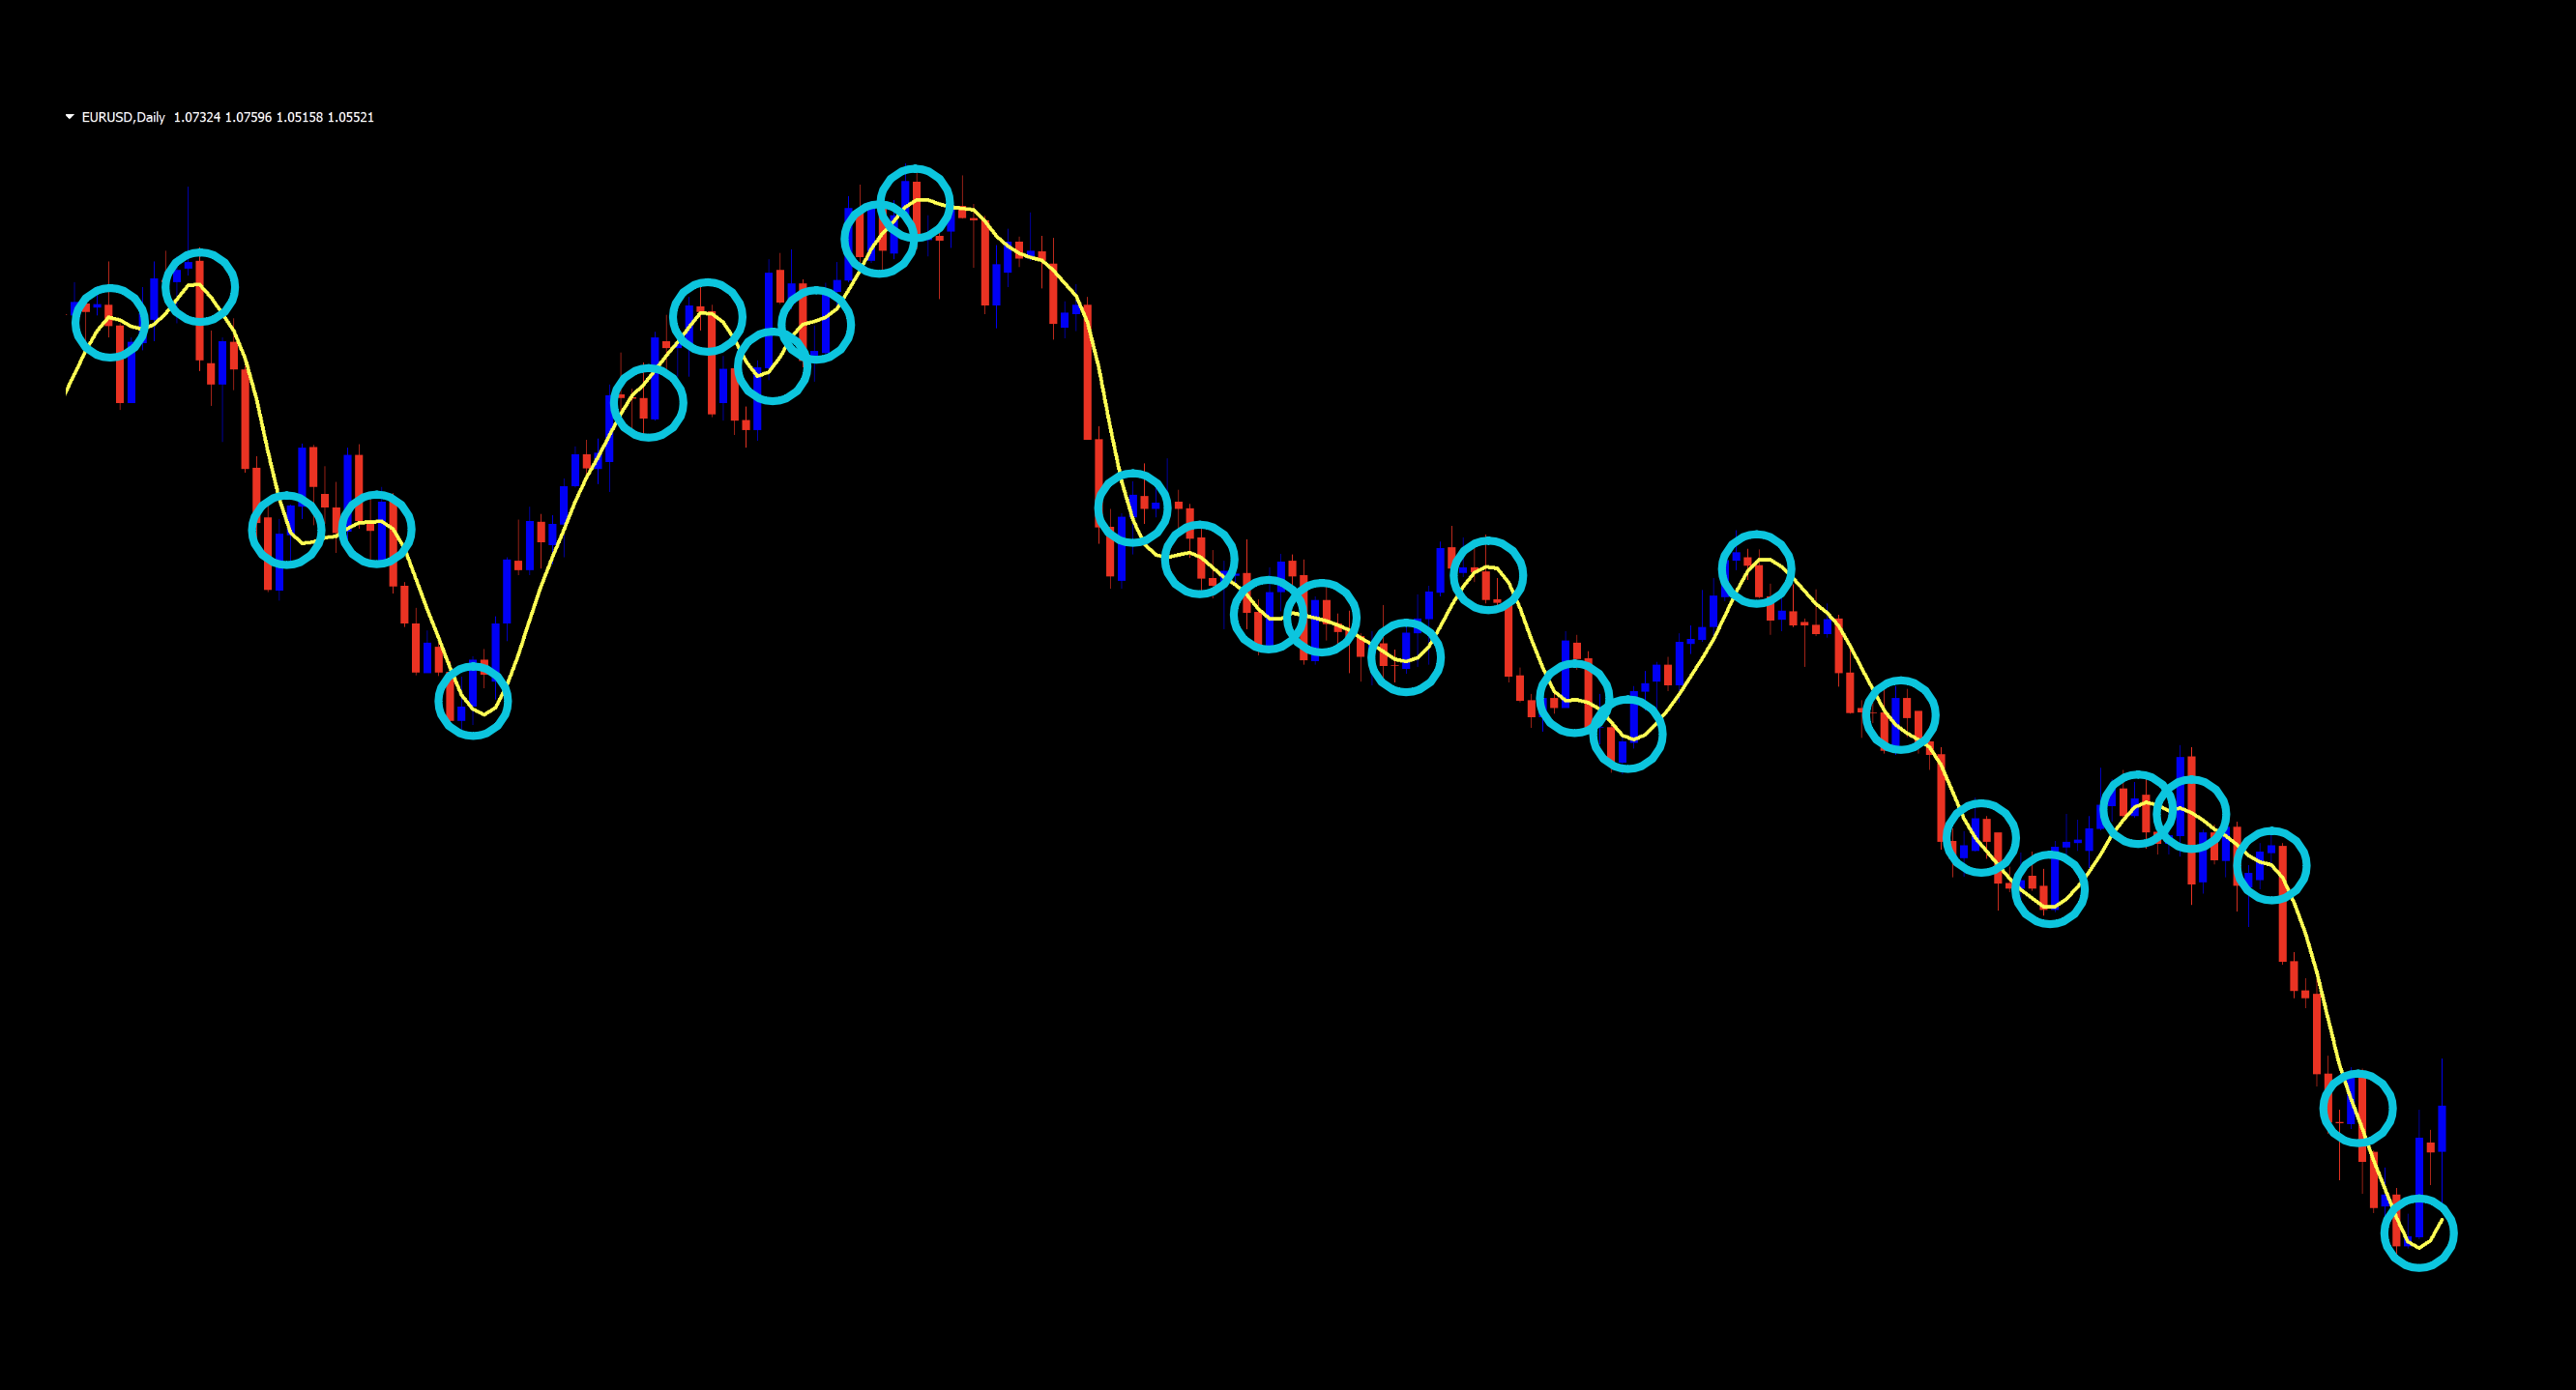
Have a Decaf
Lots of trades on the default settings. That’s the adaptive part of the program making a valiant attempt to keep you in the game. You may have noticed that there are a few places where prices crosses and closes above then immediately below price (or the other way around). This is normal. It happens when there is indecision in the market, coupled with volatility, creating non-directional momentum in price. That’s totally fine. Our trading psychology tells us to let our algorithm do its thing by filtering out some of these false signals before opening a position. Be patient. Let it come to you. And for your own brand of decaf, consider making a few tweaks to smooth the signal line a bit.
But…Exit?
Generally speaking, we don’t use baselines as exit indicators. There are so many other indicators that make better choices. Can you wholly discount using one as an exit indicator? Never discount anything in this game. Everything can be of value; especially when we have the power to change settings and see what relationships develop. How cool is that?
Testing…Testing…Testing…
Remember, comprehensive analysis is strongly suggested, and we advocate backwards and forward testing indicators or systems prior to trading actual funds. We propose conducting your tests on the following pairs.
EUR/USD
AUD/NZD
EUR/GBP
AUD/CAD
CHF/JPY
CAD/SGD
If it doesn’t work on these 6 pairs, chances are it won’t work on other pairs. This is not an absolute, but we’ve found this rule is reliable in most cases.
The markets we test our indicators are the:
EUR/USD (Euro/US Dollar)
BTC/USD (Bitcoin/US Dollar)
XAU/USD (Gold/US Dollar)
SPX500 (S&P500 Index)
Timeframes and Results
In our initial test, we’ll run the T3 indicator on the EUR/USD, BTC/USD, XAU/USD, and the SPX500 using the default settings across the daily and 4-hour timeframes on the MT4 strategy tester. We use the fast method of testing the indicator to get a general idea; however, you may also run the tick-by-tick data set for a more precise result (which takes considerably more time).
As No Nonsense Traders – and therefore Swing Traders, we will not examine shorter time frames in these studies. We will also run an additional test, using different values for the settings, to analyze which one may work better and examine the following results:
Total trades
Win/Loss ratio
ROI (return on investment)
There are other metrics included in the strategy tester report, which can be compared, but these three metrics provide the necessary gauge to make quick decisions as to the usefulness of a particular indicator and its settings.
Next, for comparison, we’ll explore the following;
Daily – 1 year
4-hour – 3 months
The reason exceptionally long (or short) testing periods are not included is due to changing market conditions, which might return irrelevant information. A balance of statistically significant data is necessary for accurate results.
And the Outcome…
Below are the spreadsheets illustrating the results from our tests.
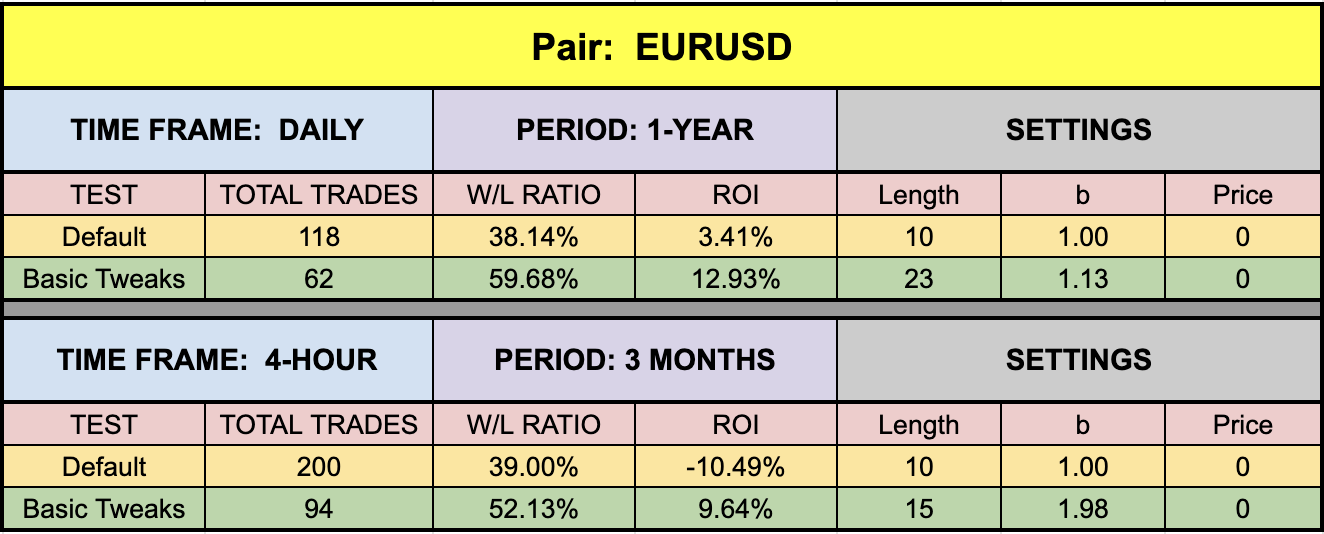
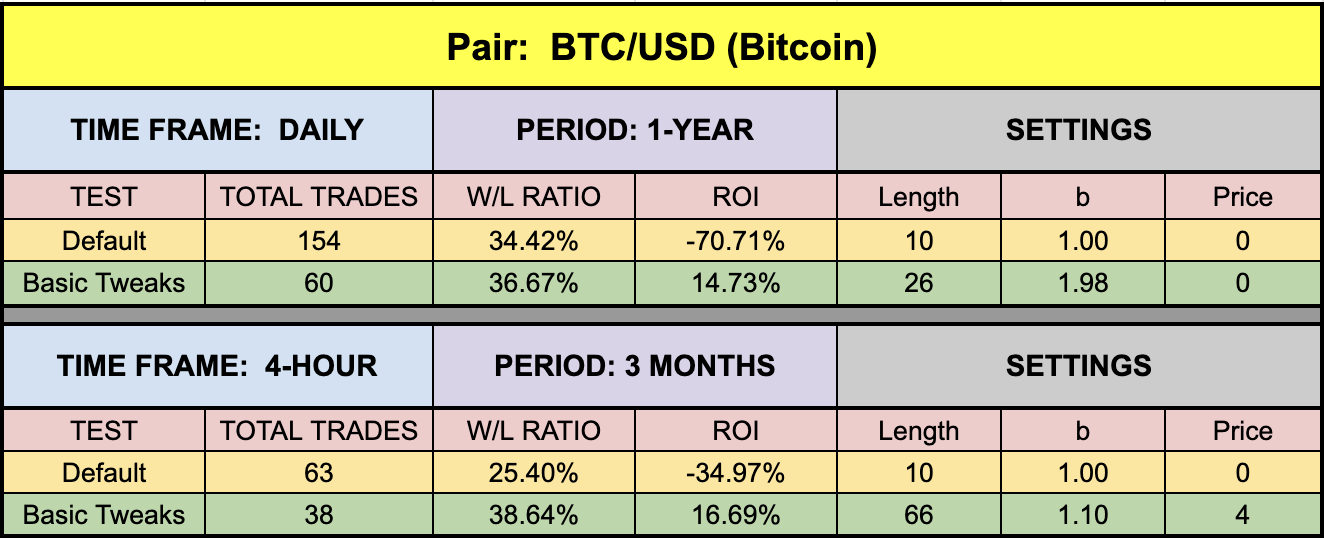
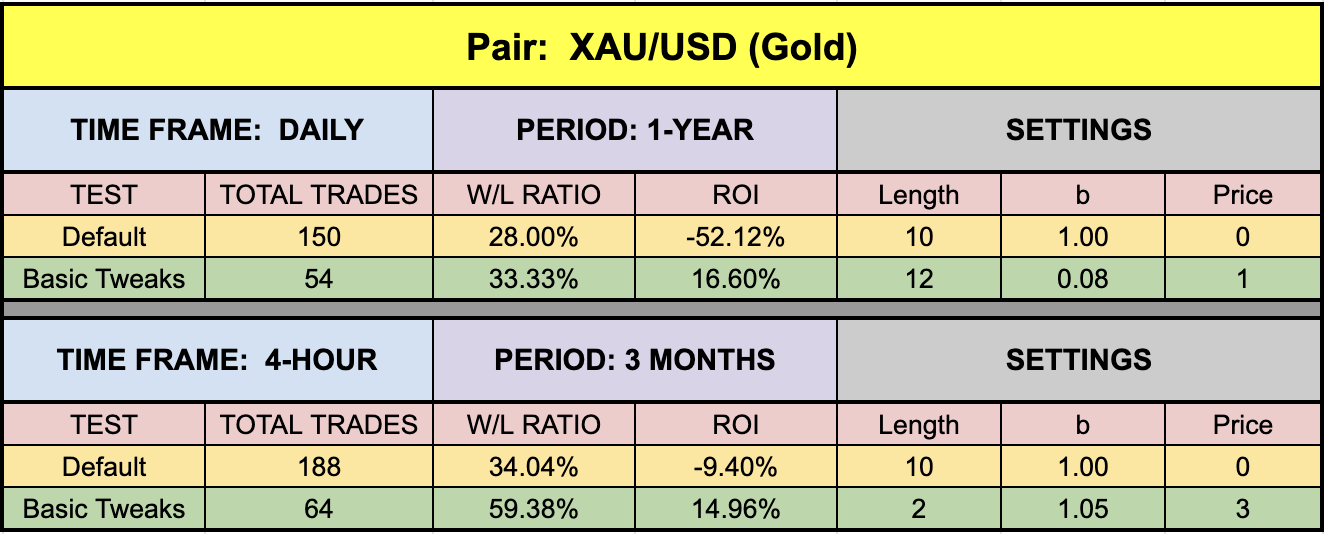
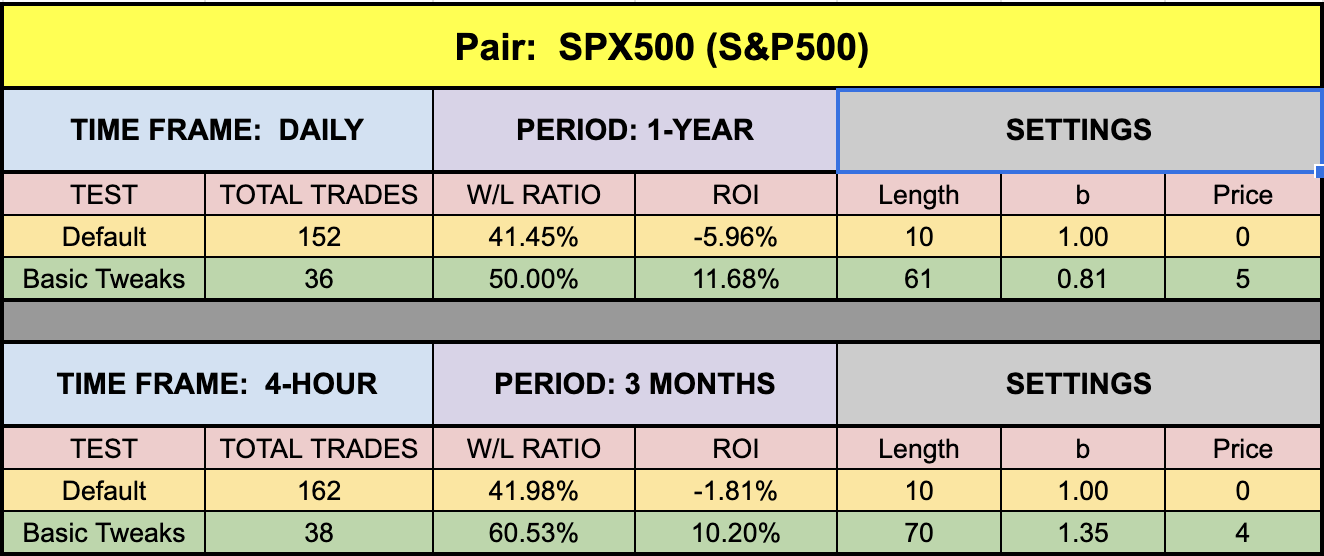
The green highlighted rows represent “basic tweaks” on the settings which returned better results. Are these the best? Not necessarily. Given that variables including testing date range and broker data are different from person to person, you may find better settings.
Bitcoin, What’s Up With You?
We posted this last week, but it bears mentioning again if you missed the blog on the Grucha Percentage Index. Throughout the blog series, Bitcoin numbers are pretty strange. There are reasons…which are:
Massive price swings
Huge ATR spikes
Flat market conditions
Gaps in price action
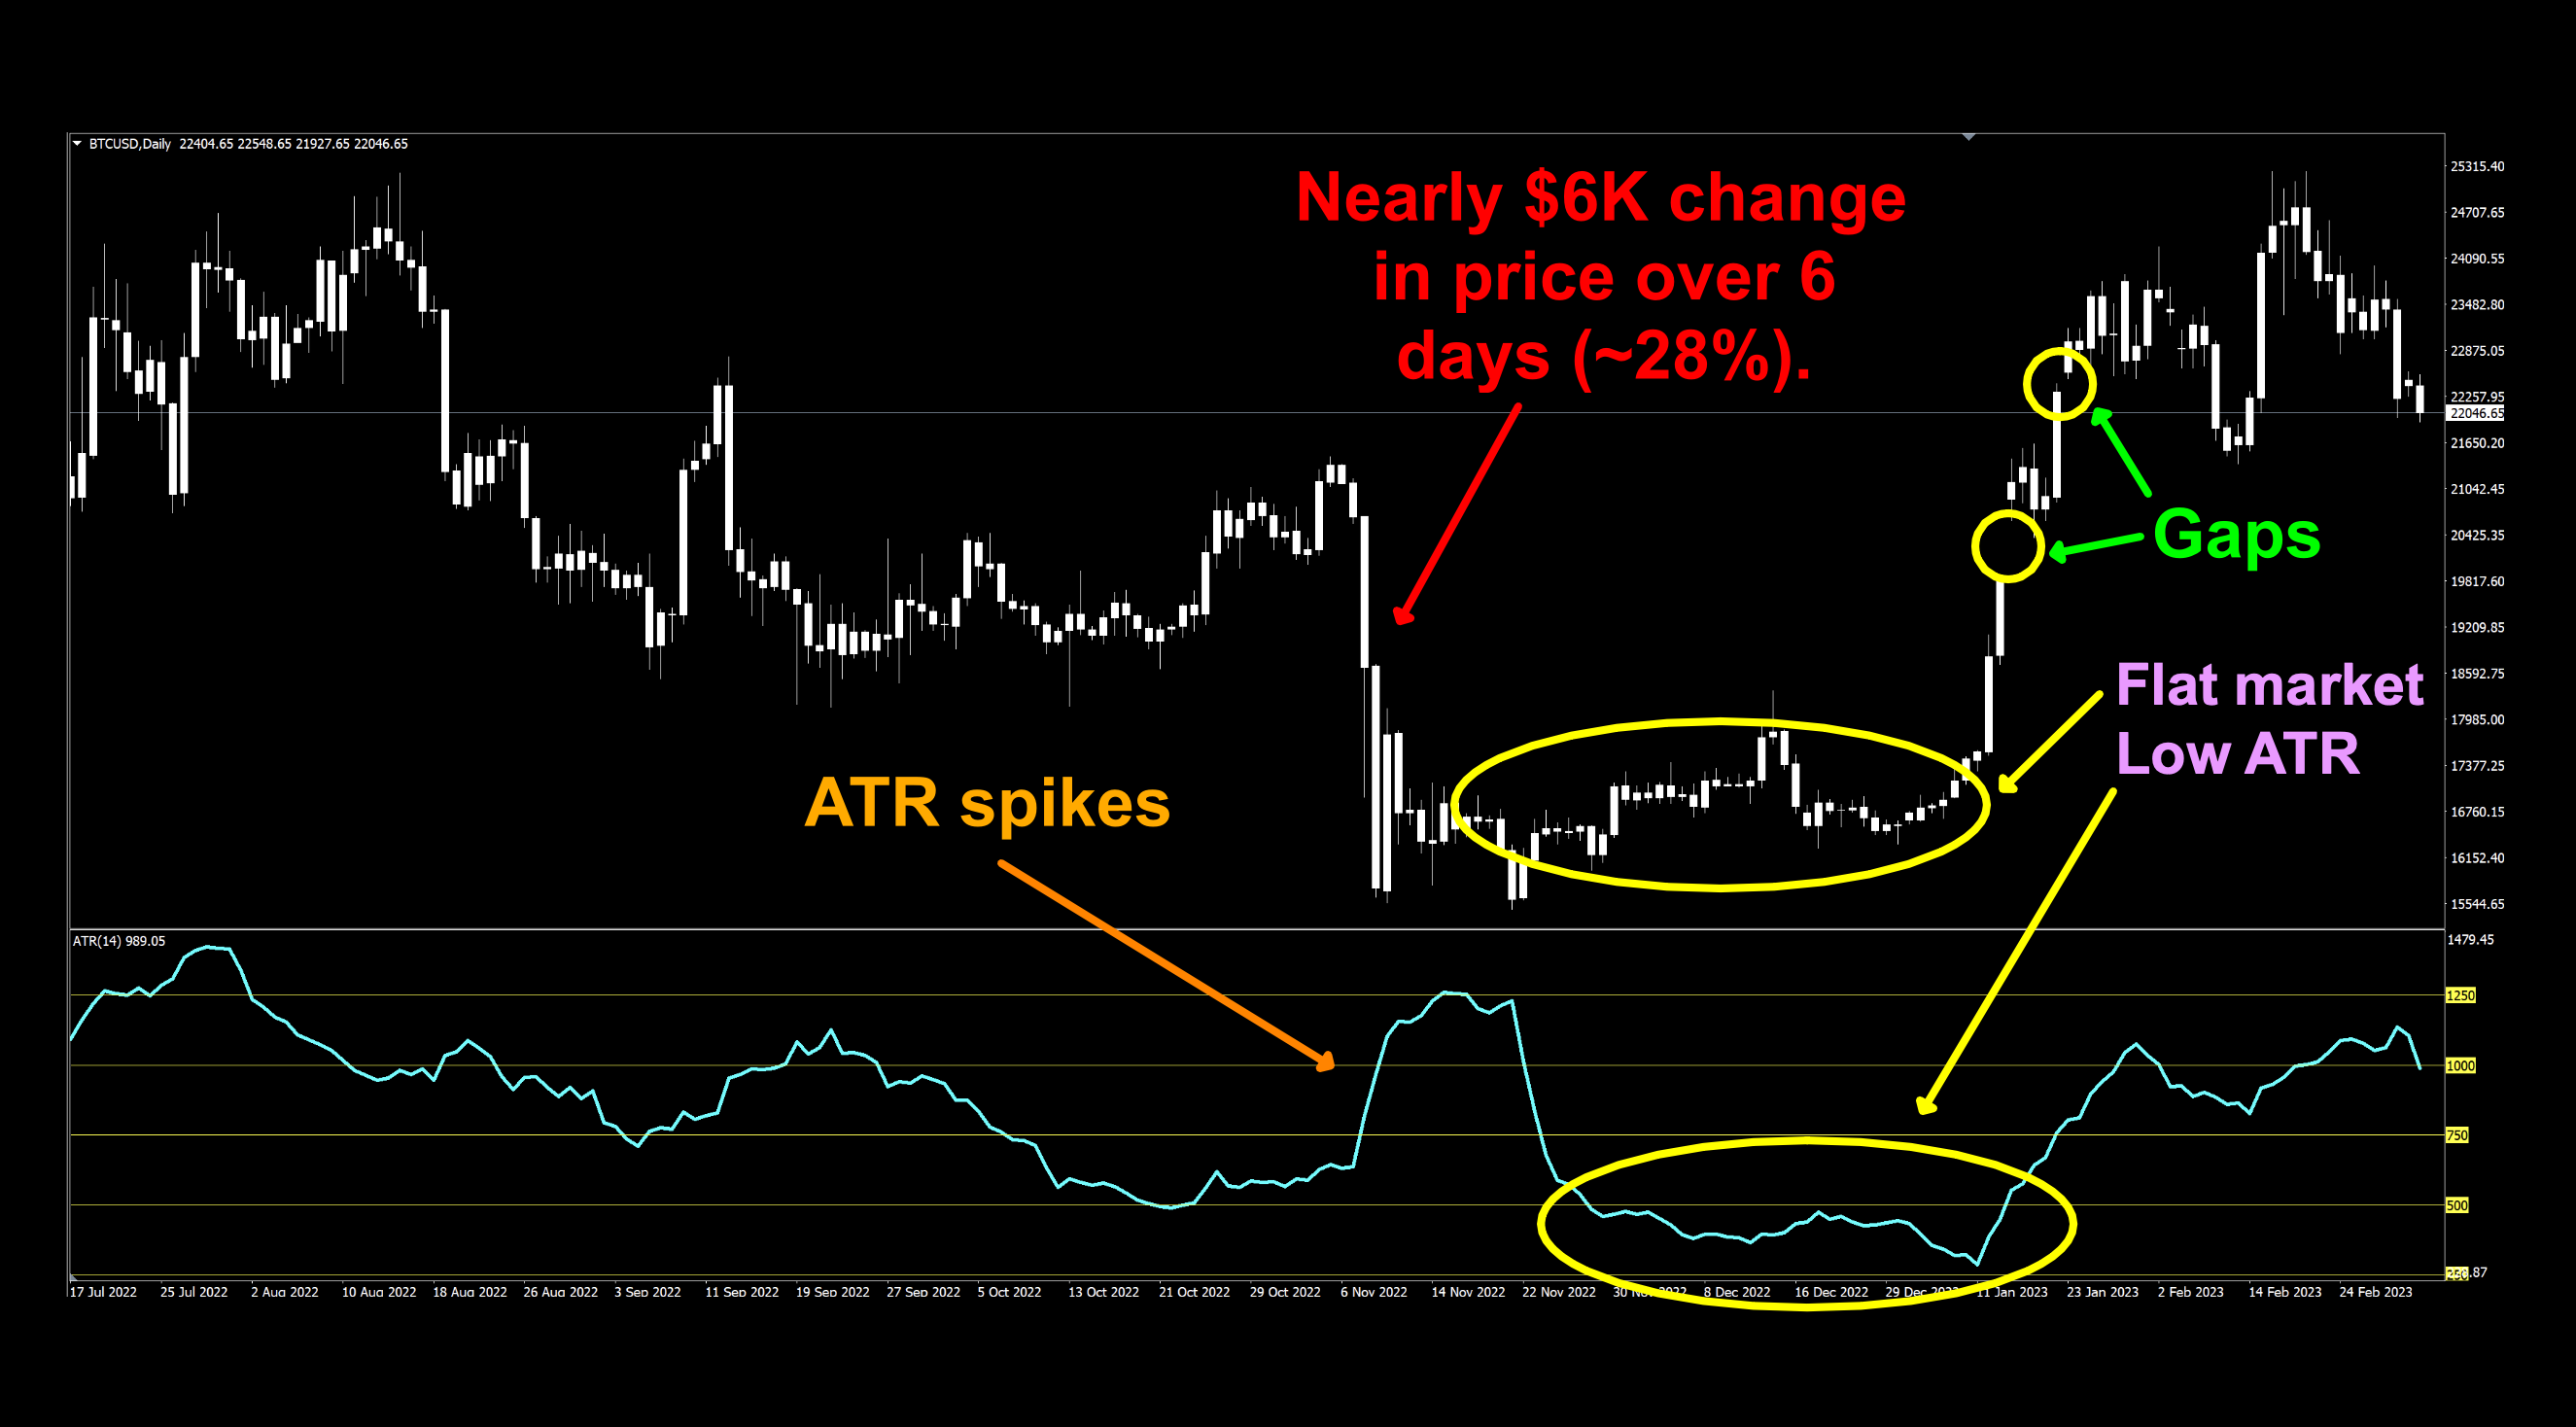
Daily ATR levels are on the right side (in yellow); $250, $500, $750, $1000, $1250 to demonstrate just how wide the ATR range really is.
Crazy Train
All of these conditions over short time spans during extended periods of time will create very different price/indicator reactions. It happens. We can’t control it – only react to it. That’s what we aim to share with you!
Trust In Yourself
Remember, the overall NNFX philosophy of taking profit, risk, and drawdown is that YOU are creating a system which YOU will be trading. Don’t let anybody else take that away from you. Part of the learning process is digging in and doing the work yourself. To learn more about these topics, check out the Advanced Course!
That being said, the results we post in these blogs should never be considered specific trading advice.
***Note: Remember, never use just this one indicator as your decision of whether to open or close a trade. It should be part of a system.
Money Management
If you are curious as to what money management is used on our tests; we have a certain way of determining wins and losses, which can be found in the Advanced Course. Our goal here is to determine how well the indicator reacts to price with respect to producing a long or short signal. Your system, with its risk profile, will dictate individual returns.
Resources
As we did with past indicator studies, we’ve made the T3 is available for download on our site from the indicator library. We will keep adding better indicators with each study for your use, at no charge. When you’re ready to get it, click HERE.
More to Come
There’s a lot more to come. We are excited to provide more trading tips in the near future. Sign up on our contacts page or subscribe to our YouTube channel. Receive early notifications as we continue to publish helpful, relevant, and informative Forex related material to support your quest to become a better trader.
And, now you are aware of another indicator that many traders don’t know or use.
Our only goal is to make you a better trader.
BTW – Any information communicated by Stonehill Forex Limited is solely for educational purposes. The information contained within the courses and on the website neither constitutes investment advice nor a general recommendation on investments. It is not intended to be and should not be interpreted as investment advice or a general recommendation on investment. Any person who places trades, orders or makes other types of trades and investments etc. is responsible for their own investment decisions and does so at their own risk. It is recommended that any person taking investment decisions consults with an independent financial advisor. Stonehill Forex Limited training courses and blogs are for educational purposes only, not a financial advisory service, and does not give financial advice or make general recommendations on investment.