Oldie, But Goodie
Our mission is to find newer indicators that mesh with the Foreign Currency market. Occasionally, we happen to stumble across an older indicator that actually does a pretty good job…because of the math. You won’t find this on the MetaTrader4 platform, and that’s the point. We’re bringing you indicators from other sources we feel might help you become a profitable trader. After all, that’s the brass ring, isn’t it?
Break out Your Bell-Bottoms
We’re going to roll back the clock to 1977 when Stephen Klinger developed the Klinger Volume Oscillator, also known as KVO. His goal was to predict long-term trends in money flow while detecting short-term fluctuations. In simple terms, it compares volume with price movements and transforms the data into an oscillator.
Cool, What’s That Mean?
For those of you who were awake during your upper level math classes, the KVO computes something called “Volume Force”, or VF…not to be confused with VP. As we’ll illustrate below, the VF is a complex algorithmic computation which includes both volume and trend. It doesn’t quite fit the bill as a classic volume indicator, so we’re treating it as a confirmation indicator.
We Don’t Do This
There are conversation points we discovered in our research that specified the indicator could be used a reversal or divergence signal indicator. However, it was noted that these methods may produce false signals in non-trending markets. We’ve found that it’s easier to just use it as a zero cross indicator. Remember, indicators can sometimes be used in more than one way.
“If A, then B”
Thankfully, computers in the late 1970s had evolved where they could be used for number “crunching”…especially in Mr. Klinger’s case. I’d imagine one would go through quite a few pencils calculating the KVO by hand, as seen below.
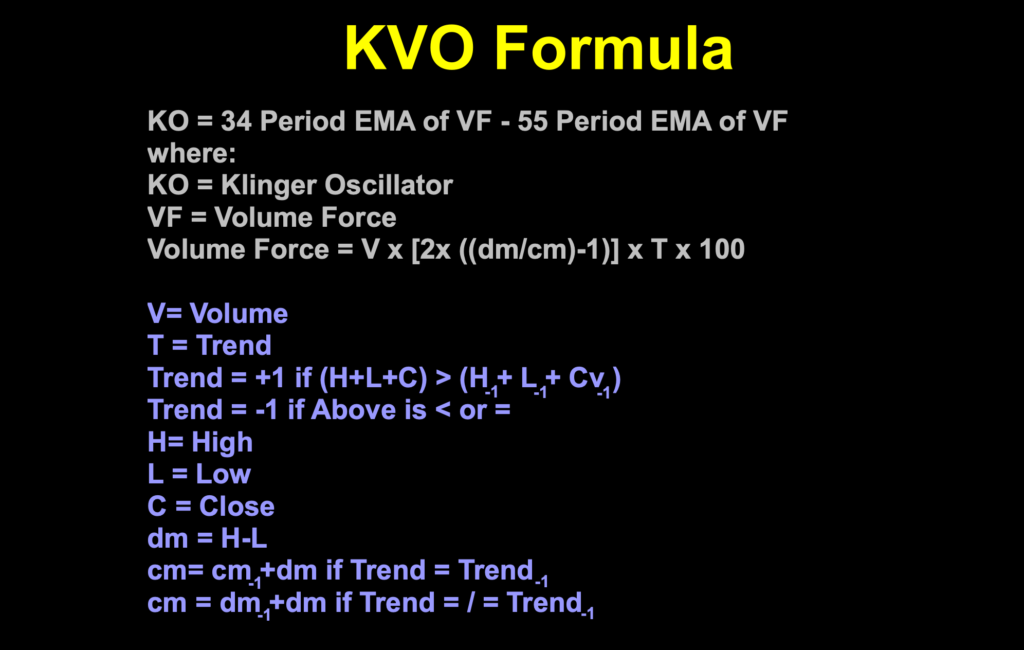
It doesn’t end there…
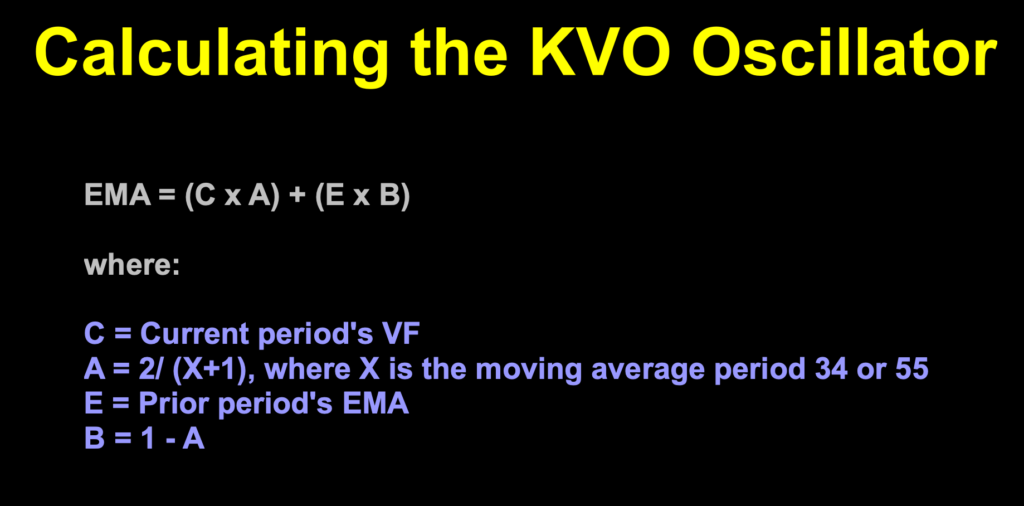
Yeah…thank you, modern processor.
Confirmation Indicator
As we mentioned earlier, this indicator does have volume components in the calculations but is not a typical volume indicator, so we didn’t test it that way. That being said, we’re classifying this as a confirmation indicator and is a single level (zero cross) that occupies the space below your price chart window. Far out, man…
Provocative, Yet Uncomplicated
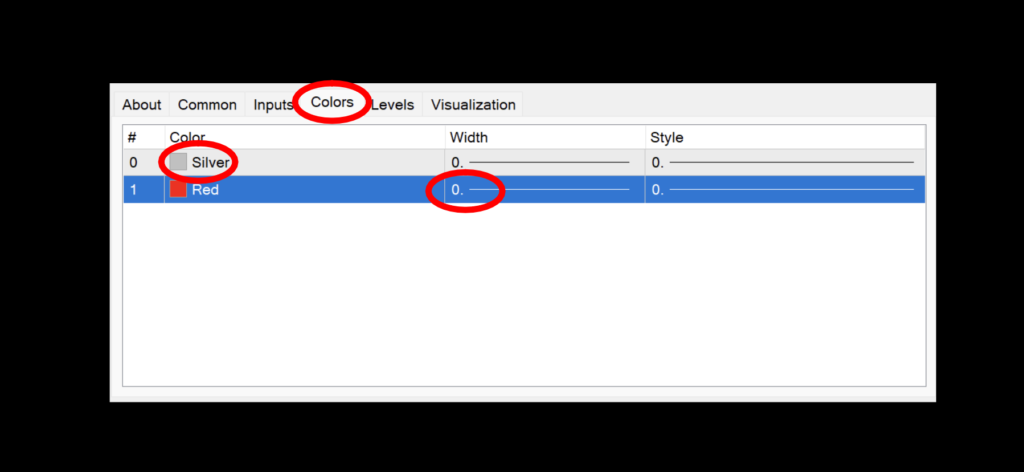
In the screenshot below, we’re displaying the default view, which includes both a histogram in gray and a signal line in red, so you’ll recognize it when loading it onto your MT4 platform. As we sometimes do…we’ll be making a few changes and explain what we did. Of course, price candles are changed to white to remove price bias, so we focus on the indicator.
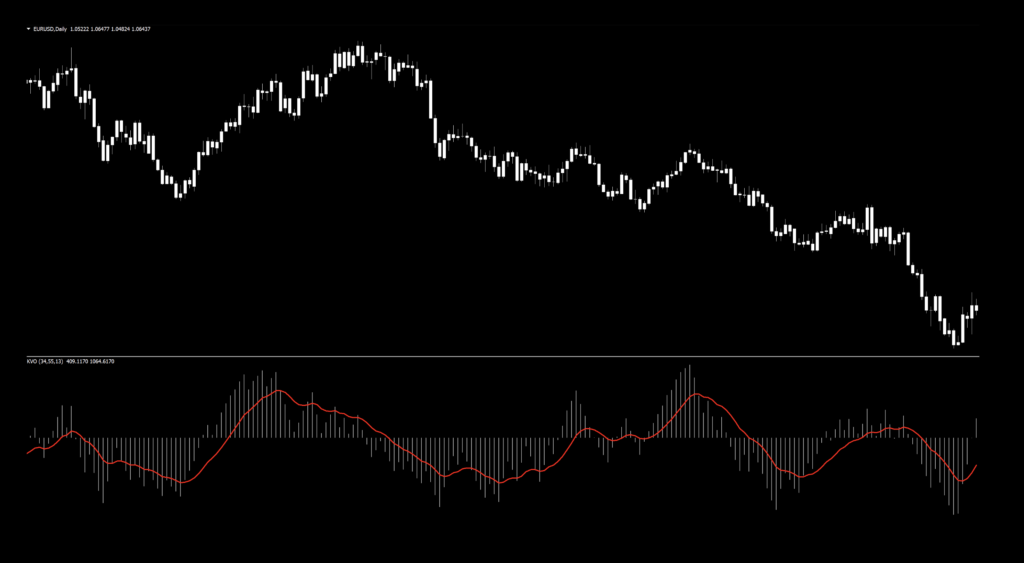
Kind of Fuzzy
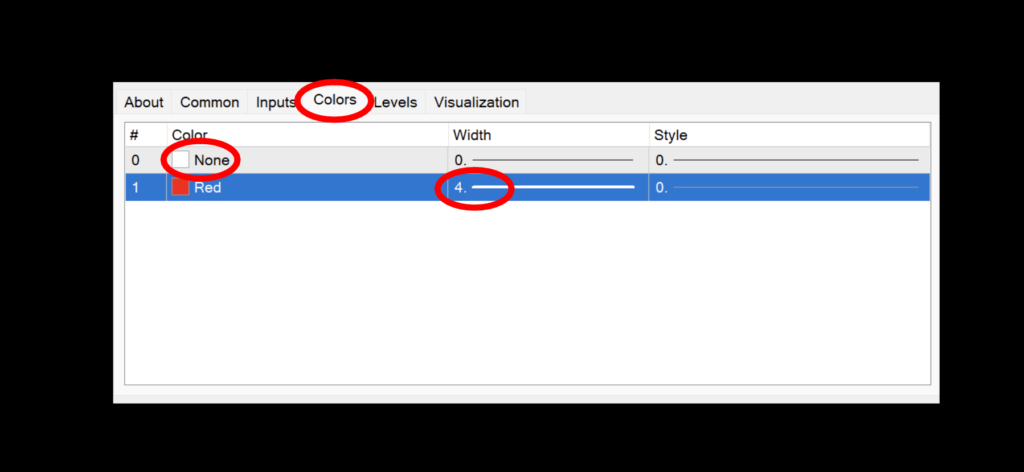
At first glance, this indicator appears a little muddled. We examined data from the histogram and then from the signal line and found that the histogram really wasn’t helpful. That being said, we made three changes. The first was to get rid of the histogram by changing the color from gray to “none” and thickening the signal line to “4”…
From this:
 To this.
And then adding a “zero line” in yellow.
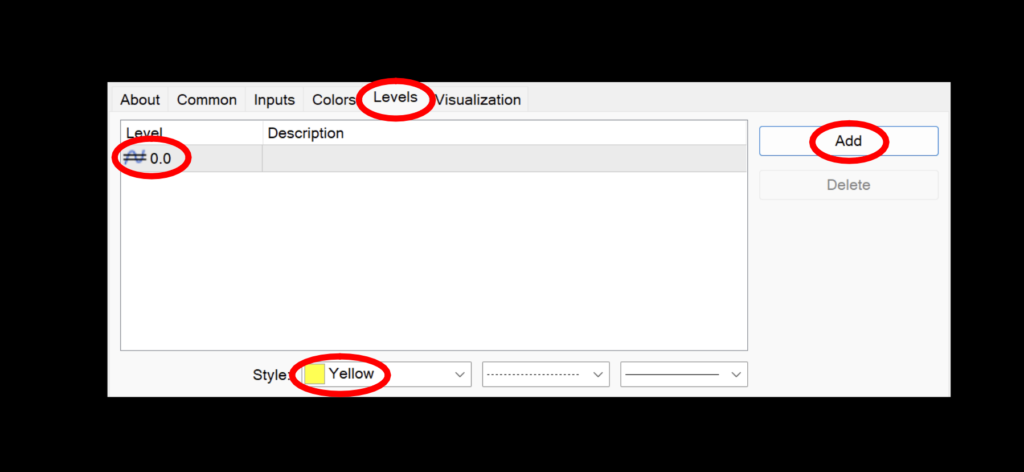
The result looks like this…
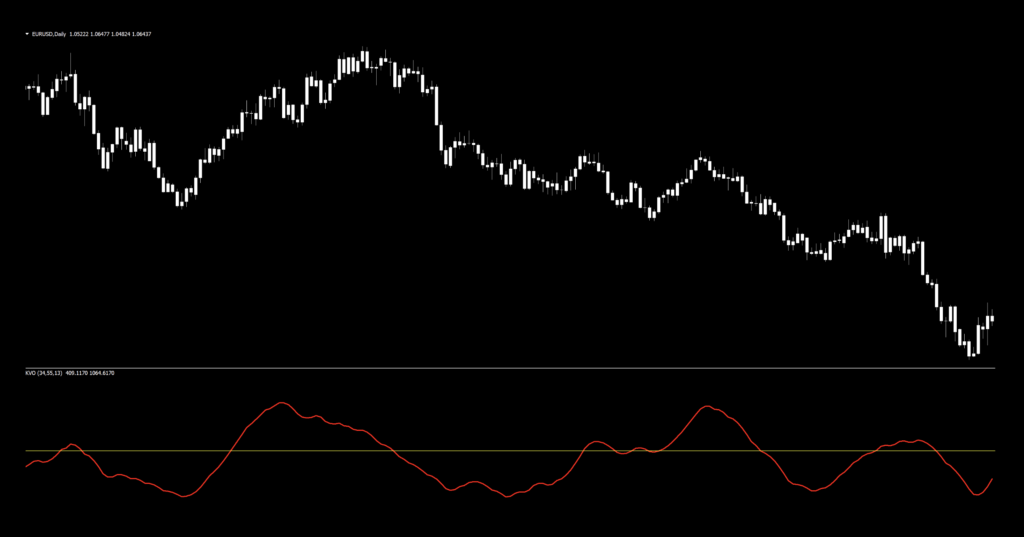
Settings
There are three variables and we use them all in our testing.
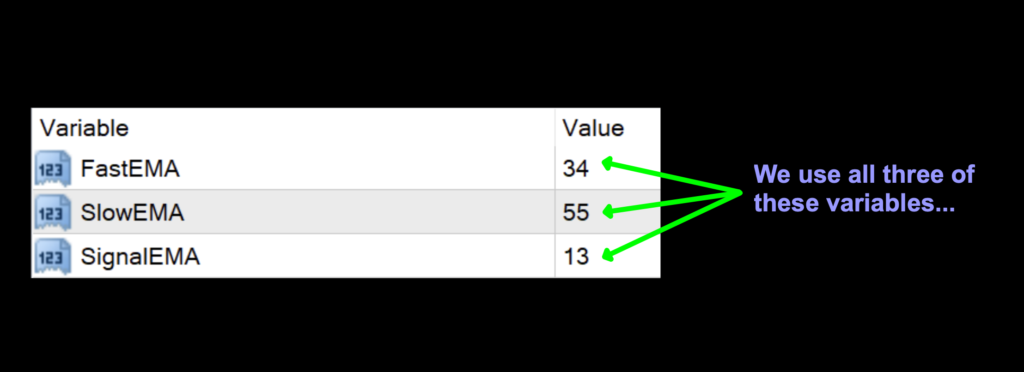
FastEMA: This EMA (Exponential Moving Average) is one of two moving averages used to calculate the Volume Force. The default setting is 34.
Slow EMA: This EMA is the second of two moving averages used to calculate the Volume Force. The default setting is 55.
SignalEMA: This EMA is the signal line which is the Exponential Moving Average line of the KVO, not a stand alone moving average. The default setting is 13.
Mystery and Enigma
For those of you who are familiar with the Fibonacci Sequence (click HERE for more info), you probably noticed that the default values are indeed part of the sequence. You’ll also notice in the testing data, the default metrics are somewhat mediocre at best, so don’t worry about the mystique behind these numbers. Adjust as necessary.
Advantages
* One Level Cross creates easy to identify signals.
* Reliance in proven math to examine long term trend and short term market fluctuations.
* Easy to test
How we use it
Long signal – When the red signal line crosses above the zero line, the entry occurs on the open of the next candle.
Short signal – When the red signal line crosses below the zero line, the entry occurs on the open of the next candle.
Let’s take a look at a marked up chart to see what kind of signals were generated using the default settings.
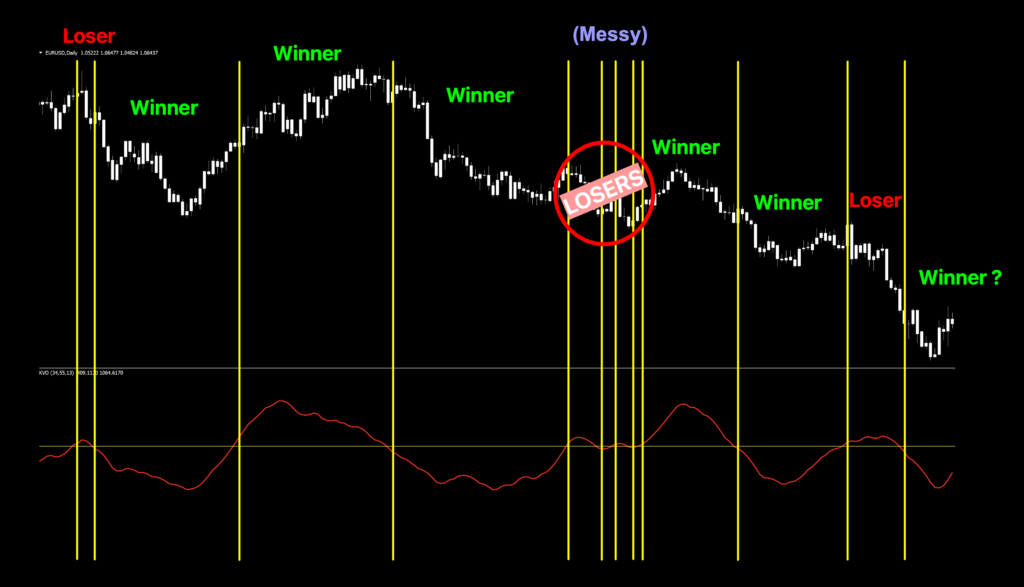
There were winners, and losers…and of course that one really messy area to the right of center. This is where your algorithm would have kept you on the sidelines until the market decided where it wants to go. Remember the bit earlier about not using this as a reversal or divergence indicator? Steer clear of that and let your algorithm do its thing.
Testing…Testing…Testing…
Remember, comprehensive analysis is strongly suggested, and we advocate backwards and forward testing indicators or systems prior to trading actual funds. We propose conducting your tests on the following pairs.
EUR/USD
AUD/NZD
EUR/GBP
AUD/CAD
CHF/JPY
CAD/SGD (new)
We received a couple of emails asking about that last one. Some brokers may not carry the CAS/SGD. If they don’t, it’s not a big deal. With the original five, you’ll still have plenty of usable data. Feel free to try one of the other pairs as noted below.
SGD/GBP
SGD/USD
SGD/JPY
SGD/AUD
SGD/CHF
EUR/SGD
NZD/SGD
If it doesn’t work on these SIX pairs, chances are it won’t work on other pairs. This is not an absolute, but we’ve found this rule is reliable in most cases.
The markets we test our indicators are the:
EUR/USD (Euro/US Dollar)
BTC/USD (Bitcoin/US Dollar)
XAU/USD (Gold/US Dollar)
SPX500 (S&P500 Index)
Timeframes and Results
In our initial test, we’ll run the KVO indicator on the EUR/USD, BTC/USD, XAU/USD, and the SPX500 using the default settings across the daily and 4-hour timeframes on the MT4 strategy tester. We use the fast method of testing the indicator to get a general idea; however, you may also run the tick-by-tick data set for a more precise result (which takes considerably more time).
As No Nonsense Traders – and therefore Swing Traders, we will not examine shorter time frames in these studies. We will also run an additional test, using different values for the settings, to analyze which one may work better and examine the following results:
Total trades
Win/Loss ratio
ROI (return on investment)
There are other metrics included in the strategy tester report, which can be compared, but these three metrics provide the necessary gauge to make quick decisions as to the usefulness of a particular indicator and its settings.
Next, for comparison, we’ll explore the following;
Daily – 1 year
4-hour – 3 months
The reason exceptionally long (or short) testing periods are not included is due to changing market conditions, which might return irrelevant information. A balance of statistically significant data is necessary for accurate results.
And the Outcome…
Below are the spreadsheets illustrating the results from our tests.
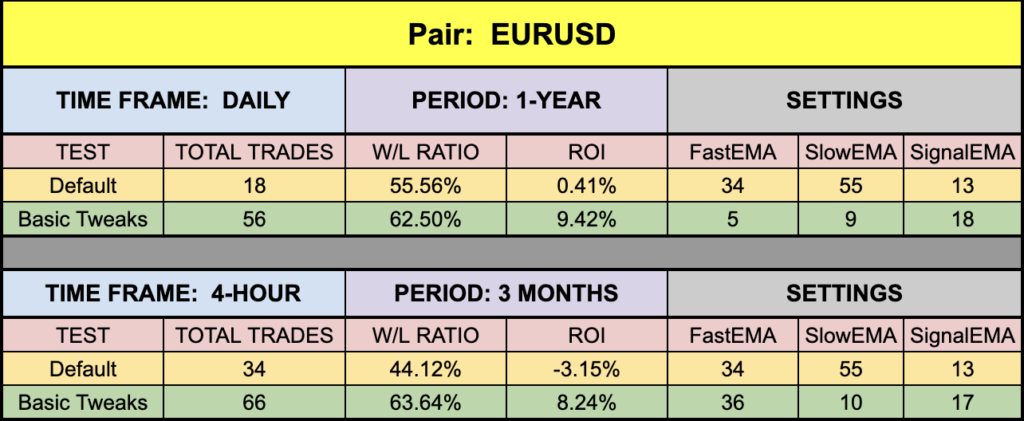
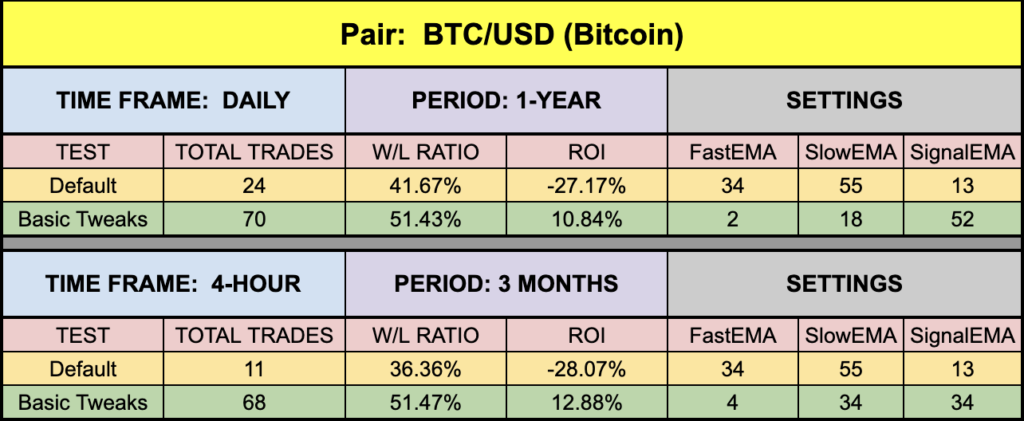
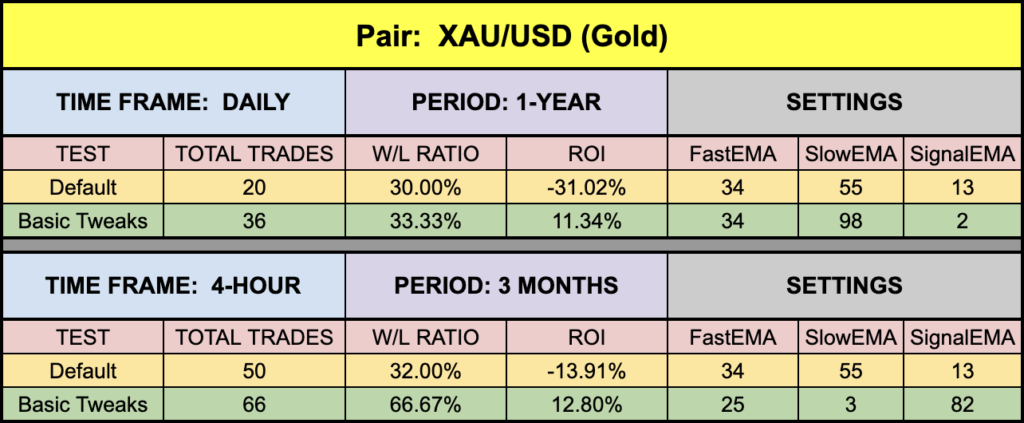
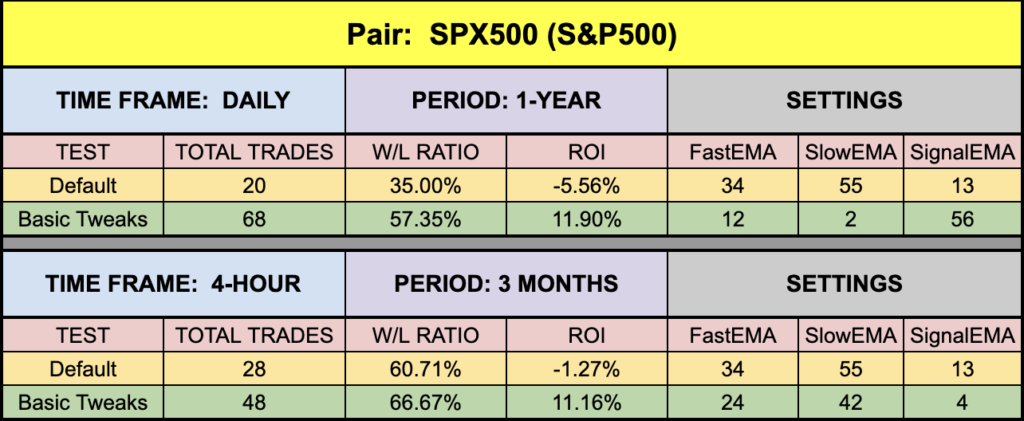
The green highlighted rows represent “basic tweaks” on the settings which returned better results. Are these the best? Not necessarily. Given that variables including testing date range and broker data are different from person to person, you may find better settings.
Trust In Yourself
Remember, the overall NNFX philosophy of taking profit, risk, and drawdown is that YOU are creating a system which YOU will be trading. Don’t let anybody else take that away from you. Part of the learning process is digging in and doing the work yourself. To learn more about these topics, check out the Advanced Course!
That being said, the results we post in these blogs should never be considered specific trading advice.
***Note: Remember, never use just this one indicator as your decision of whether to open or close a trade. It should be part of a system.
Money Management
If you are curious as to what money management is used on our tests; we have a certain way of determining wins and losses, which can be found in the Advanced Course. Our goal here is to determine how well the indicator reacts to price with respect to producing a long or short signal. Your system, with its risk profile, will dictate individual returns.
Resources
As we did with past indicator studies, we’ve made the KVO indicator is available for download on our site from the indicator library. We will keep adding better indicators with each study for your use, at no charge. When you’re ready to get it, click HERE.
More to Come
There’s a lot more to come. We are excited to provide more trading tips in the near future. Sign up on our contacts page or subscribe to our YouTube channel. Receive early notifications as we continue to publish helpful, relevant, and informative Forex related material to support your quest to become a better trader.
And, now you are aware of another indicator that many traders don’t know or use.
Our only goal is to make you a better trader.
BTW – Any information communicated by Stonehill Forex Limited is solely for educational purposes. The information contained within the courses and on the website neither constitutes investment advice nor a general recommendation on investments. It is not intended to be and should not be interpreted as investment advice or a general recommendation on investment. Any person who places trades, orders or makes other types of trades and investments etc. is responsible for their own investment decisions and does so at their own risk. It is recommended that any person taking investment decisions consults with an independent financial advisor. Stonehill Forex Limited training courses and blogs are for educational purposes only, not a financial advisory service, and does not give financial advice or make general recommendations on investment.