First of the Year
Happy New Year! We’re back with a “bang” and looking forward to a very productive year. We have a lot of projects lined out on the website, YouTube, and Facebook. On that note, we decided to start the year with an interesting indicator called the SmoothStep. It’s a little different and something that we’ve not seen before, so we figured it would be a great place to start. Definitely not found on the MetaTrader4 platform, we aim to bring you indicators which are not part of the set included with the platform. Let’s press on and take a look, shall we?
Not a Lot
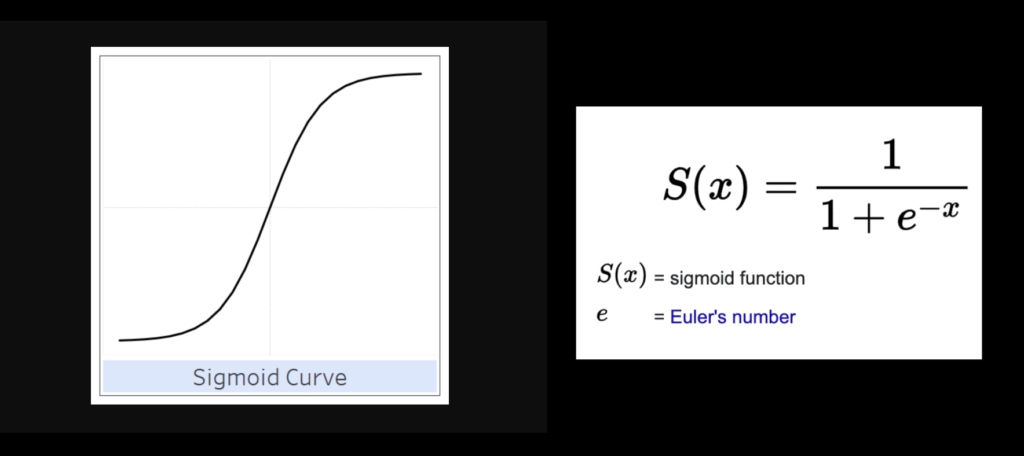
We did not find much information on this indicator, except that it was adopted from work done by a very smart guy named Kenneth H. Perlin, who is a professor at New York University in the Computer Science Department. His work centered around something called “Sigmoid Function” having a characteristic “S”-shaped curve or sigmoid curve which eventually levels off. It looks like this:
We Know a Guy
We were able to get a copy of the indicator and peek at the code using MT4’s MetaEditor. There’s a lot of math going on behind the scenes. It was coded in 2022 by a prolific Coder named Mladen Rakic. Much of his work can be found on the MLQ5 website. Thank you, Mr. Rakic!
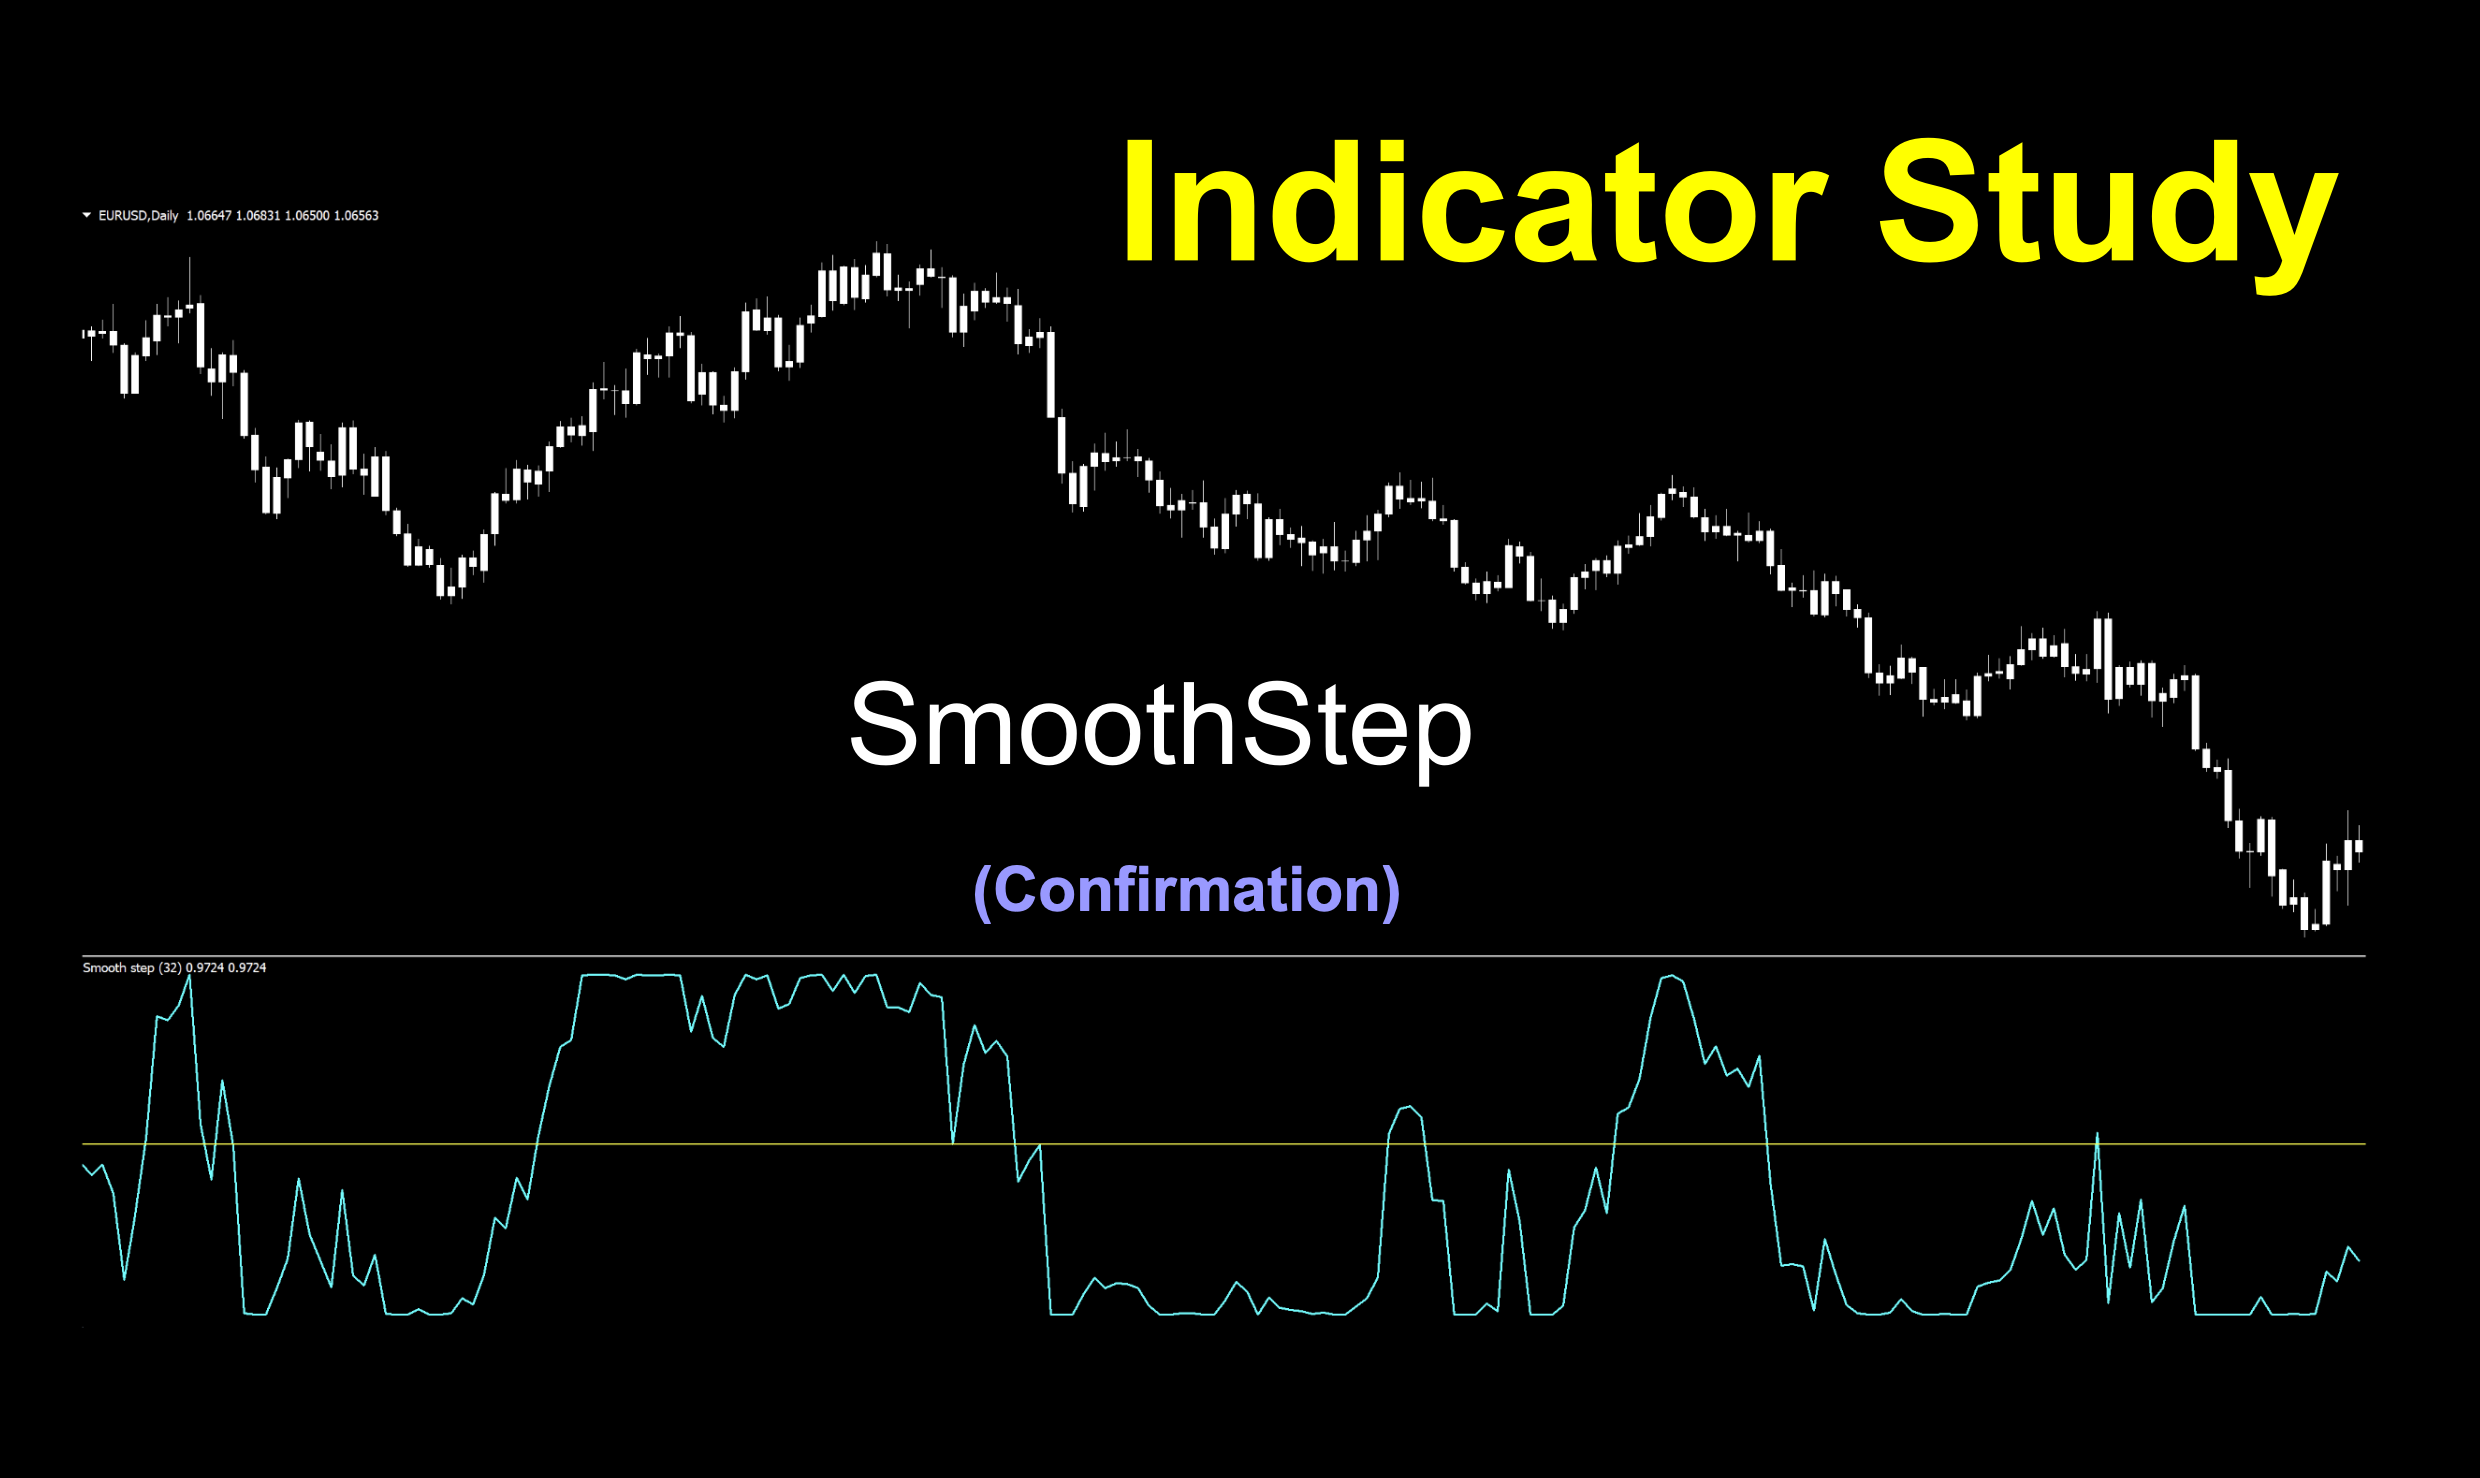
Confirmation Indicator
This is a confirmation indicator, and can be used as either your first or second as a good check point in your algorithm. A single level cross, like a zero-cross that lives below your chart. Good stuff!
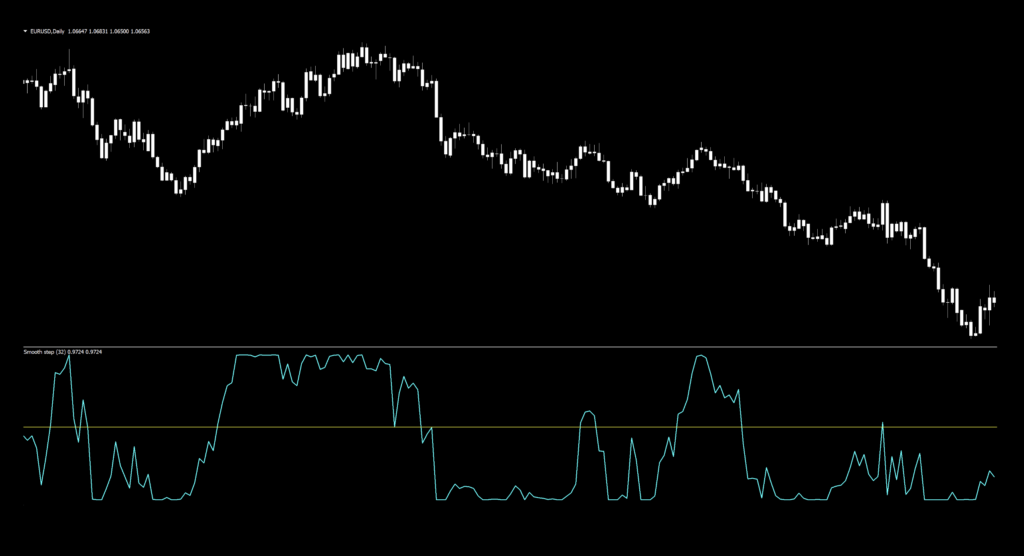
Look’in Sweet
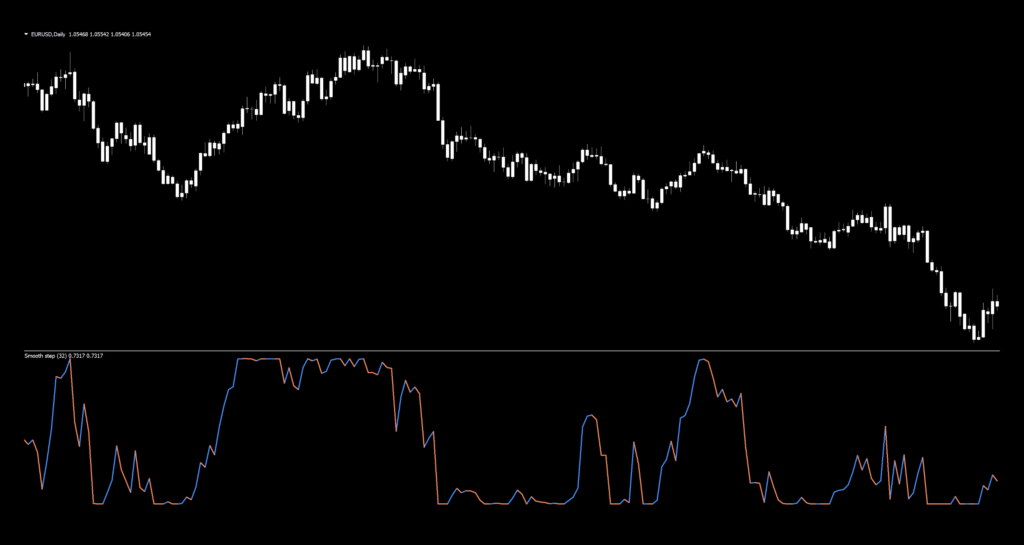
In the screenshot below, we’ve put up the indicator with the default settings (we thickened the lines for better visibility), so you’ll know what it looks like. Then we’re going to make a few minor changes, which we’ll explain. Naturally, we’ll change the price candles to white, removing bias, allowing us to focus strictly on the indicator.
Winds of Change
In our quest to make things easier for you as No Nonsense/Stonehill Forex traders, we’re going to simplify things. The first thing is to change the signal line colors one (brighter) color. We chose “Aqua” as it shines bright, like diamonds in the night…
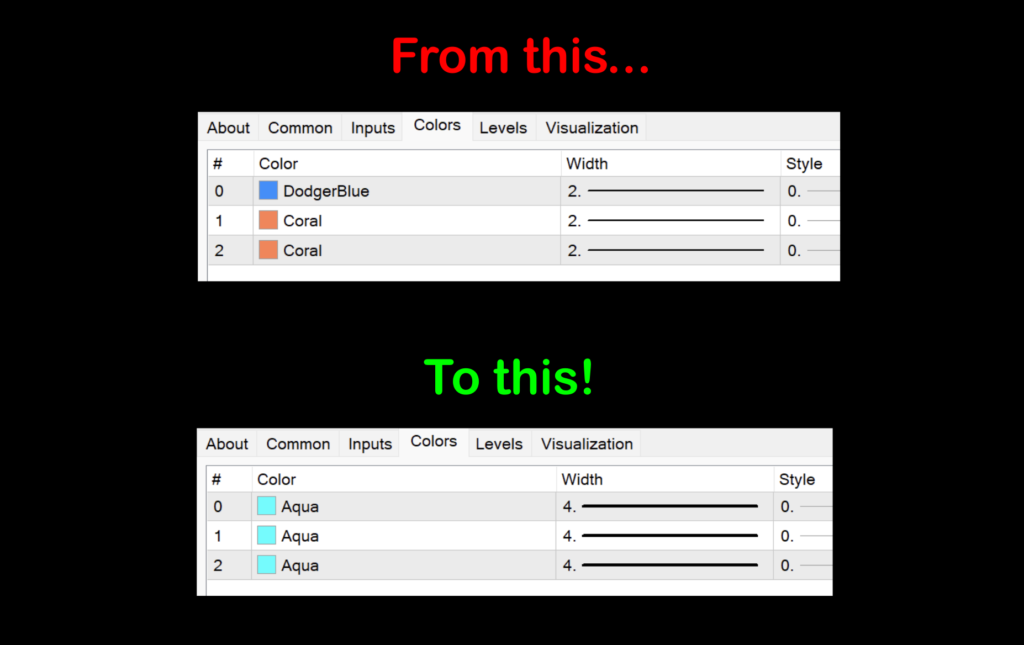
Now, we’ll add a more useful level (0.5) and remove those which we don’t need (0.2 & 0.8)…
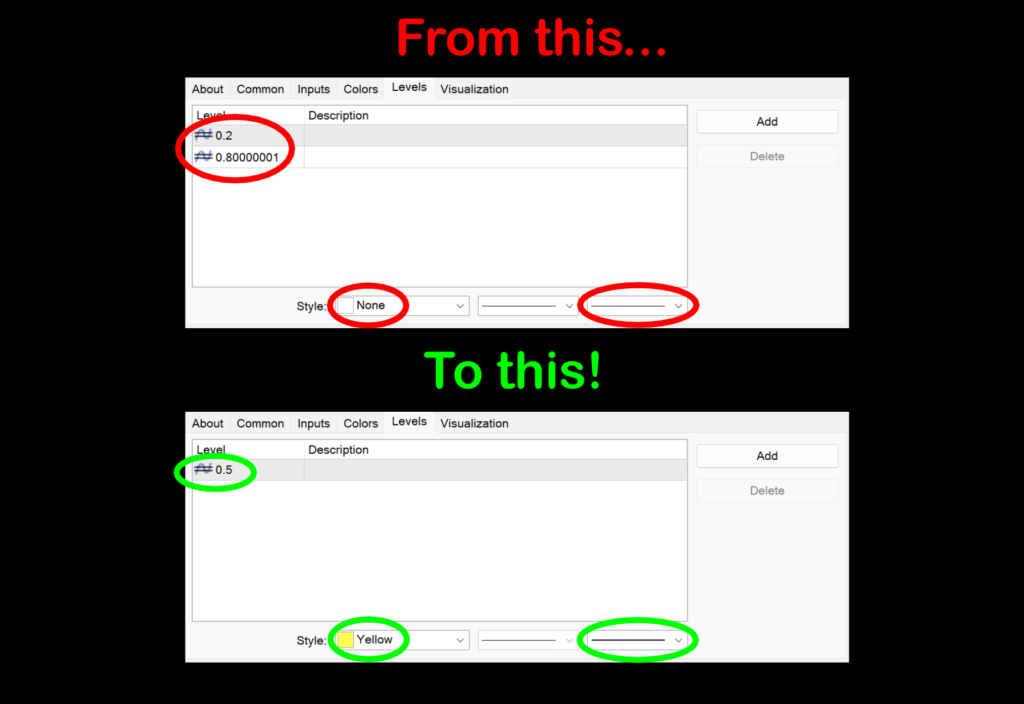
With those two minor changes, your indicator should look like this…
Settings
There are only two settings to concern yourself with. We’ll be addressing both of them for our testing purposes.
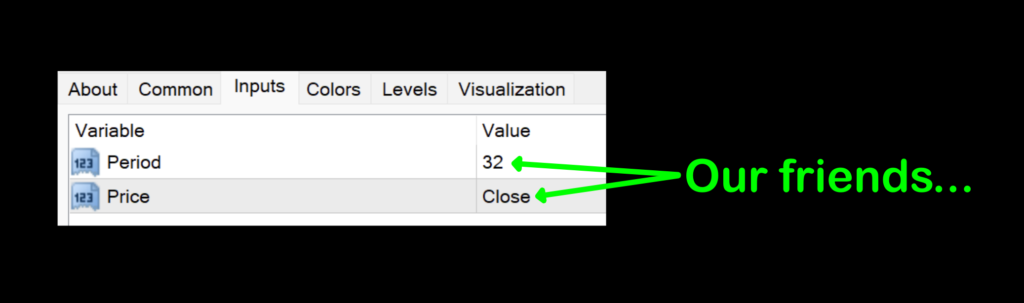
Period: The number of bars is what determines the look back period in the calculations. The lower the number, the more false signals. The default setting is 32.
Price: The “data set” use for calculating the signal line. The values are 0 through 7 (close, open, high, low, median, typical, weighted, and low/high close). The default value is 0 – Close.
Advantages
* One Level Cross creates easy to identify signals.
* Can be used as an exit signal.
* “Different” math makes it a good indicator for comparative purposes.
How we use it
Long signal – When the red signal line crosses above the “mid-line” (in our case 0.5), the entry occurs on the open of the next candle.
Short signal – When the red signal line crosses below the “mid-line” (in our case 0.5), the entry occurs on the open of the next candle.
Let’s take a look at a marked up chart to see what kind of signals were generated using the default settings.
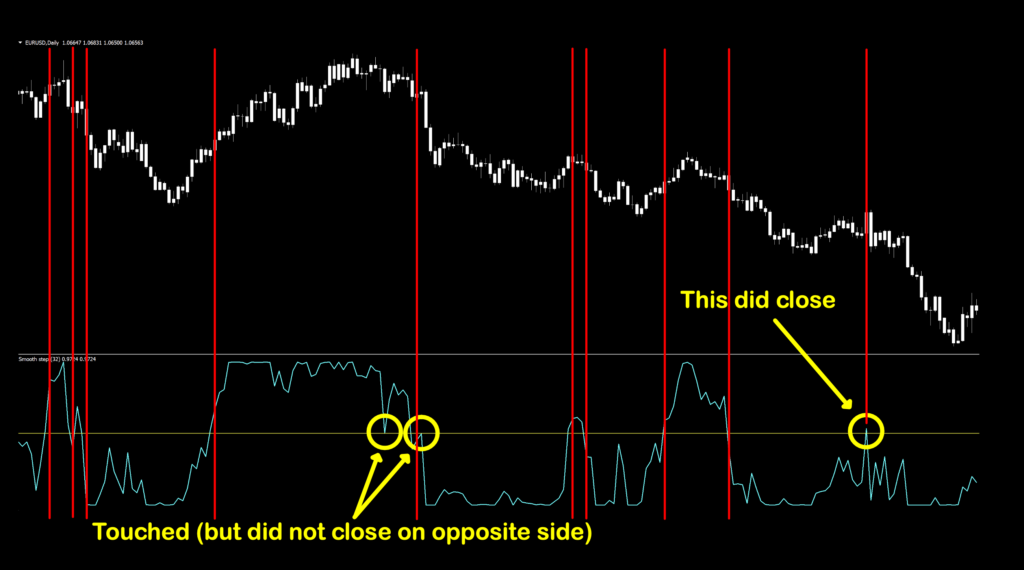
There were a couple of areas of congestion where you may have taken a loss if you were only using SmoothStep as your sole indicator for opening positions. But you don’t do that, do you now? That’s right, your algorithm would have kept you out of them. That’s the point of a tested algorithm.
Testing…Testing…Testing…
Remember, comprehensive analysis is strongly suggested, and we advocate backwards and forward testing indicators or systems prior to trading actual funds. We propose conducting your tests on the following pairs.
EUR/USD
AUD/NZD
EUR/GBP
AUD/CAD
CHF/JPY
*NEWS FLASH*
We had a chat with VP a few days ago about adding a sixth pair to your testing pairs. We’re suggesting the CAD/SGD (Canadian Dollar against the Singapore Dollar) since the Singapore Dollar was added to the daily pairs rotation. Of the SGD pairs, this particular pair was chosen because it put WEST/EAST currencies together for a different price action profile. In addition to the 28 prior pairs, be sure you’re now watching the:
SGD/GBP
SGD/USD
SGD/JPY
SGD/AUD
CAD/SGD
SGD/CHF
EUR/SGD
NZD/SGD
This brings the total pairs from 28 to 36. More opportunities…and who doesn’t like that? So, that being said, let’s continue…
If it doesn’t work on these SIX pairs, chances are it won’t work on other pairs. This is not an absolute, but we’ve found this rule is reliable in most cases.
The markets we test our indicators are the:
EUR/USD (Euro/US Dollar)
BTC/USD (Bitcoin/US Dollar)
XAU/USD (Gold/US Dollar)
SPX500 (S&P500 Index)
Timeframes and Results
In our initial test, we’ll run the SmoothStep indicator on the EUR/USD, BTC/USD, XAU/USD, and the SPX500 using the default settings across the daily and 4-hour timeframes on the MT4 strategy tester. We use the fast method of testing the indicator to get a general idea; however, you may also run the tick-by-tick data set for a more precise result (which takes considerably more time).
As No Nonsense Traders – and therefore Swing Traders, we will not examine shorter time frames in these studies. We will also run an additional test, using different values for the settings, to analyze which one may work better and examine the following results:
Total trades
Win/Loss ratio
ROI (return on investment)
There are other metrics included in the strategy tester report, which can be compared, but these three metrics provide the necessary gauge to make quick decisions as to the usefulness of a particular indicator and its settings.
Next, for comparison, we’ll explore the following;
Daily – 1 year
4-hour – 3 months
The reason exceptionally long (or short) testing periods are not included is due to changing market conditions, which might return irrelevant information. A balance of statistically significant data is necessary for accurate results.
And the Outcome…
Below are the spreadsheets illustrating the results from our tests.
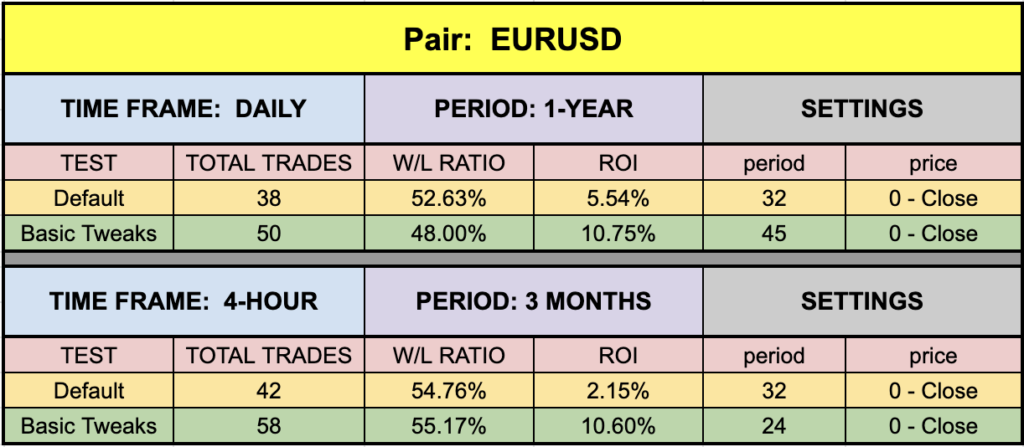
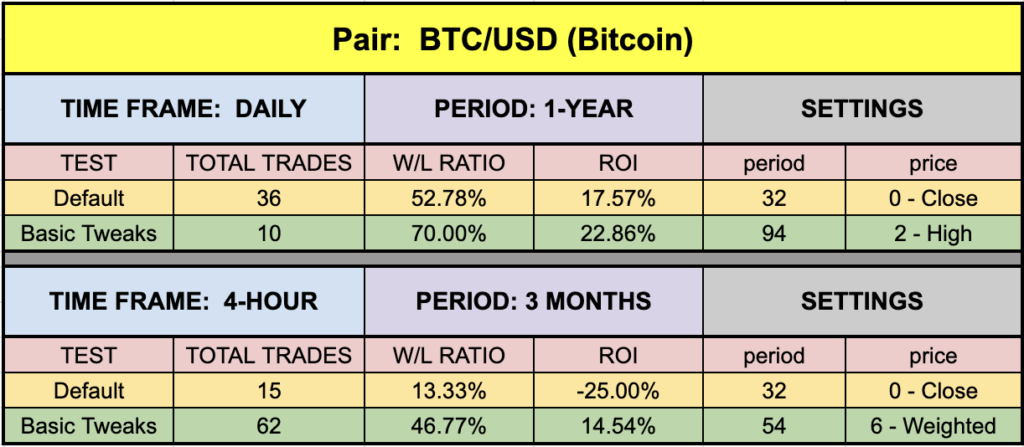
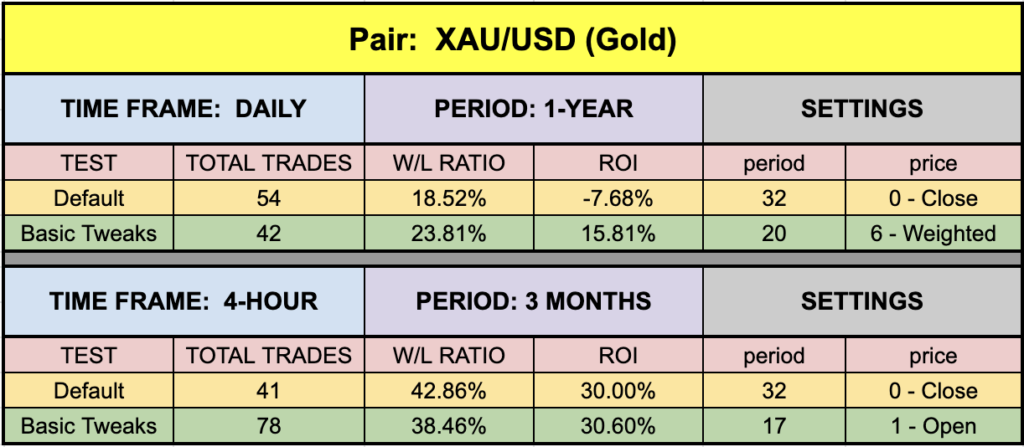
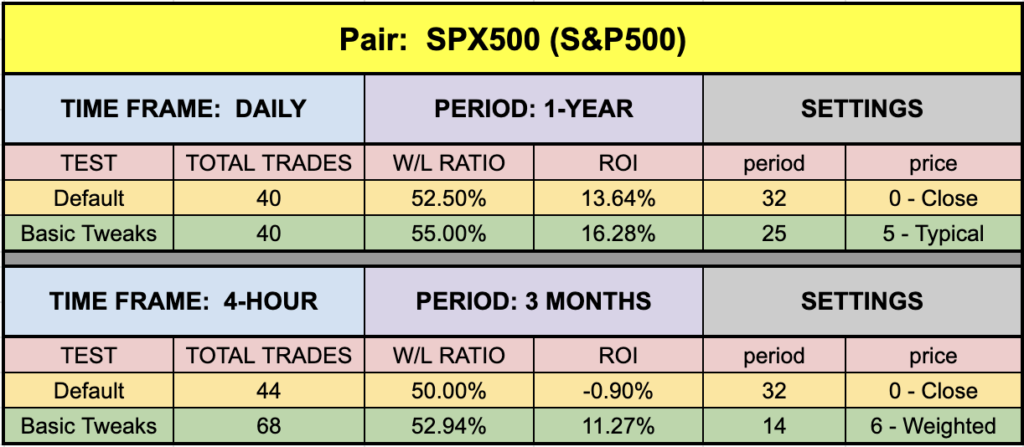
The green highlighted rows represent “basic tweaks” on the settings which returned better results. Are these the best? Not necessarily. Given that variables including testing date range and broker data are different from person to person, you may find better settings.
Good as Gold
Notice that on the 4-hour gold, the default value is very respectable. Also notice that the “tweak” is not much higher. This is one of those instances where the default values (for the period tested) are about as good as it gets. It does happen on occasion, and it’s something to celebrate.
Trust In Yourself
Remember, the overall NNFX philosophy of taking profit, risk, and drawdown is that YOU are creating a system which YOU will be trading. Don’t let anybody else take that away from you. Part of the learning process is digging in and doing the work yourself. To learn more about these topics, check out the Advanced Course!
That being said, the results we post in these blogs should never be considered specific trading advice.
***Note: Remember, never use just this one indicator as your decision of whether to open or close a trade. It should be part of a system.
Money Management
If you are curious as to what money management is used on our tests; we have a certain way of determining wins and losses, which can be found in the Advanced Course. Our goal here is to determine how well the indicator reacts to price with respect to producing a long or short signal. Your system, with its risk profile, will dictate individual returns.
Resources
As we did with past indicator studies, we’ve made the SmoothStep indicator is available for download on our site from the indicator library. We will keep adding better indicators with each study for your use, at no charge. When you’re ready to get it, click HERE.
Bonus Blog
Since we brought up the whole testing currency pairs thing above, which happen to coincide with an email dialogue with one of our subscribers, we decided to create a “Why” blog on testing pairs. It’ll go out in the next week or so and will be titled, “Testing Pairs – Why So Few?” Thanks to Tom B. from the UK who engaged us regarding this rather important testing point.
More to Come
There’s a lot more to come. We are excited to provide more trading tips in the near future. Sign up on our contacts page or subscribe to our YouTube channel. Receive early notifications as we continue to publish helpful, relevant, and informative Forex related material to support your quest to become a better trader.
And, now you are aware of another indicator that many traders don’t know or use.
Our only goal is to make you a better trader.
BTW – Any information communicated by Stonehill Forex Limited is solely for educational purposes. The information contained within the courses and on the website neither constitutes investment advice nor a general recommendation on investments. It is not intended to be and should not be interpreted as investment advice or a general recommendation on investment. Any person who places trades, orders or makes other types of trades and investments etc. is responsible for their own investment decisions and does so at their own risk. It is recommended that any person taking investment decisions consults with an independent financial advisor. Stonehill Forex Limited training courses and blogs are for educational purposes only, not a financial advisory service, and does not give financial advice or make general recommendations on investment.