Got Something Kind of Cool
We’ve decided to pop out a bonus blog with an interesting indicator, featuring a mysterious title; 3rd Generation Moving Average…sounds pretty high-tech, doesn’t it? Definitely not found on the MetaTrader4 platform, we aim to bring you indicators which are not part of the set included with the platform. Let’s press on and take a look, shall we?
What? Another Moving Average?
Hey! No eye rolling. I saw you over there in St. Louis. The aim, like other trending indicators, is to remove lag normally found in conventional moving averages. What other way to remove lag than with math and a little savvy, right?
Who’s The Dude?
The indicator we found has a creation date of 2011. Coincidently, the credit goes to a really smart guy named Dr. Mafred Durschner who first described the process in an article written, also in 2011 in called, “Gleitende Durchschnitte 3.0”…which naturally is in German.
Math for Mathletes
Dr. Durschner was able to reduce something called “temporal lag” which all moving averages are burdened with by employing a filter called “lambda” or the Greek letter for “L”. It looks like this:
“λ” (it’s the lower case of “Λ”)
and assigned it a value of “2” which returned the best possible reduction of “temporal lag”. Does this mean all lag has been removed? No, it still has some delay, so you’ll still need to watch for false signals. Besides, you never use just one indicator to open a position, right?
Confirmation Indicator
This is a confirmation indicator, and can be used as either your first or second as a good check point in your algorithm. A two line cross over that lives on top of the price chart, this one gives clear signals.
Look’in Good
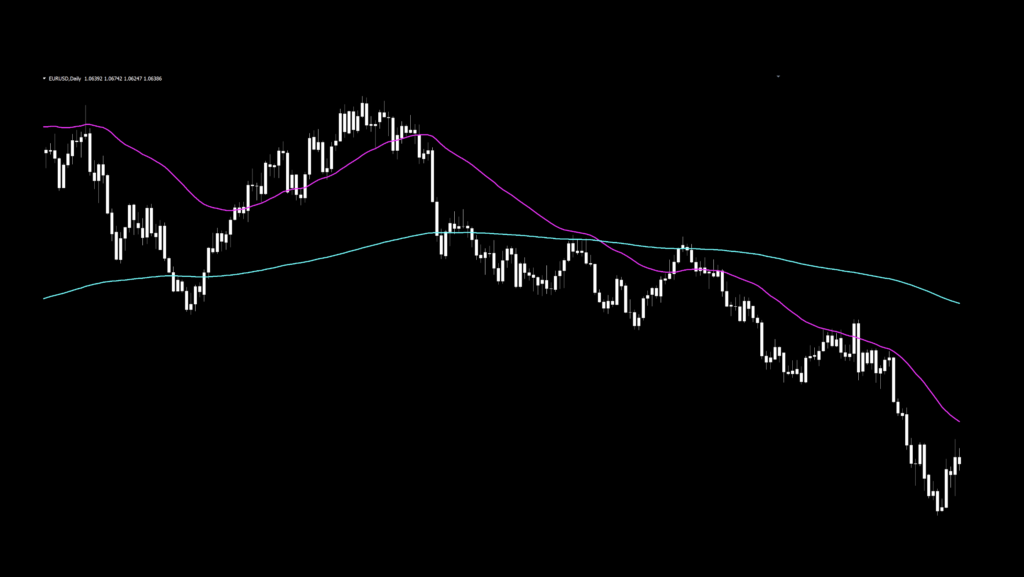
In the screenshot below, we’ve changed the lines from blue/red to aqua/aqua to brighten them up and thickened the lines to make them easier to see. Additionally, we changed the candle colors to white, which of course removes bias, allowing us to focus strictly on the indicator.
Settings
This indicator has four variables in the settings window, and we used all of them for testing purposes. Below is the settings screen.
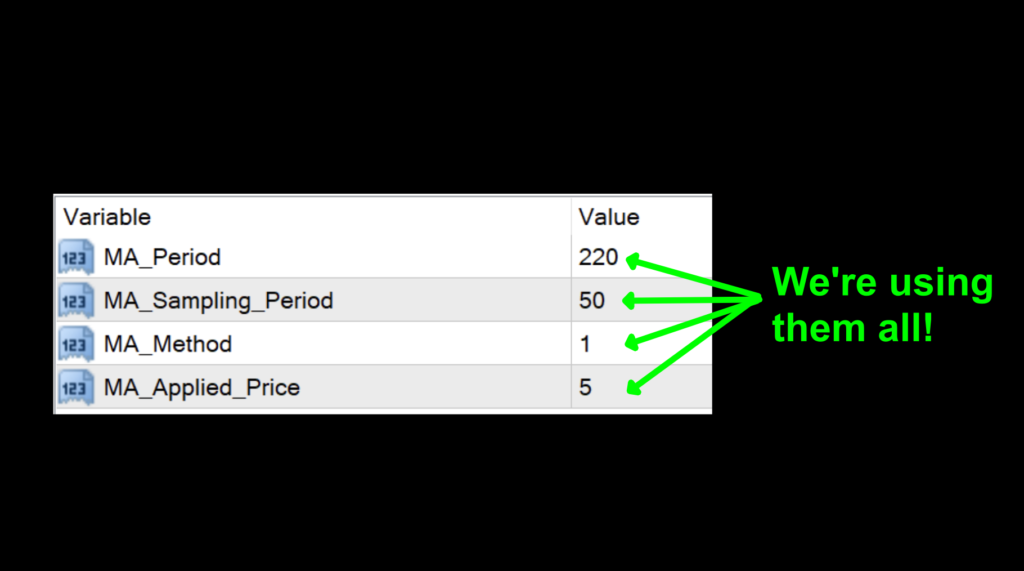
MA_Period: The number of bars (period) the indicator looks back to generate the 3rd generation moving average. The default value is 50.
MA_Sampling_Period: The number of bars (period) the indicator looks back to generate the comparative (conventional) moving average line. The default value is 220.
MA_Method: This setting dictates the type of moving average in the Sampling Period: 0 = SMA (Simple Moving Average), 1 = EMA (Exponential Moving Average), 2 = SMMA (Smoothed Moving Average), 3 = LWMA (Linearly Weighted Moving Average). The default setting is 1 (EMA).
MA_Applied_Price: The price data set used to calculate the Sampling Period moving average: 0 = close, 1 = open, 2 = high, 3 = low, 4 = median, 5 = typical, 6 = weighted. The default value is 5 (typical).
Advantages
* Two line cross signals are easy to see
* Very adjustable.
* Possible use as an exit indicator, depending on settings and the rest of your algorithm…but I’d look elsewhere.
How we use it
Long signal – When the blue line crosses and closes above the red line, your entry is made on the open of the next period.
Short signal – When the red line crosses and closes above the blue line, your entry is made on the open of the next period.
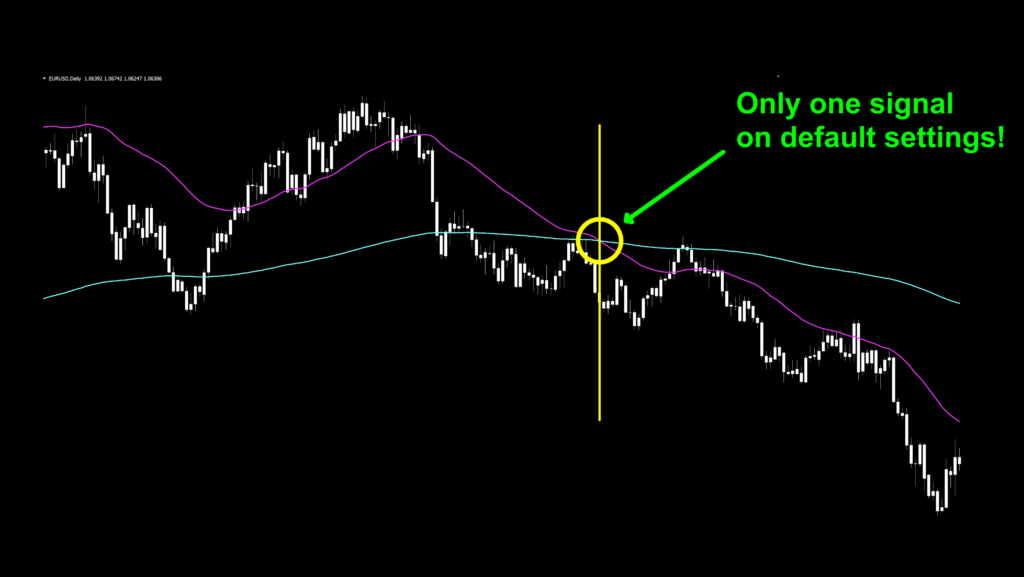
Let’s take a look at a marked up default chart to see where the entries would be.
Hello? Anybody there?
The default settings are a little…how should I put this…lacking? We used MT4’s MetaEditor to peek at the code and sure enough, the default settings we discussed earlier are indeed what they are. In fact, we conducted a little research and found that one of the “rules” for signal line comparison was to keep the sampling period less than ¼ of the MA_Period; i.e., 220/50 as noted in the default settings.
Get Your Rebel On
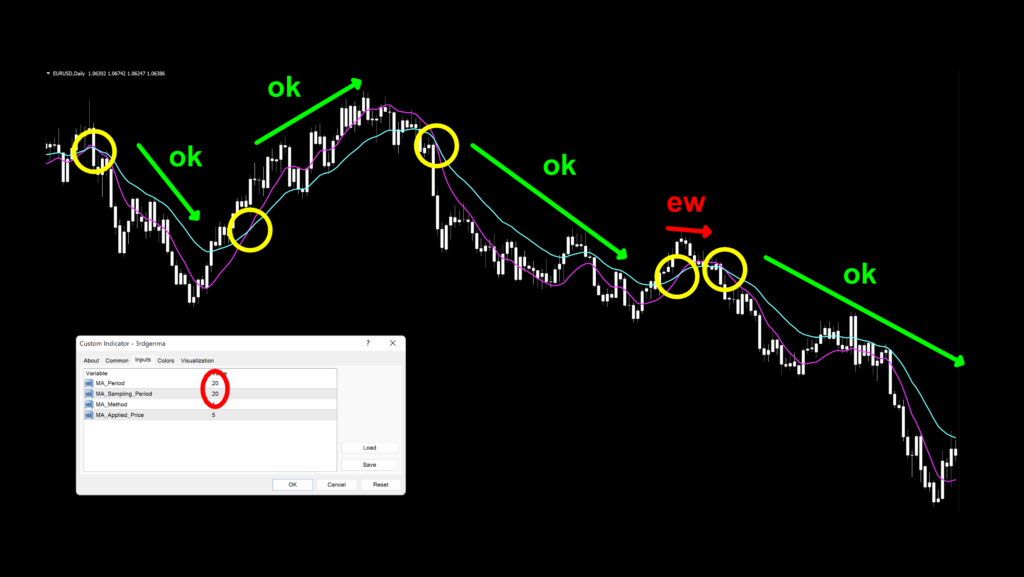
As Dee Snider once said…”We’re not gonna take it…”, and neither will we. Settings are there to be tweaked. That being said, we’re going to plug in a couple of random numbers. You…in St. Louis! I heard you say 20 and 20 for the sampling period and MA_Period. Radical…let’s do it and see what that chart looks like.
Not Too Shabby
Not too bad, right? Tweaking those two settings took about 12 seconds. Not everything has to be a big production. Of course, we’re going to a lot more in our testing, but we’re just trying to make a point. Thanks for the assist, St. Louis guy.
Should I Stay or Should I Go?
Just by eyeballing the chart, we can see that this indicator has the possibility as an exit indicator. Of course, how you tweak the settings and its relationship with other indicators in your algorithm will ultimately tell you if it’s a poor, mediocre, or fantastic decision. You’re the boss, so no permission required. You, do you.
Testing…Testing…Testing…
Remember, comprehensive analysis is strongly suggested, and we advocate backwards and forward testing indicators or systems prior to trading actual funds. We propose conducting your tests on the following pairs.
EUR/USD
AUD/NZD
EUR/GBP
AUD/CAD
CHF/JPY
CAD/SGD (new)
If it doesn’t work on these SIX pairs, chances are it won’t work on other pairs. This is not an absolute, but we’ve found this rule is reliable in most cases.
The markets we test our indicators are the:
EUR/USD (Euro/US Dollar)
BTC/USD (Bitcoin/US Dollar)
XAU/USD (Gold/US Dollar)
SPX500 (S&P500 Index)
Timeframes and Results
In our initial test, we’ll run the 3rd Generation MA indicator on the EUR/USD, BTC/USD, XAU/USD, and the SPX500 using the default settings across the daily and 4-hour timeframes on the MT4 strategy tester. We use the fast method of testing the indicator to get a general idea; however, you may also run the tick-by-tick data set for a more precise result (which takes considerably more time).
As No Nonsense Traders – and therefore Swing Traders, we will not examine shorter time frames in these studies. We will also run an additional test, using different values for the settings, to analyze which one may work better and examine the following results:
Total trades
Win/Loss ratio
ROI (return on investment)
There are other metrics included in the strategy tester report, which can be compared, but these three metrics provide the necessary gauge to make quick decisions as to the usefulness of a particular indicator and its settings.
Next, for comparison, we’ll explore the following;
Daily – 1 year
4-hour – 3 months
The reason exceptionally long (or short) testing periods are not included is due to changing market conditions, which might return irrelevant information. A balance of statistically significant data is necessary for accurate results.
And the Outcome…
Below are the spreadsheets illustrating the results from our tests.
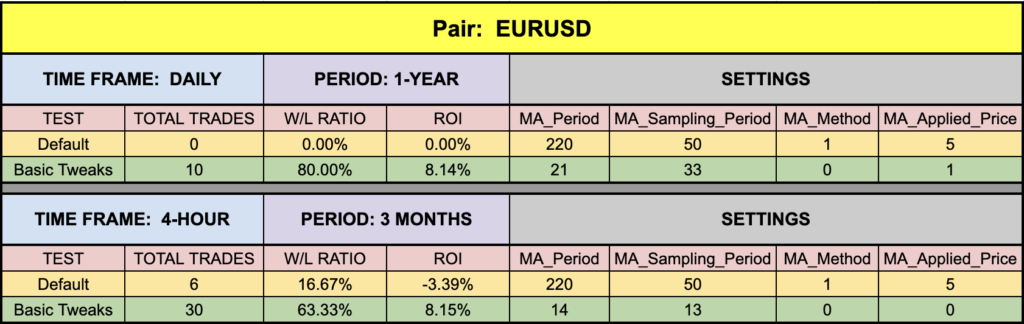
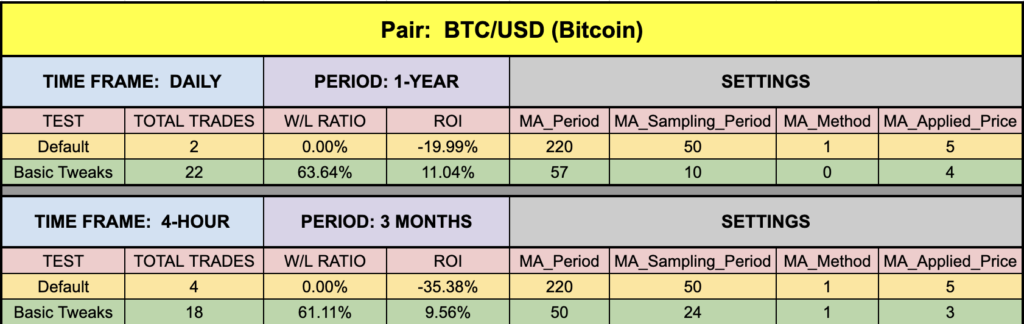
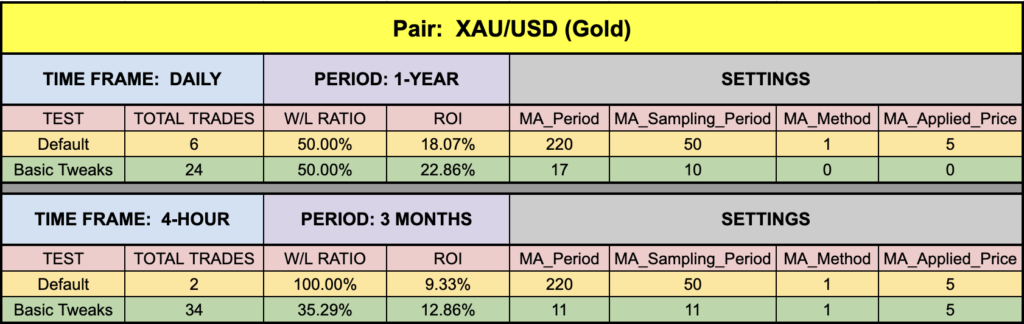
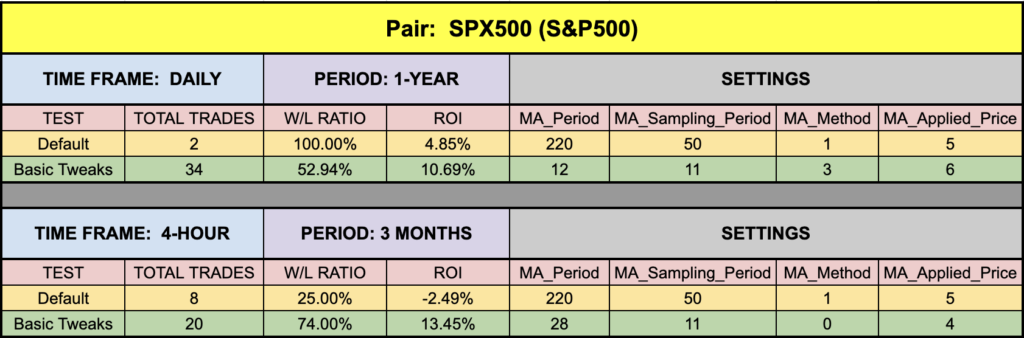
The green highlighted rows represent “basic tweaks” on the settings which returned better results. Are these the best? Not necessarily. Given that variables including testing date range and broker data are different from person to person, you may find better settings.
Trust In Yourself
Remember, the overall NNFX philosophy of taking profit, risk, and drawdown is that YOU are creating a system which YOU will be trading. Don’t let anybody else take that away from you. Part of the learning process is digging in and doing the work yourself. To learn more about these topics, check out the Advanced Course!
That being said, the results we post in these blogs should never be considered specific trading advice.
***Note: Remember, never use just this one indicator as your decision of whether to open or close a trade. It should be part of a system.
Money Management
If you are curious as to what money management is used on our tests; we have a certain way of determining wins and losses, which can be found in the Advanced Course. Our goal here is to determine how well the indicator reacts to price with respect to producing a long or short signal. Your system, with its risk profile, will dictate individual returns.
Resources
As we did with past indicator studies, we’ve made the 3rd Generation MA indicator is available for download on our site from the indicator library. We will keep adding better indicators with each study for your use, at no charge. When you’re ready to get it, click HERE.
More to Come
There’s a lot more to come. We are excited to provide more trading tips in the near future. Sign up on our contacts page or subscribe to our YouTube channel. Receive early notifications as we continue to publish helpful, relevant, and informative Forex related material to support your quest to become a better trader.
And, now you are aware of another indicator that many traders don’t know or use.
Our only goal is to make you a better trader.
BTW – Any information communicated by Stonehill Forex Limited is solely for educational purposes. The information contained within the courses and on the website neither constitutes investment advice nor a general recommendation on investments. It is not intended to be and should not be interpreted as investment advice or a general recommendation on investment. Any person who places trades, orders or makes other types of trades and investments etc. is responsible for their own investment decisions and does so at their own risk. It is recommended that any person taking investment decisions consults with an independent financial advisor. Stonehill Forex Limited training courses and blogs are for educational purposes only, not a financial advisory service, and does not give financial advice or make general recommendations on investment.