
Time After Time
As a trader, back testing is a vital part of what we do. Without it, you will never really know if a particular indicator performs well or not. The big question is, “How long of a back testing period should I use?” That’s a great question, by the way.
Over the many years we’ve been involved with the market, testing length suggestions have ranged from “all available data” to just the last few days. We’re going to take a quick peek into what we feel should help you decide what’s best for you.
What Are You?
First and foremost, you’ll need to identify what kind of trader you are. Here at Stonehill Forex, we’re decidedly swing traders – meaning we hold trades from a few days to a few weeks; the NNFX way. If you’re a position trader (months to years), day trader (minutes to hours) or a scalper (seconds to minutes), you may not agree with our suggestions. That’s okay. What we’re attempting to illustrate is a general ratio to use, which can be applied to whatever time frame you used to trade.
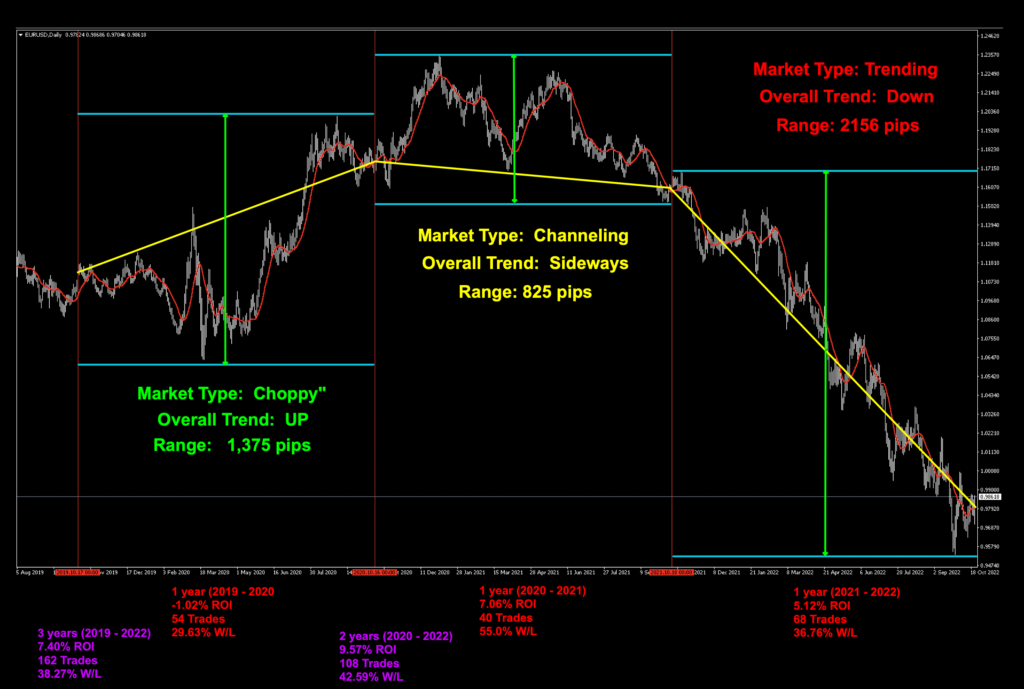
The best place to start is with data. What we did is take the EUR/USD daily chart and squeeze it down, so we could see three years worth of data. We then divided it up into six month segments, single years, and cumulative years, as noted below:
2019 – 2020: 1 year
2020 – 2021: 1 year
2021 – 2022: 1 year
2021 – 2022: 6 months (Oct. 2021 – April 2022)
2022 – 2022: 6 months (April 2022 – October 2022)
2021 – 2022: 1 year
2020 – 2022: 2 years
2019 – 2022: 3 years
Withstanding the Test of Time
We ran tests on the MT4 strategy tester using the most basic indicator we could find, the SMA (Simple Moving Average) on its default value of 14 to garner our data for comparison.
We also noted the type of market over each single year to illustrate that market types are not always the same; i.e., trending, channeling, dead, volatile, etc. This will have a profound effect on how well (or not) indicators will return profitable signals.
Dah-ta…Day-ta…
The first things you should notice is that each year had a decidedly different type of market. Indicators will react dissimilar, providing traders with varying degrees of profit and losses.
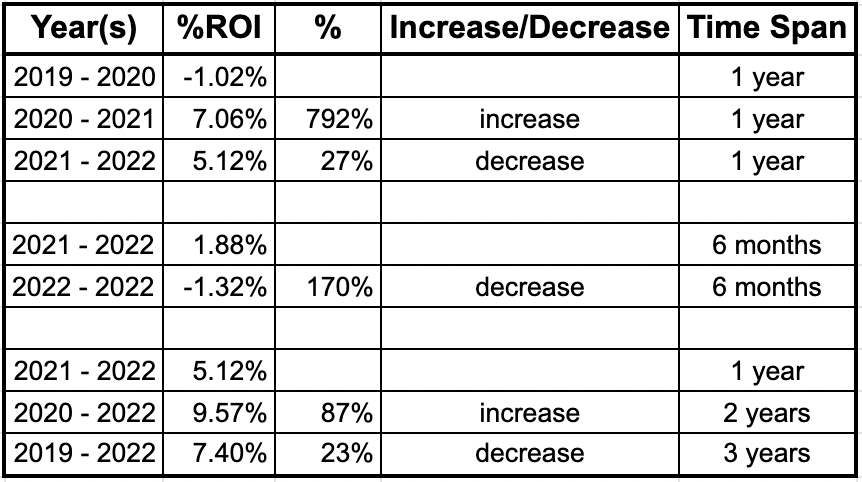
The data is a little difficult to see on the image, so we created a table to make it visually more readable.
What’s it All Mean?
What it means is that changes to your indicators needs to be fluid and reflect current market conditions. That beings said, this is why we test indicators on daily charts for a period of 1 year and 3 months on the 4-hour chart. However, there are intervals when the market state persists for an extended period of time. Longer look back times would provide better “average” data, than markets of recent times.
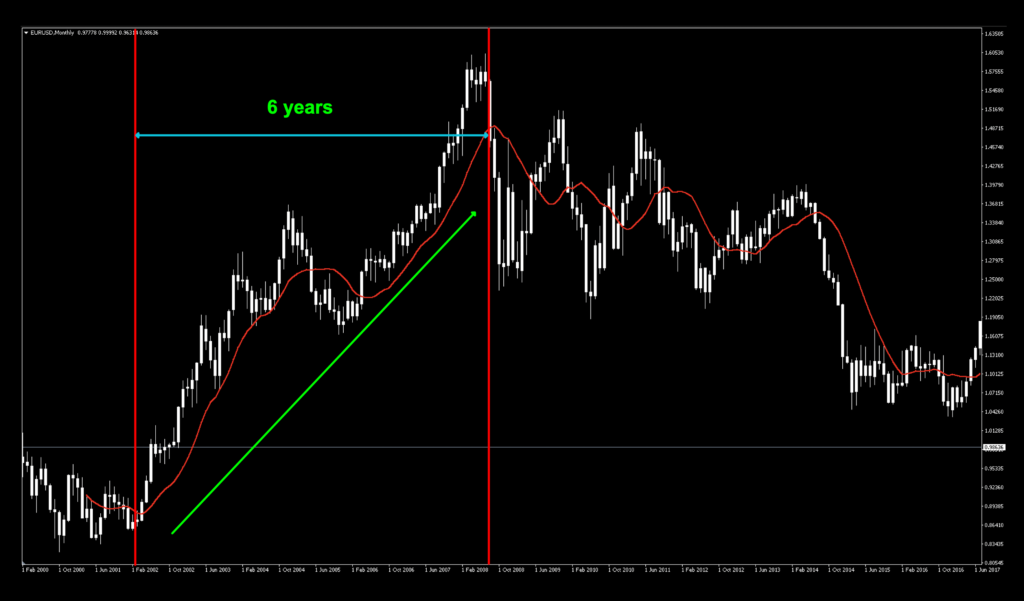
Long View
Below is the weekly chart for the EUR/USD. Notice that from 2002 to 2008 (left half of the chart) spent most of its time in a persistent uptrend.
I’m Not You
Okay, we get it. You’re a day trader or a scalper, so a year’s worth of data won’t really help you decide what indicators to use or what settings would be best. No problem. A year’s data probably won’t be helpful. Scan the most recent market. Perhaps a week would give you a better idea of what is happening. Remember, we’re taking a few liberties to explain a process. At the end of the day, you need to decide what works best for you.
Look at this chart. It’s the 15-minute over a period of about 4 days.
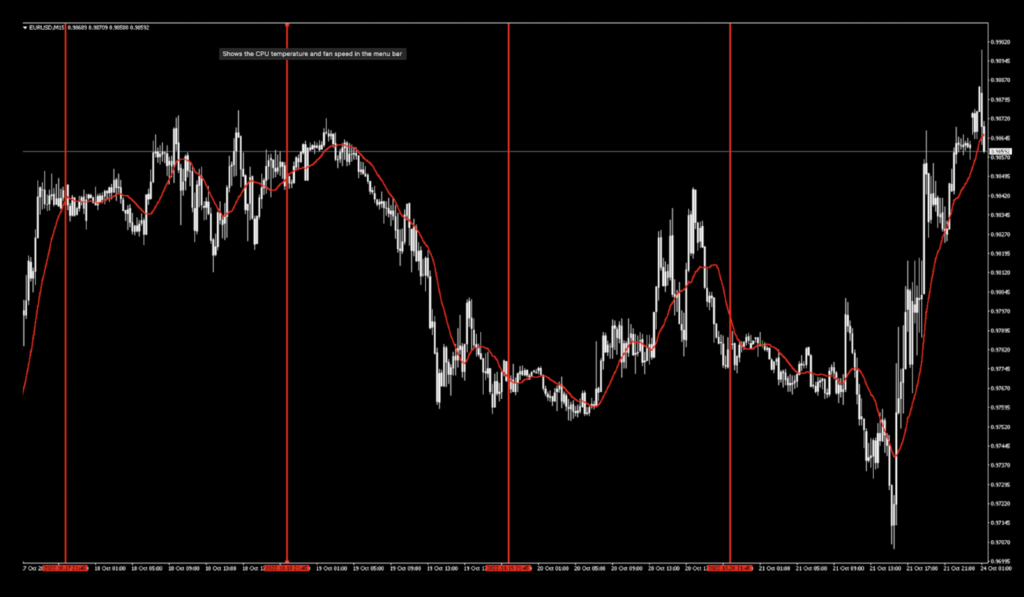
You can see that the market behaves quite differently from day to day.
Four days ago – choppy/sideways/channeling
Three days ago – trending
Two days ago – choppy/volatile
Current – trending
Do you think a year’s worth of data would help you decide what the best settings should be based on a 15-minute chart? Probably not.
You’re Trying Too Hard
So…does that mean you should use really short term back testing times? Not at all. On the opposite side of the same coin, there is a term called, “curve fitting”…sometimes called “over optimization”. By definition, “it is the process of constructing a curve, or mathematical function, that has the best fit to a series of data points”. Thanks, Wikipedia.
What it Means
What this means is that if you try and over adjust your indicators, any change in the market will render those settings as kind of useless. It’s a balancing act for sure. Experience and experimental research rule the day.
Good For The Goose
Does this mean that every indicator will return similar results? This would be a hard “no”. Different indicators perform different functions, especially when placed in your algorithm. The math from one to another can be simple, complex, or quantum impossible to understand, which is why back testing is so supremely important.
What We Do
When we run our back testing in the blogs, we use the same parameters each time, as mentioned earlier. Daily – one year and 4-hour, 3 months. Out of curiosity, we’ve back tested different lengths and changed dates. Each time we get different data with different settings. This is not an exact science. The longer you trade, the more of an artist you become, determining what works best for your individual situation.
More Coming Your Way
There’s a lot more to come. If you haven’t signed up on our contacts page or subscribed to the YouTube channel, please consider doing so to receive notifications as we continue to publish helpful, relevant, and informative Forex related material to support your quest to becoming a better trader.
Don’t Miss Anything
Don’t forget to sign up on our contacts page and subscribe to our YouTube channel. Receive early notifications as we continue to publish helpful, relevant, and informative Forex related material to support your quest to become a more profitable trader.
To become a more effective trader, consider taking our advanced course. You can access the content description HERE, and the course, HERE.
Our only goal is to make you a better trader.
BTW – Any information communicated by Stonehill Forex Limited is solely for educational purposes. The information contained within the courses and on the website neither constitutes investment advice nor a general recommendation on investments. It is not intended to be and should not be interpreted as investment advice or a general recommendation on investment. Any person who places trades, orders or makes other types of trades and investments, etc. is responsible for their own investment decisions and does so at their own risk. It is recommended that any person taking investment decisions consults with an independent financial advisor. Stonehill Forex Limited training courses and blogs are for educational purposes only, not a financial advisory service, and does not give financial advice or make general recommendations on investment.