We’re Glad You’re Here
Welcome to the next Stonehill Forex indicator study. We’re busy finding different indicators which return better signals than the “boxed set” found on the Metatrader 4 platform. We feel that these indicators may yield superior results than older indicators, better suited for different markets.
Check This Out
We want to showcase the Volatility Quality indicator (VQ), which has gone through a few iterations since its initial development. The version we’re going to use is very easy to use and gives clear signals. The original concept by Thomas Stridsman was first published in 2002 and can be found in the Technical Analysis section of Stocks and Commodities magazine.
What Makes it Special
Simply stated, volatility in the market describes the amplitude (degree) of movement in the market. Often we hear this term in a negative light, such as, “The market’s volatile movements make it difficult to find a good trade”. That’s not wrong, but we actually want to have volatility in the market.
Move Like Jagger
Like volume, without volatility, price won’t move appreciably. In this instance, the Volatility Quality indicator is able to distinguish between “good” and “bad” volatility to help us traders find those beautiful entries we need for profitable trades.
Keeps You In
You’ll see this indicator’s inherent math and visual display, a lot of the volatile price movements are “smoothed” out. We’re also going to address the “amplitude” of the indicator; what it is and why you should ignore it. More on that later in the screenshots.
Confirmation Indicator
As a “confirmation indicator”, its job is to serve as an initial checkpoint AFTER the baseline indicator provides you with the anchor of your algorithm. You’ll also notice that this indicator is a below-chart “zero-line” cross, even though it has red and green colors.
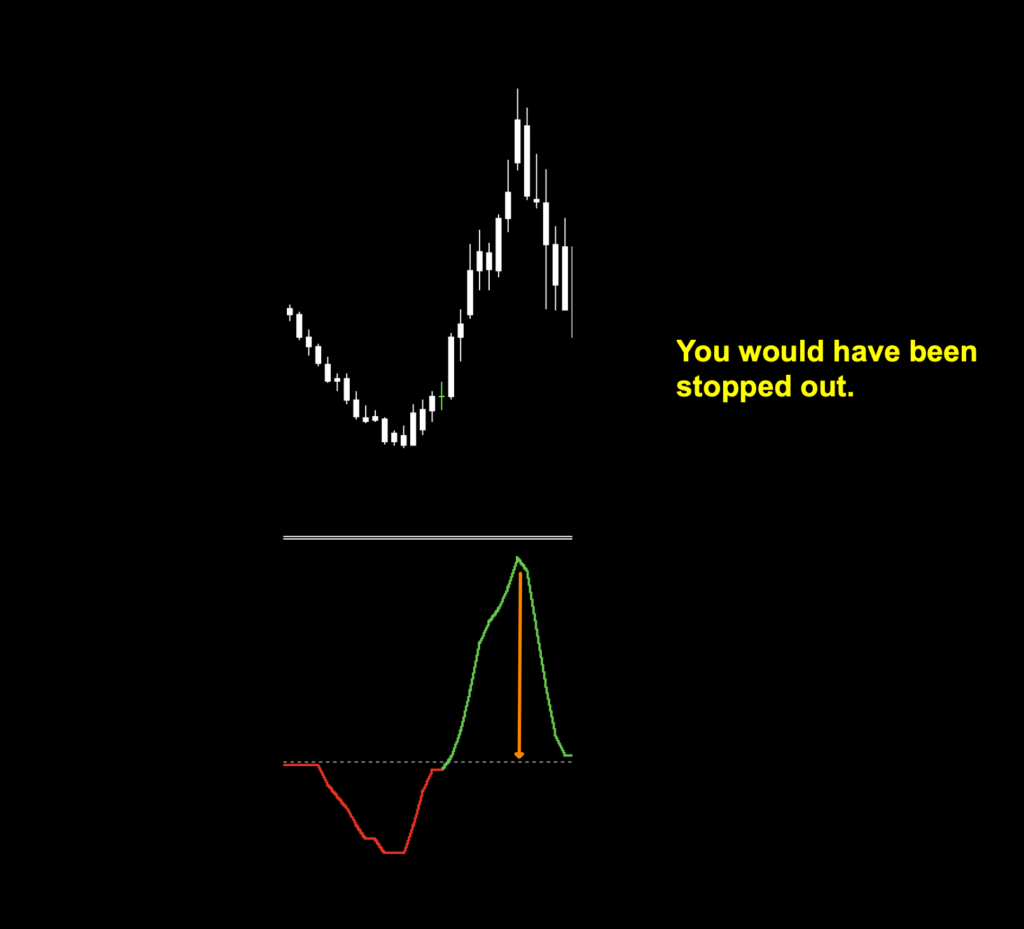
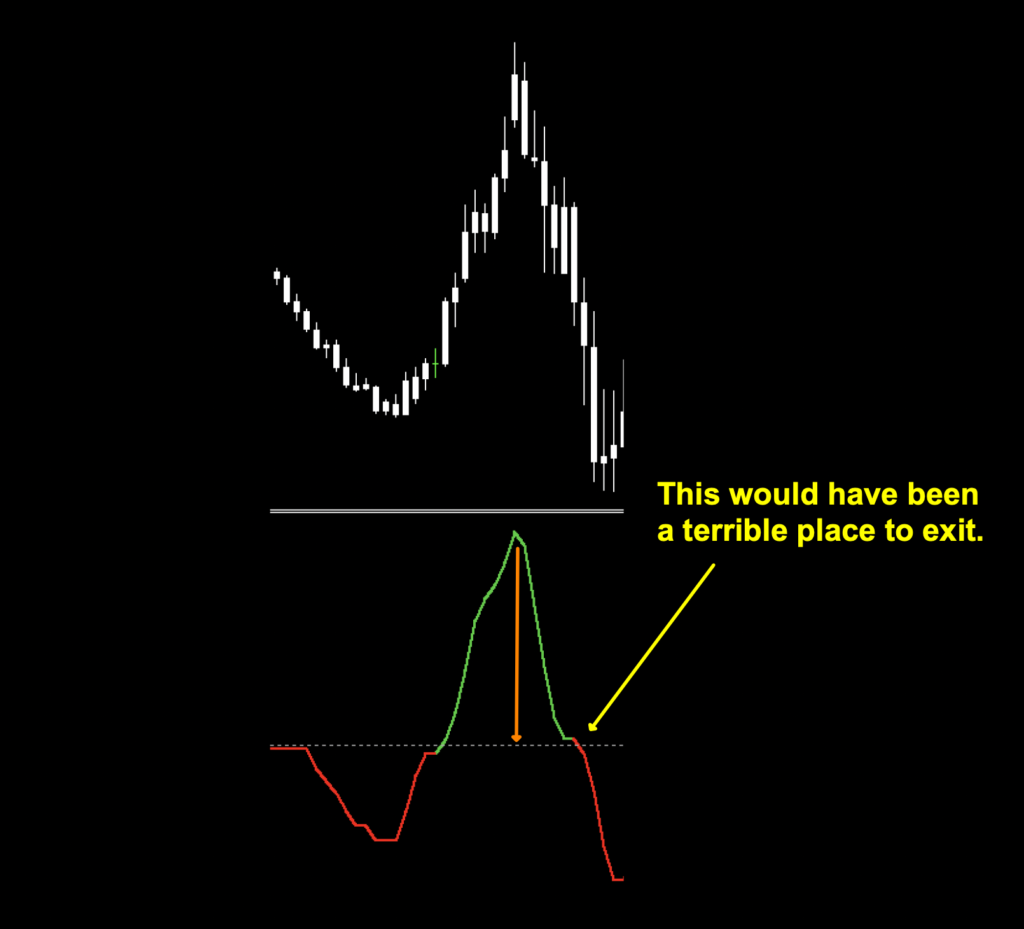
Can it be Used as an Exit?
This indicator can be used as an exit indicator; however, is it the best choice? It depends. For some, the exit signal may come too early or too late and for others, just right. We think this one is not very good…but that’s just our opinion. The point of finding a good exit indicator can only be discovered through back testing. If you find a different indicator which provides better exits, use that. No one will think any less of you. In fact, it demonstrates that you are a true indicator scout.
Ugly is as Ugly Does
We’re going to show an example of where this indicator would make a terrible exit indicator a little further down.
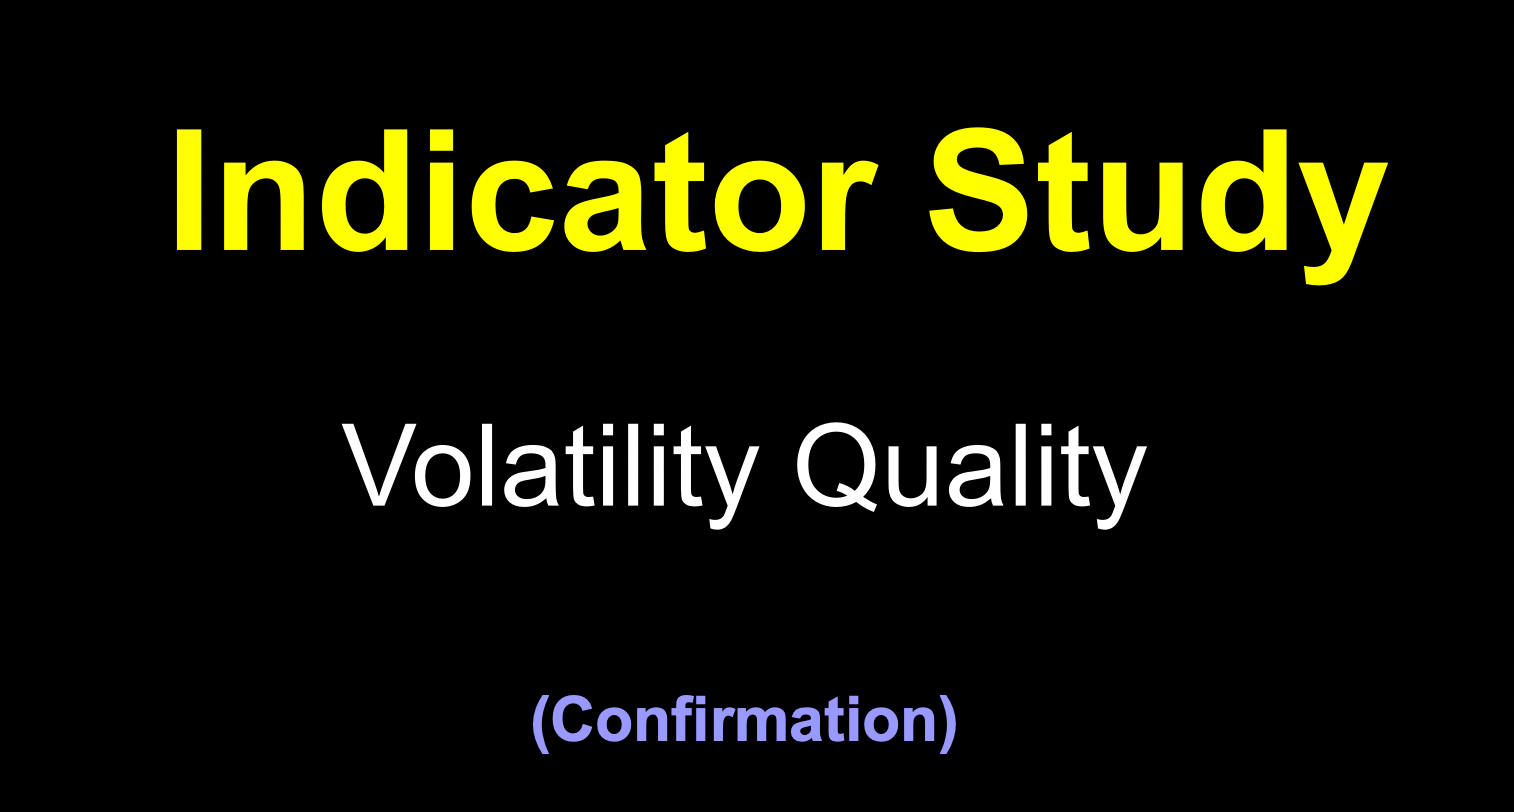
Such an Enchanting Image
In the screenshot below, we’ve plotted the indicator using the default settings, as it shows up pretty clearly. We’ve changed the candle colors to white to remove bias from the chart, which allows focusing strictly on the indicator.
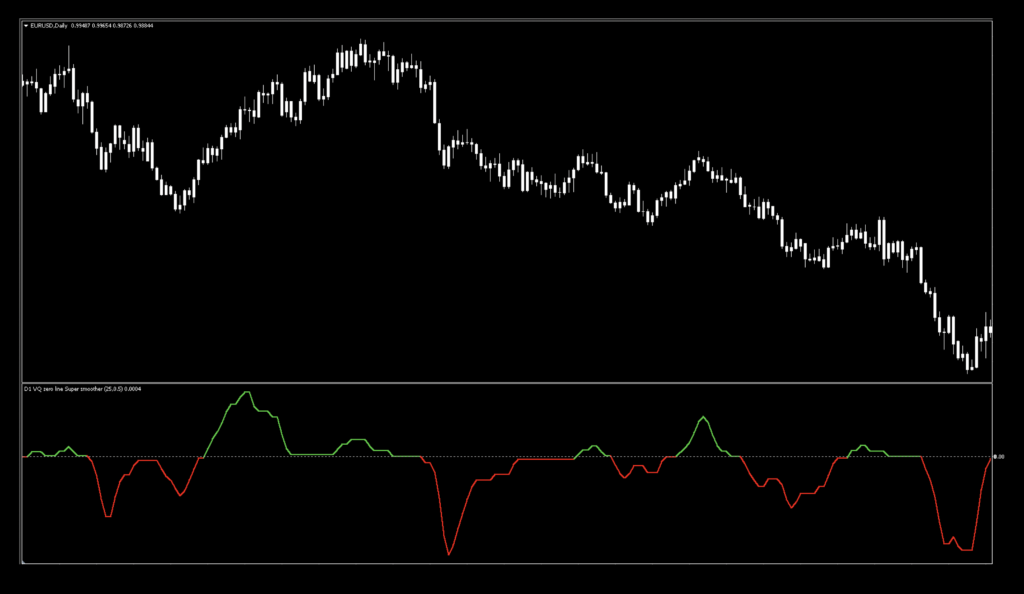
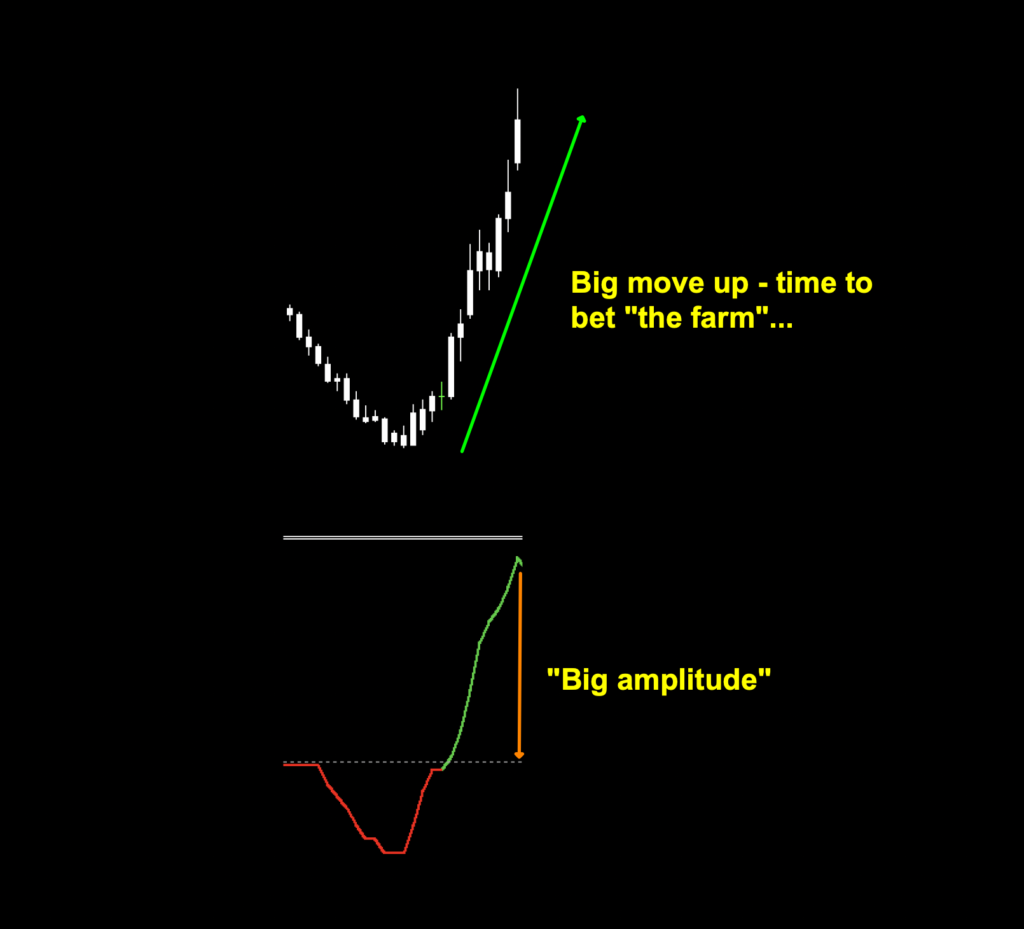
Amplitude
Before we get into the settings and how to use it, we want to point out a characteristic of the indicator which you need to ignore. The amplitude (or distance) away from the zero line. In the image below, we’ve identified extreme levels of amplitude, so you know what we’re referring to.
We don’t care how far the green and red lines diverge from the zero line, we only care about whether it’s above (green) or below (red) zero. That’s all, case closed.
Settings
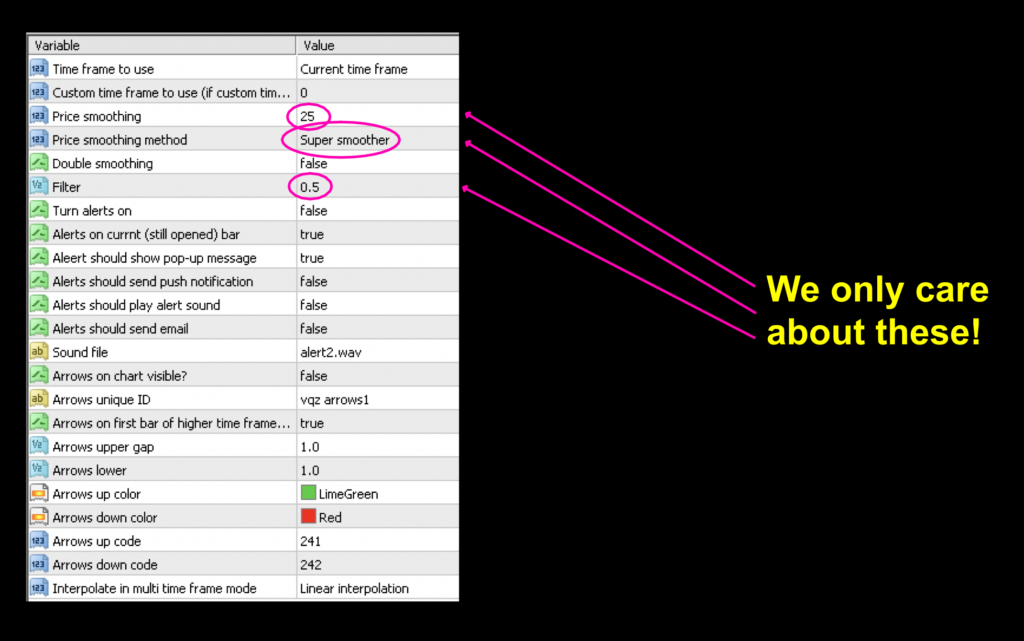
There are a lot of settings; however, we’re only really interested in three of them.
Price smoothing: The number of bars is what determines the look back period in the calculations. The lower the number, the more false signals. The default setting is 25.
Price smoothing method: This is the type of moving average calculation. There are 40 different varieties. The default setting is “Super smoother”.
Filter: This little gem of a setting smooths out the actual red and green lines by adjusting the good and bad volatility. The default setting is 0.5.
Advantages
* One Level Cross creates easy to identify signals.
* Can be used as an exit signal – but we wouldn’t, in this case.
* No interpretation of signals.
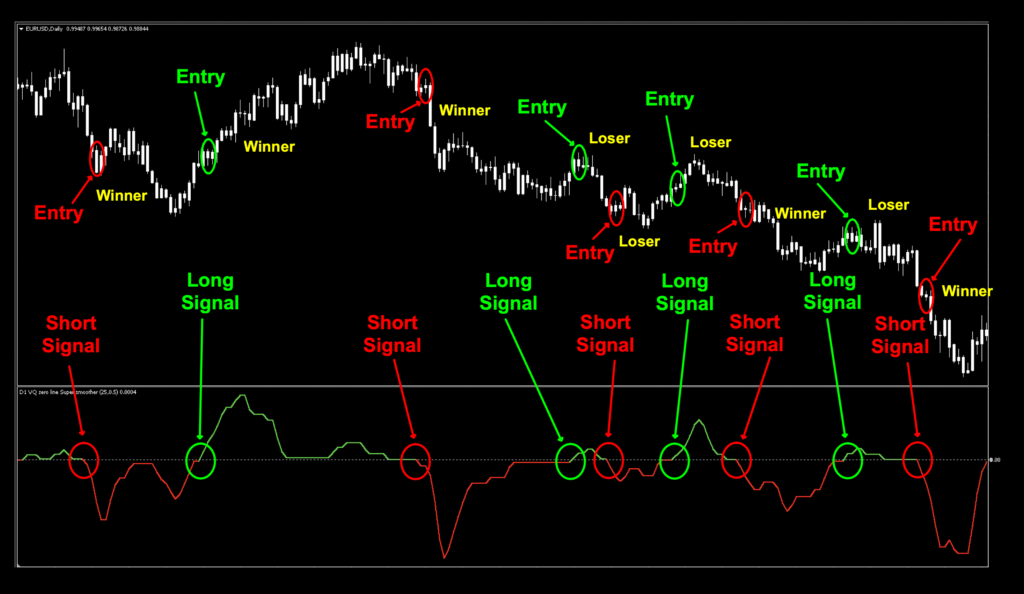
How we use it
Long signal – When the signal line crosses above the “zero line” and turns green, the entry occurs on the open of the next candle.
Short signal – When the signal line crosses below the “zero line” and turns red, the entry occurs on the open of the next candle.
Let’s take a look at a marked up chart to see what we’re talking about.
Why We Ignore Things
You may have wondered why we’re ignoring the amplitude of the indicator. The reason is that there exists a degree of subjectivity – meaning that it’s open for interpretation. If you notice that in some instances, the indicator really “jumps” away from the zero line.
I believe…
You may be inclined to think, “Hey! Price must really be getting ready to take off. I better add positions, or change my take profit level to capture more gains…” Looking at the chart below, you would have been tricked into this instead of just following the signals your algorithm provides. Following your algorithm is the smart move.
Testing…Testing…Testing
Remember, comprehensive analysis is strongly suggested, and we advocate backwards and forward testing indicators or systems prior to trading actual funds. We propose conducting your tests on the following five pairs.
EUR/USD
AUD/NZD
EUR/GBP
AUD/CAD
CHF/JPY
If it doesn’t work on these five pairs, chances are it won’t work on other pairs. This is not an absolute, but we’ve found this rule is reliable in most cases.
A couple of months ago, we added two additional pairs to our testing sequence based on feedback from our community.
They are the:
BTC/USD (Bitcoin/US Dollar)
XAU/USD (Gold/US Dollar)
Coming Right Up!
Once again, our community made suggestions in the video versions of our blogs, and VP suggested we test the S&P500. That being said, we’re going to add that to our testing sequence, so we’ll have NNFX data for another market. We think you’ll find it helpful!
Timeframes and Results
In our initial test, we’ll run the Volatility Quality indicator on the EUR/USD, BTC/USD, XAU/USD, and the SPX500 using the default settings across the daily and 4-hour timeframes on the MT4 strategy tester. We use the fast method of testing the indicator to get a general idea; however, you may also run the tick-by-tick data set for a more precise result (which takes considerably more time).
As No Nonsense Traders – and therefore Swing Traders, we will not examine shorter time frames in these studies. We will also run an additional test, using different values for the settings, to analyze which one may work better and examine the following results:
Total trades
Win/Loss ratio
ROI (return on investment)
There are other metrics included in the strategy tester report, which can be compared, but these three metrics provide the necessary gauge to make quick decisions as to the usefulness of a particular indicator and its settings.
Next, for comparison, we’ll explore the following;
Daily – 1 year
4-hour – 3 months
The reason exceptionally long (or short) testing periods are not included is due to changing market conditions, which might return irrelevant information. A balance of statistically significant data is necessary for accurate results.
And the Outcome…
Below are the spreadsheets illustrating the results from our tests.
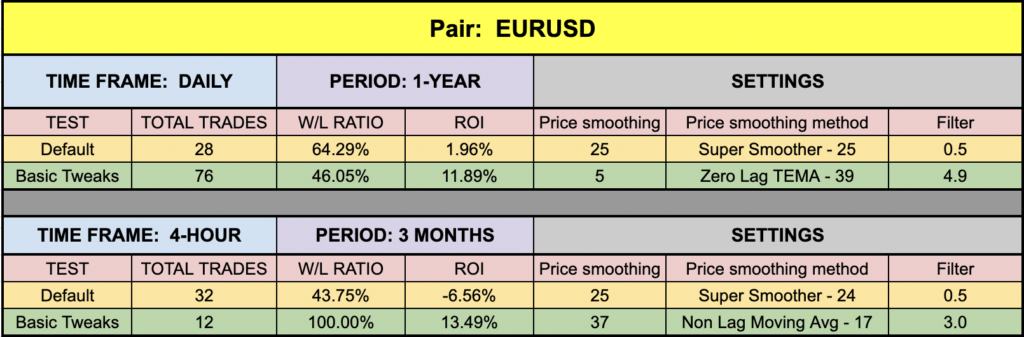
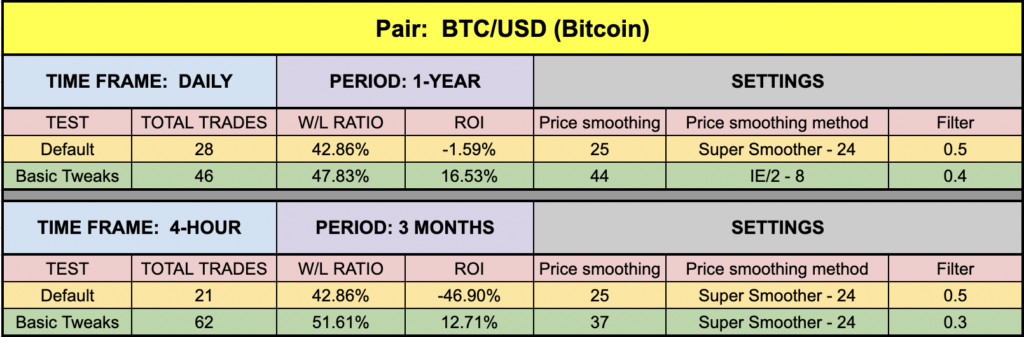
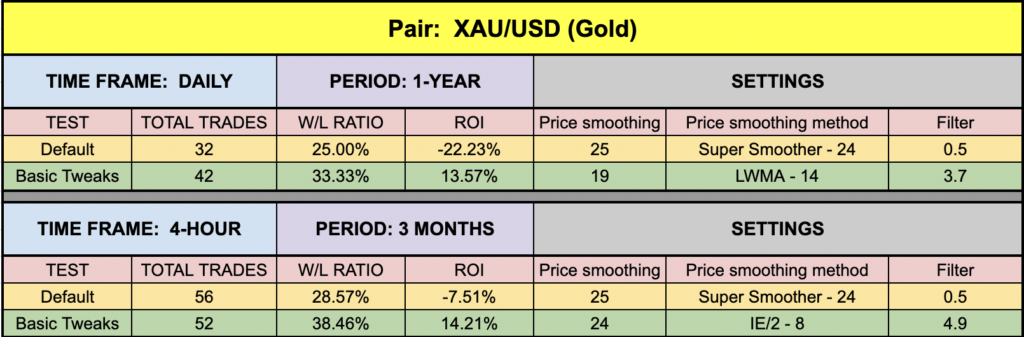
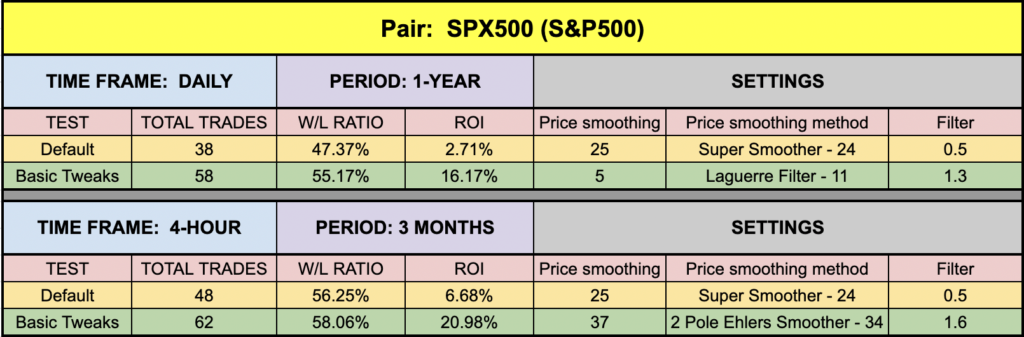
The green highlighted rows represent “basic tweaks” on the settings which returned better results. Are these the best? Not necessarily. Given that variables including testing date range and broker data are different from person to person, you may find better settings.
Trust in Yourself
Remember, the overall NNFX philosophy of taking profit, risk, and drawdown is that YOU are creating a system which YOU will be trading. Don’t let anybody else take that away from you. Part of the learning process is digging in and doing the work yourself. To learn more about these topics, check out the Advanced Course!
That beings said, the results we post in these blogs should never be considered specific trading advice.
***Note: Remember, never use just this one indicator as your decision of whether to open or close a trade. It should be part of a system.
Money Management
If you are curious as to what money management is used on our tests; we have a certain way of determining wins and losses, which can be found in the Advanced Course. Our goal here is to determine how well the indicator reacts to price with respect to producing a long or short signal. Your system, with its risk profile, will dictate individual returns.
Resources
As we did with past indicator studies, we’ve made the Volatility Quality indicator available for download on our site from the indicator library. We will keep adding better indicators with each study for your use, at no charge. When you’re ready to get it, click HERE.
More to Come
There’s a lot more to come. We are excited to provide more trading tips in the near future. Sign up on our contacts page or subscribe to our YouTube channel. Receive early notifications as we continue to publish helpful, relevant, and informative Forex related material to support your quest to become a better trader.
And, now you are aware of another indicator that many traders don’t know or use.
Our only goal is to make you a better trader.
BTW – Any information communicated by Stonehill Forex Limited is solely for educational purposes. The information contained within the courses and on the website neither constitutes investment advice nor a general recommendation on investments. It is not intended to be and should not be interpreted as investment advice or a general recommendation on investment. Any person who places trades, orders or makes other types of trades and investments etc. is responsible for their own investment decisions and does so at their own risk. It is recommended that any person taking investment decisions consults with an independent financial advisor. Stonehill Forex Limited training courses and blogs are for educational purposes only, not a financial advisory service, and does not give financial advice or make general recommendations on investment.