Welcome to the next Stonehill Forex indicator study. We research the internet, finding better performing indicators beyond what is offered in the “boxed set” found on the Metatrader 4 platform. We feel that these indicators may yield superior results than older indicators, suited for different markets.
Our Next Find
We’re highlighting an indicator created by a very accomplished and long-standing member of the trading community. In this blog, we’ll be taking an in-depth look at the Kaufman Adaptive Moving Average (KAMA) by Perry Kaufman, developed in 1998.
Mr. Mojo
Mr. Kaufman has quite the impressive resume; Systematic Trader, Index Developer, and Quantitative Financial Theorist. Not to mention that he’s also considered a leading expert in the development and implementation of algorithmic trading programs…not unlike what we do here. So listen up, and read on!
Moving Average? So What!
“Wait, you said moving averages…” Yes, we did. This is not your tired, run-of-the-mill moving average. This is a highly efficient moving average which changes character based on the dynamic movement of the market. Most moving averages lag too much. KAMA is designed to interpret market noise, also known as volatility by following price closely when volatility is small and will create a “gap” between itself and price during high volatile price movements, keeping you in trades longer for more profit. And, isn’t that exactly what we want from our indicators?
Mr. Mojo’s Math
Let’s pull the curtain back a bit to see what Mr. Kaufman created. There are a few steps required to calculate KAMA, so we’ll take them one at a time.
FIRST: Efficiency Ratio (ER) – price change adjusted for the daily volatility. (ABS stands for Absolute Value)
ER = Change/Volatility
Change = ABS(Close – Close (10 periods ago))
Volatility = Sum10(ABS(Close – Prior Close))
Volatility is the sum of the absolute value of the last ten price changes (Close – Prior Close).
SECOND: Smoothing Constant – this uses the ER and two smoothing constants based on an exponential moving average.
SC = [ER x (fastest SC – slowest SC) + slowest SC]²
SC = [ER x (2/(2+1) – 2/(30+1)) + 2/(30+1)]²
THIRD: KAMA, the indicator itself. An initial value is required to start the calculation, so the first KAMA is just a simple moving average. The following calculations are based on the formula below.
Current KAMA = Prior KAMA + SC x (Price – Prior KAMA)
Baseline Indicator
The KAMA indicator is an on-chart indicator, overlaying price. A baseline indicator serves as an initial gatekeeper when setting up your algorithm and provides the initial signal before confirmations and volume are considered. These concepts are explained in the Stonehill Forex Advanced Course HERE.
Advantages
* Single line signal for easy interpretation
* Detects trends earlier than other moving averages
Baselines for Exits, Maybe?
One of the questions we get is if a baseline indicator can be used for an exit. In truth, there is no definitive “yes”, or “no”. We think “it depends” is better suited here. And why is that? It all has to do with how your indicators behave and react together. An indicator which gives you amazing entries can stink at exits. Does that mean you toss it in the bin? No way! Find a better exit indicator. It’s your algorithm and your rules. Find an exit indicator that gives you superstar exits, and only use it for that…if you like.
Single Lines are Elementary
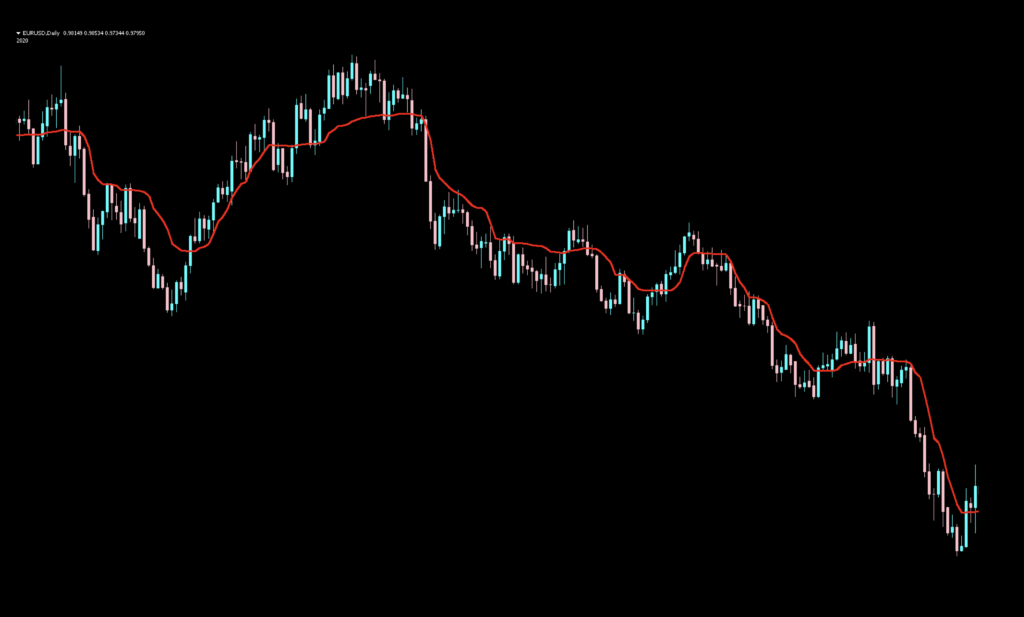
Below is a screenshot of what the indicator looks like on the daily time frame. Note that we’ve changed the candles to “blue” and “pink” to create contrast between price and the KAMA indicator and to illustrate entries. We’ve also thickened the indicator line to make it more visible.
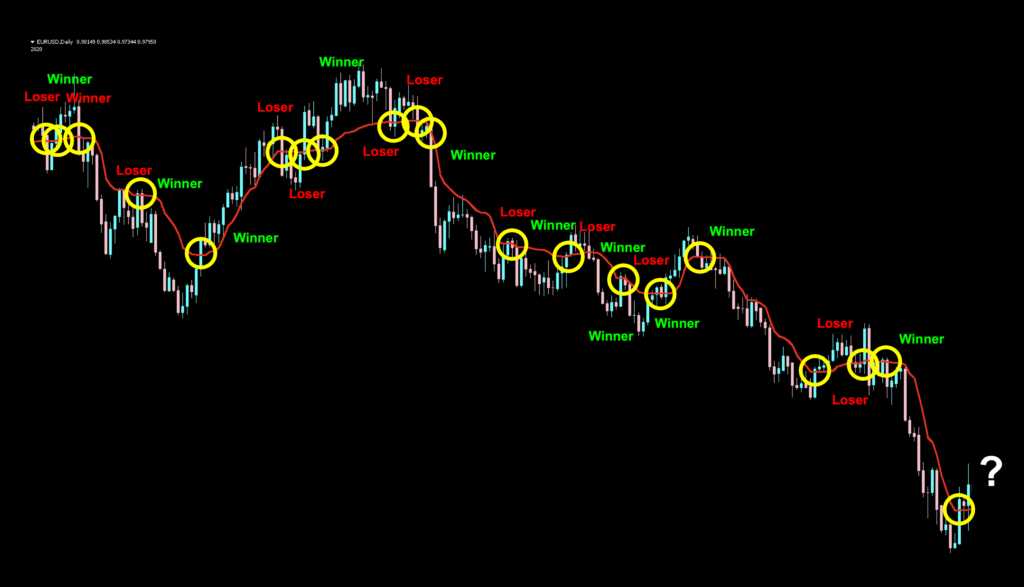
Signals
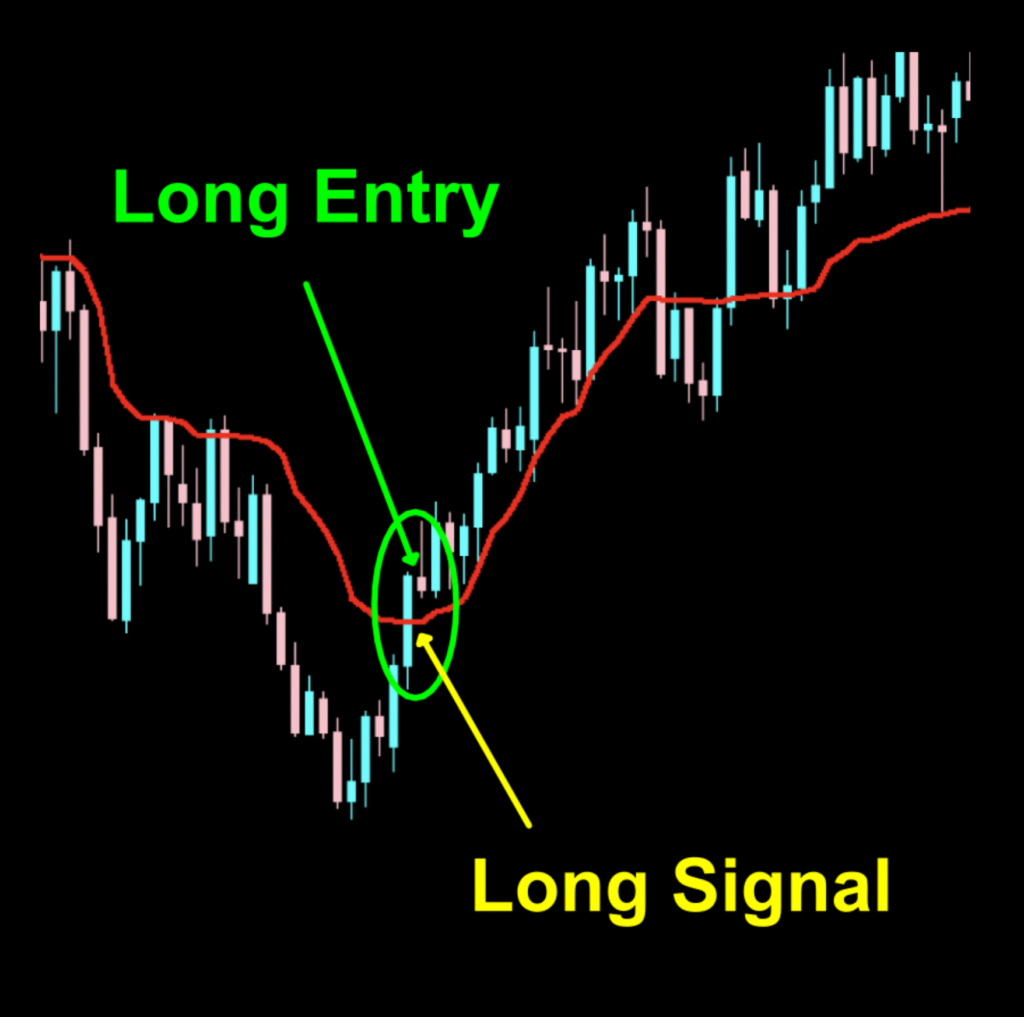
Long = Price closes above the indicator. Entry on next open period.
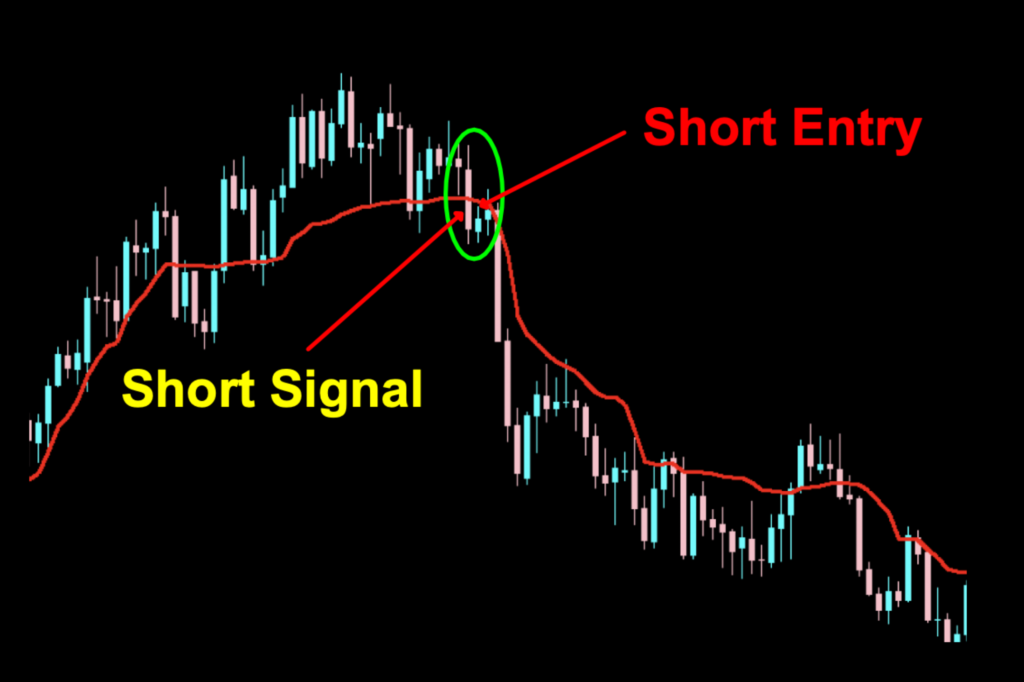
Short = Price closes below the indicator. Entry on next open period.
We’ll identify all the signals on this chart view before taking a closer look for clarification. You can see on the image below, that when price goes sideways, KAMA follows closely, creating a few false signals. This is normal.
Let’s take a look at a couple of signals close up, so we know what we’re looking for.
Going Long
Going Short
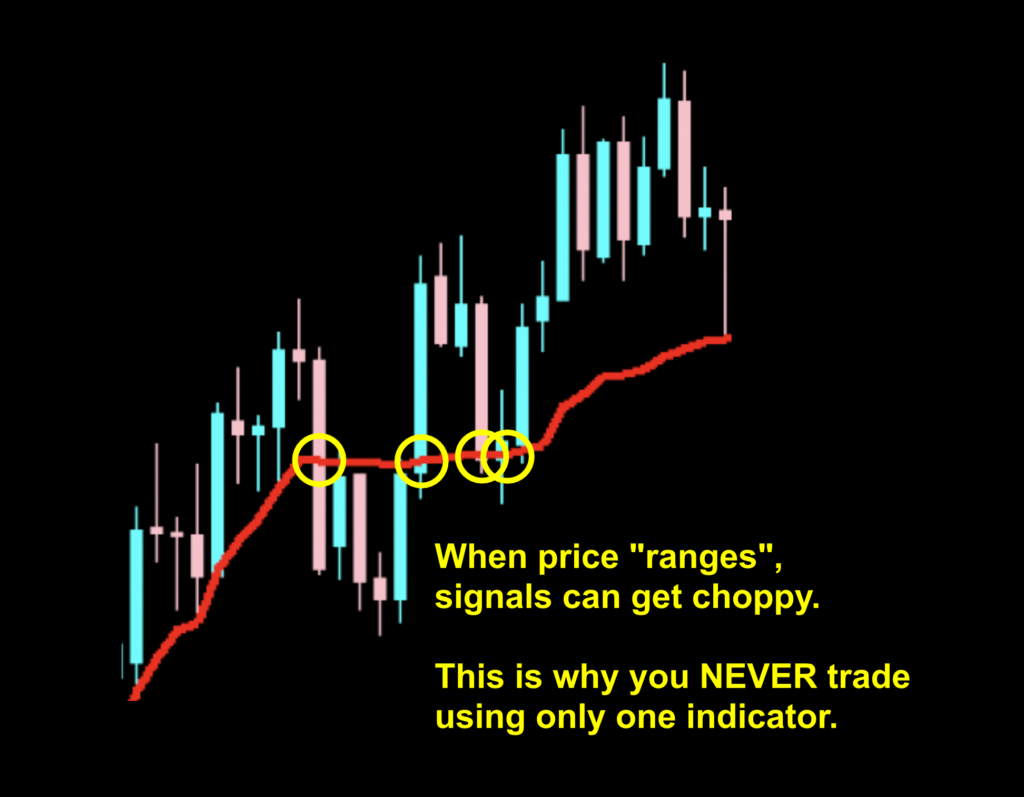
Congestion & Traffic
There are times when you can get mixed signals. That’s normal. We’ll identify an area of low volatility where price goes sideways and creates a few false signals. This is where the rest of your algorithm comes into play to keep you out of making losing trades, and perfectly illustrates why you NEVER trade using only one indicator. Let’s take a quick look.
Settings
There are three variables for this indicator; We’ll look at each one before moving into the testing portion of the blog.
kama_period: This variable is to set the number of periods for the Efficiency Ratio (ER). The default value is 10.
fast_ma_period: This variable is the number of periods for the fastest EMA (Exponential Moving Average) constant. The default value is 2.0.
slow_ma_period: This variable is the number of periods for the florist EMA constant. The default value is 30.0.
Testing…Testing…Testing
Remember, comprehensive analysis is strongly suggested, and we advocate backwards and forward testing indicators or systems prior to trading actual funds. We propose conducting your tests on the following five pairs.
EUR/USD
AUD/NZD
EUR/GBP
AUD/CAD
CHF/JPY
If it doesn’t work on these five pairs, chances are it won’t work on other pairs. This is not an absolute, but we’ve found this rule is reliable in most cases.
A couple of months ago, we added two additional pairs to our testing sequence based on feedback from our community.
They are the:
BTC/USD (Bitcoin/US Dollar)
XAU/USD (Gold/US Dollar)
You Asked, We Listened
Once again, our community made suggestions in the video versions of our blogs, and VP suggested we test the S&P500. That being said, we’re going to add that to our testing sequence, so we’ll have NNFX data for another market. We think you’ll find it helpful!
Timeframes and Results
In our initial test, we’ll run the KAMA indicator on the EUR/USD, BTC/USD, XAU/USD, and the SPX500 using the default settings across the daily and 4-hour timeframes on the MT4 strategy tester. We use the fast method of testing the indicator to get a general idea; however, you may also run the tick-by-tick data set for a more precise result (which takes considerably more time).
As No Nonsense Traders – and therefore Swing Traders, we will not examine shorter time frames in these studies. We will also run an additional test, using different values for the settings, to analyze which one may work better and examine the following results:
Total trades
Win/Loss ratio
ROI (return on investment)
There are other metrics included in the strategy tester report, which can be compared, but these three metrics provide the necessary gauge to make quick decisions as to the usefulness of a particular indicator and its settings.
Next, for comparison, we’ll explore the following;
Daily – 1 year
4-hour – 3 months
The reason exceptionally long (or short) testing periods are not included is due to changing market conditions, which might return irrelevant information. A balance of statistically significant data is necessary for accurate results.
And the Outcome…
Below are the spreadsheets listing the results from our tests.
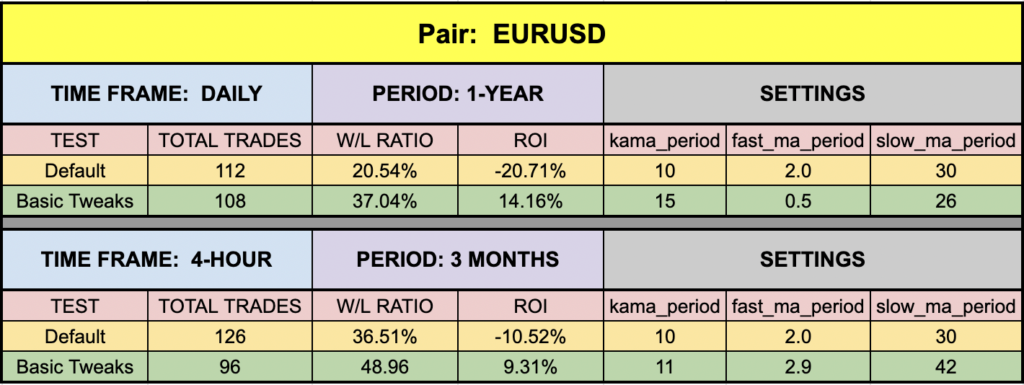
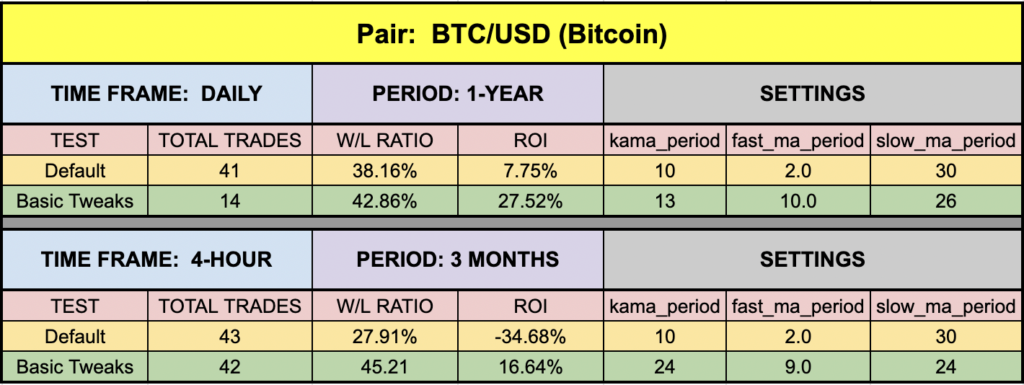
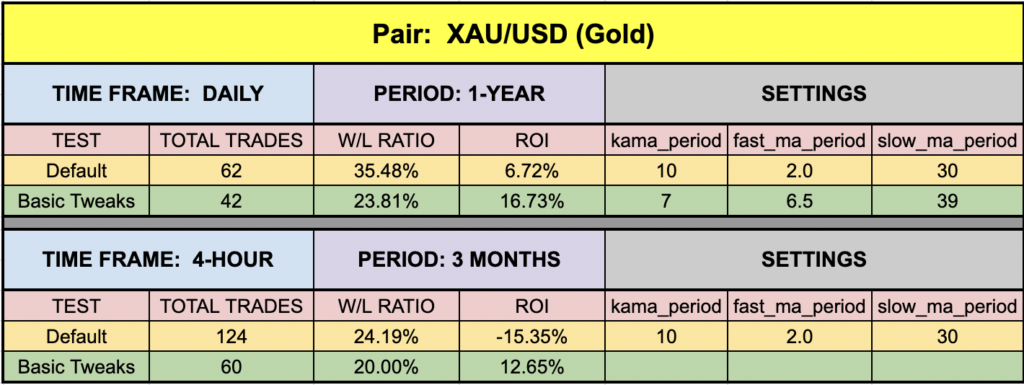
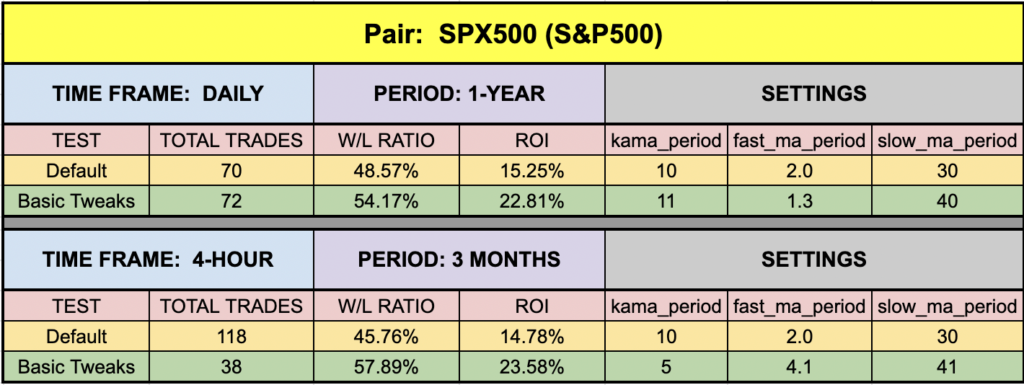
The green highlighted rows represent “basic tweaks” on the settings which returned better results. Are these the best? Not necessarily. Given that variables including testing date range and broker data are different from person to person, you may find better settings.
Remember, the overall NNFX philosophy of taking profit, risk, and drawdown is that YOU are creating a system which YOU will be trading. Don’t let anybody else take that away from you. Part of the learning process is digging in and doing the work yourself. To learn more about these topics, check out the advanced course!
That beings said, the results we post in these blogs should never be considered specific trading advice.
***Note: Remember, never use just this one indicator as your decision of whether to open or close a trade. It should be part of a system.
Money Management
If you are curious as to what money management is used on our tests; we have a certain way of determining wins and losses, which can be found in the Advanced Course. Our goal here is to determine how well the indicator reacts to price with respect to producing a long or short signal. Your system, with its risk profile, will dictate individual returns.
Resources
As we did with past indicator studies, we’ve made the KAMA indicator available for download on our site from the indicator library. We will keep adding better indicators with each study for your use, at no charge. When you’re ready to get it, click HERE.
More to Come
There’s a lot more to come. We are excited to provide more trading tips in the near future. Sign up on our contacts page or subscribe to our YouTube channel. Receive early notifications as we continue to publish helpful, relevant, and informative Forex related material to support your quest to become a better trader.
And, now you are aware of another indicator that many traders don’t know or use.
Our only goal is to make you a better trader.
BTW – Any information communicated by Stonehill Forex Limited is solely for educational purposes. The information contained within the courses and on the website neither constitutes investment advice nor a general recommendation on investments. It is not intended to be and should not be interpreted as investment advice or a general recommendation on investment. Any person who places trades, orders or makes other types of trades and investments etc. is responsible for their own investment decisions and does so at their own risk. It is recommended that any person taking investment decisions consults with an independent financial advisor. Stonehill Forex Limited training courses and blogs are for educational purposes only, not a financial advisory service, and does not give financial advice or make general recommendations on investment.