More Good Stuff
We came across another indicator developed by one of our trading heroes. It may look like many others, but rest assured, it’s definitely not like the others. You definitely won’t find this included with the MetaTrader4 platform because what we aim to do is find you indicators from near (and far) which will may help you become a profitable trader. And…that’s what we’re all after, right?
John’s the Man
One of our heroes is none other than the man himself…John Ehlers. His distinguished titles are Chief Scientist and President of MESA Software, Inc., and is a technical analyst and Electrical Engineer, to boot. His specialty during his doctoral work was Fields & Waves and Information Theory. An all around super smart guy, he’s developed the foundation for many current indicators.
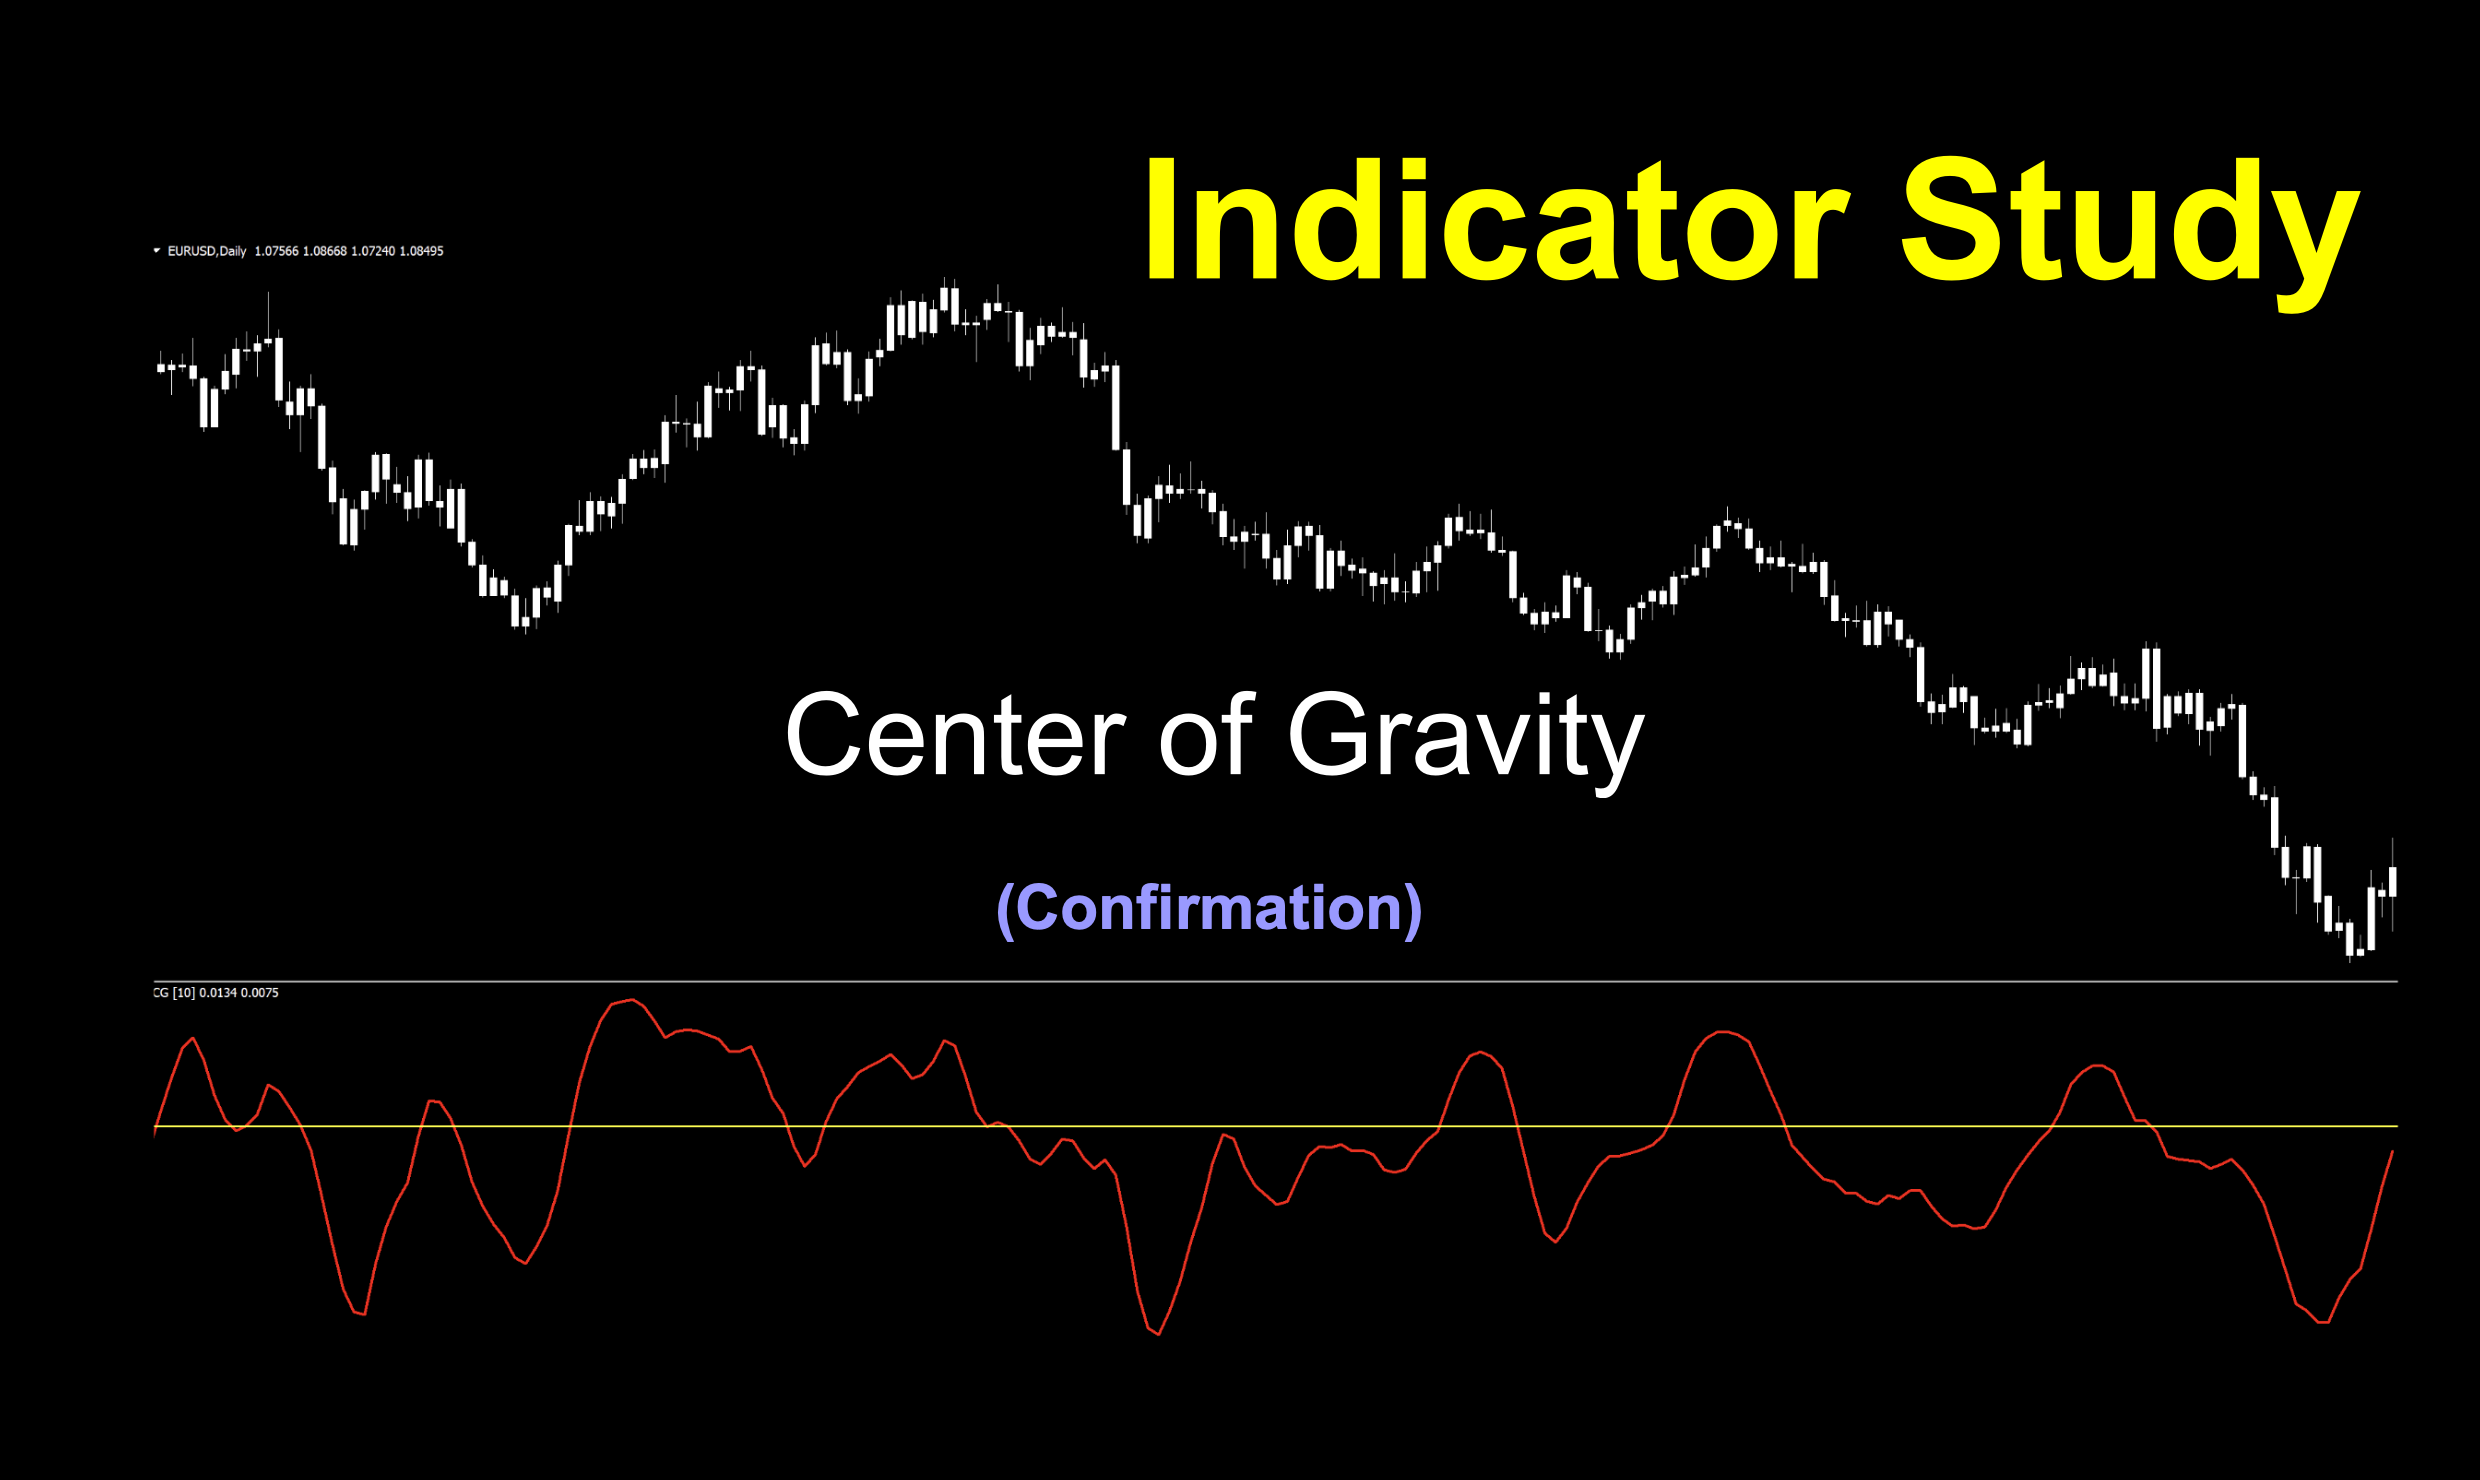
This week’s blog is highlighting one called the Center of Gravity indicator, based on his work from 2002. We’ll take a dive into the gravity pool and see what it can do for us.
Center of Gravity?
It’s kind of an odd name, don’t you think? After a little digging, we discovered that its title stems from the fact that his indicator uses math to create a sort of balance of price action. The faster a price moves, the quicker the indicator responds and paints the appropriate lines to reflect momentum. This is the “reduction of lag” he describes. Very cool…
A Different Path
While Mr. Ehlers details his indicator as one which attempts to identify turning points, or price reversals, it’s just not something we like to use as trend traders. But that’s okay. His indicator’s properties are excellent for identifying a trend once it’s begun, and can generate signals very well. We’ll talk a little more about this below.
Okay, So What’s the Math
This is where having a computer to calculate the indicator is key. We’ll give you the formula(s), but if you want to manually run numbers, we’ll be in the next room wishing you the best.
Step 1
In the first part, Mr. Ehlers refers to a filter called the FIR (Finite Impulse Response). The formula for that is below.
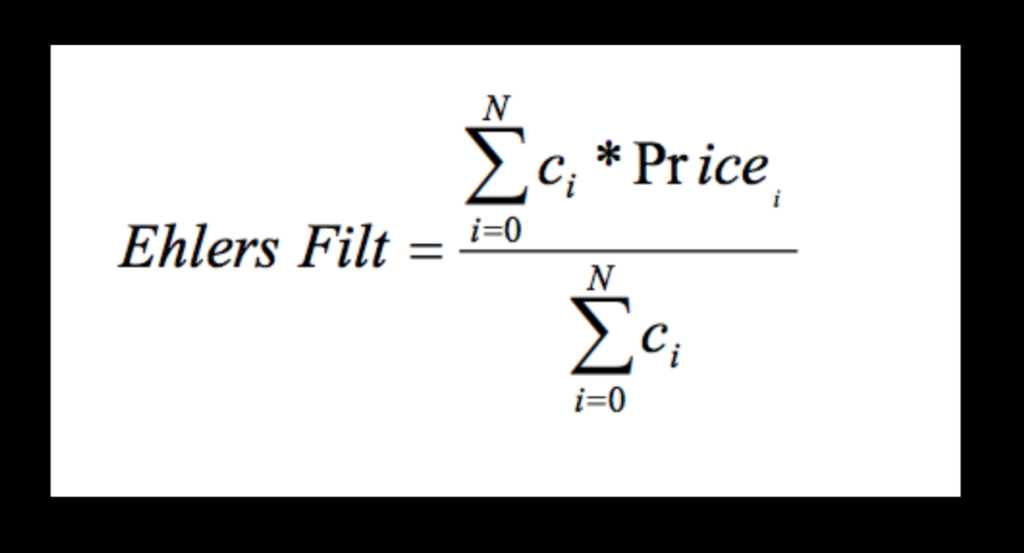
You’re not done. Break out that slide rule and get to work on this…
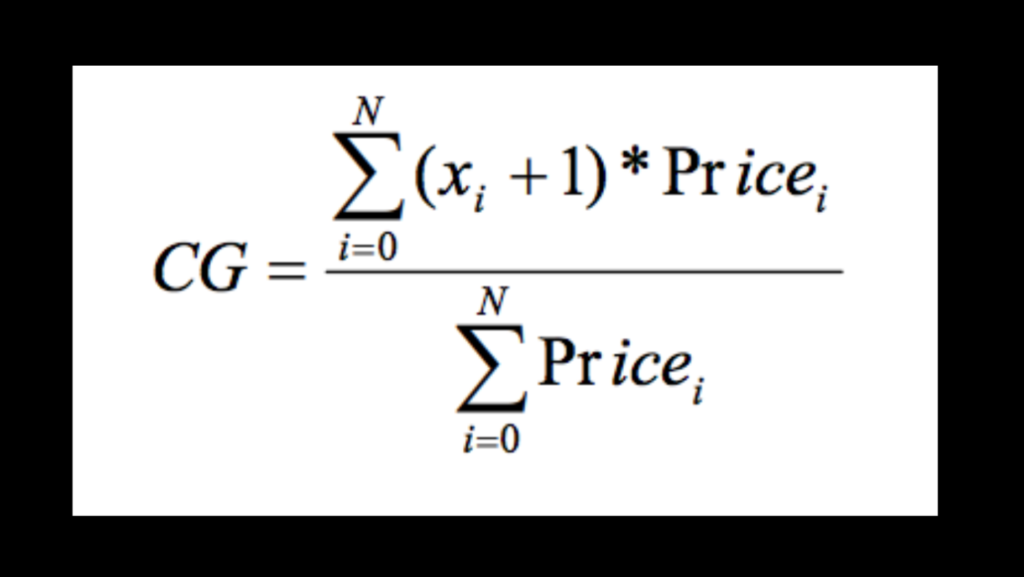
Once again, let’s all give thanks for the modern computer.
Confirmation Indicator
As the title suggests, the Center of Gravity indicator is classified as a confirmation indicator and is a single level (zero cross) that occupies the space below your price chart window. At first glance, it doesn’t look that way, but bear with us.
Fine and Dandy
In the screenshot below, we’re showing you the default view, which includes both lines, so you’ll recognize it when loading it onto your MT4 platform. As we sometimes do…we’ll be making a few changes and explain what we did. Of course, price candles are changed to white to remove price bias, so we can concentrate on what’s important.
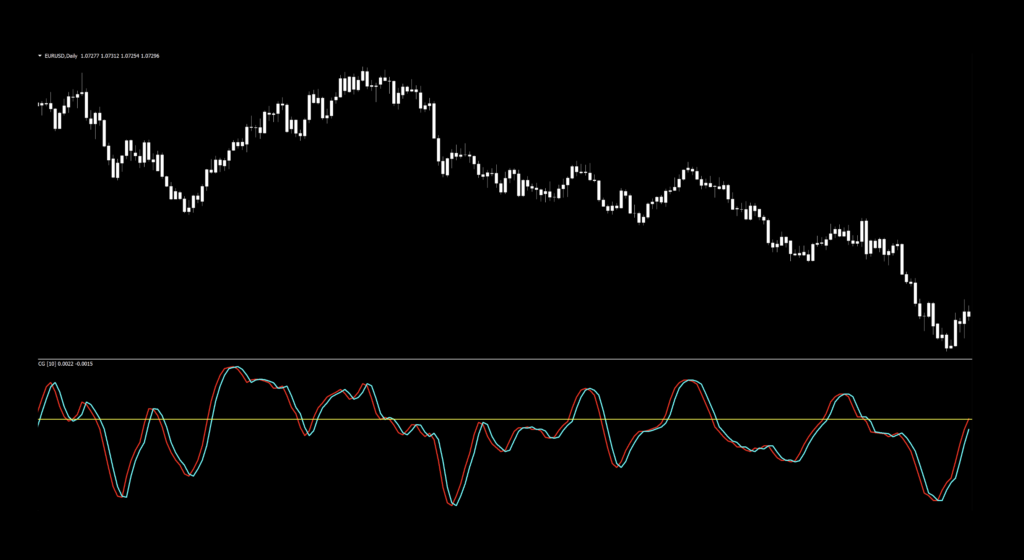
Two of a Kind
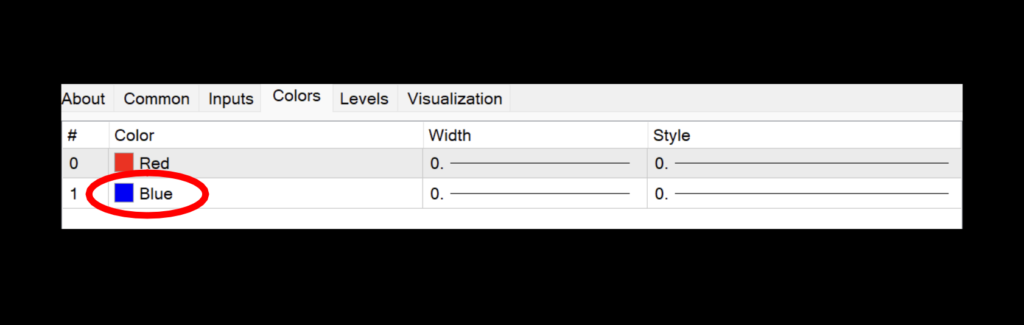
The first thing you notice is that there are two lines, like many other indicators. However, we are not going to use the indicator as a two-lines cross. “And why not?” you may ask. Don’t worry, we’re going to show you why not in a little bit.
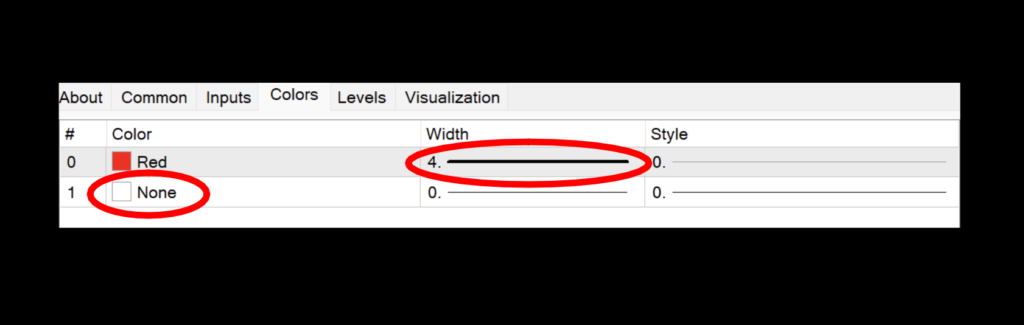
So that being said, we’re going to get rid of the blue line by going into the settings and making it go away…as noted below.
 And while you’re at it, thicken up the red line to “4” for easier viewing.
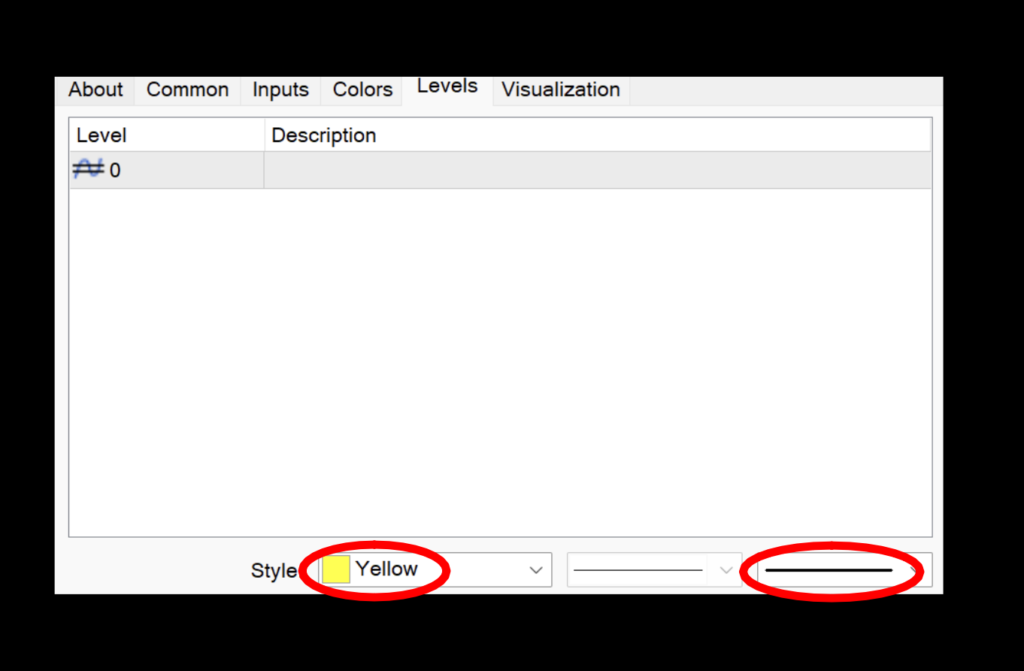
 And then color a “zero line” in yellow and thicken it up.
The result looks like this…
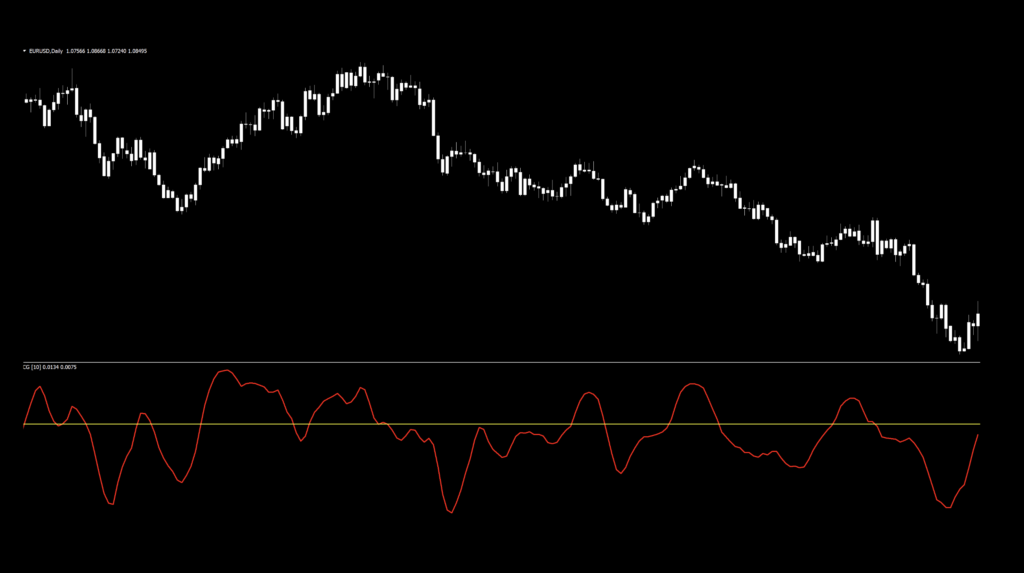
Before we get into why we’re only looking at the one line, let’s take a fast peek at the settings.
Settings
There is only one variable, which makes this an easy indicator to adjust.
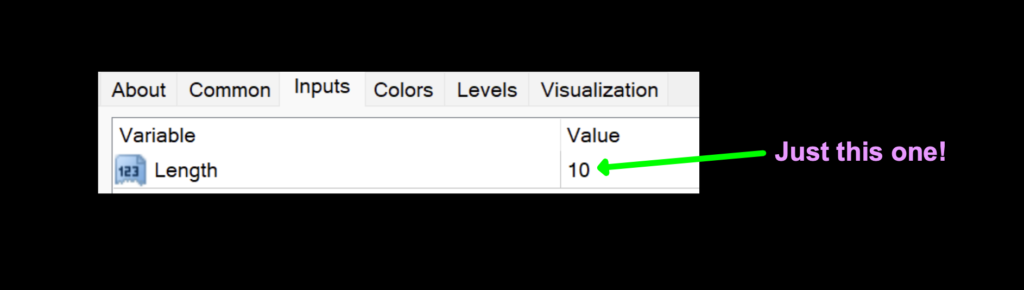
Length: This lone variable tells the formula how many periods to take into consideration when calculating the signal line. The default setting is 10.
Advantages
* One Level Cross creates easy to identify signals.
* Reduced lag creates a more responsive indicator.
* Easy to test
How we use it
Long signal – When the red signal line crosses above the zero line, the entry occurs on the open of the next candle.
Short signal – When the red signal line crosses below the zero line, the entry occurs on the open of the next candle.
Let’s take a look at a marked up chart to see what kind of signals were generated using the default settings.
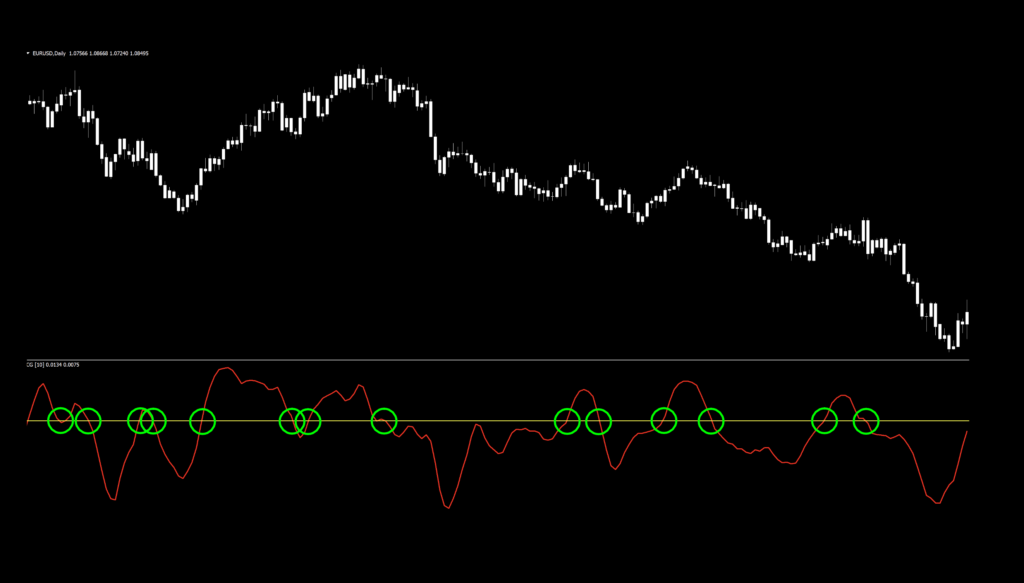
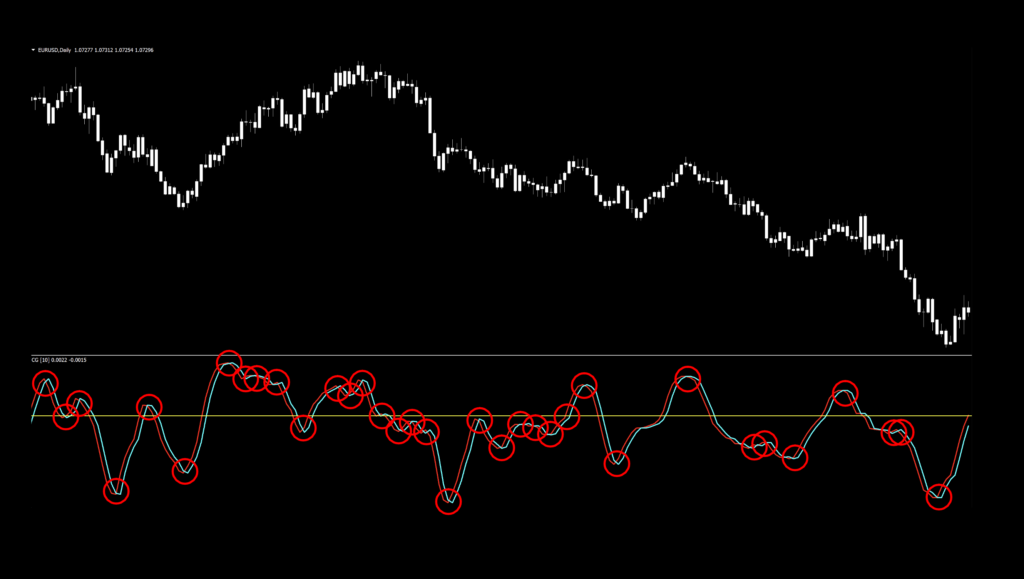
There were a couple of places where poor entries were signaled, but that’s where the rest of your algorithm may have kept you out of them. Now, here’s the kicker. Had you decided to use this indicator as a two lines cross, check out how many bad entries you would have had to deal with in the screenshot below. The decision is pretty clear.
Testing…Testing…Testing…
Remember, comprehensive analysis is strongly suggested, and we advocate backwards and forward testing indicators or systems prior to trading actual funds. We propose conducting your tests on the following pairs.
EUR/USD
AUD/NZD
EUR/GBP
AUD/CAD
CHF/JPY
CAD/SGD
If it doesn’t work on these 6 pairs, chances are it won’t work on other pairs. This is not an absolute, but we’ve found this rule is reliable in most cases.
The markets we test our indicators are the:
EUR/USD (Euro/US Dollar)
BTC/USD (Bitcoin/US Dollar)
XAU/USD (Gold/US Dollar)
SPX500 (S&P500 Index)
Timeframes and Results
In our initial test, we’ll run the Center of Gravity indicator on the EUR/USD, BTC/USD, XAU/USD, and the SPX500 using the default settings across the daily and 4-hour timeframes on the MT4 strategy tester. We use the fast method of testing the indicator to get a general idea; however, you may also run the tick-by-tick data set for a more precise result (which takes considerably more time).
As No Nonsense Traders – and therefore Swing Traders, we will not examine shorter time frames in these studies. We will also run an additional test, using different values for the settings, to analyze which one may work better and examine the following results:
Total trades
Win/Loss ratio
ROI (return on investment)
There are other metrics included in the strategy tester report, which can be compared, but these three metrics provide the necessary gauge to make quick decisions as to the usefulness of a particular indicator and its settings.
Next, for comparison, we’ll explore the following;
Daily – 1 year
4-hour – 3 months
The reason exceptionally long (or short) testing periods are not included is due to changing market conditions, which might return irrelevant information. A balance of statistically significant data is necessary for accurate results.
And the Outcome…
Below are the spreadsheets illustrating the results from our tests.
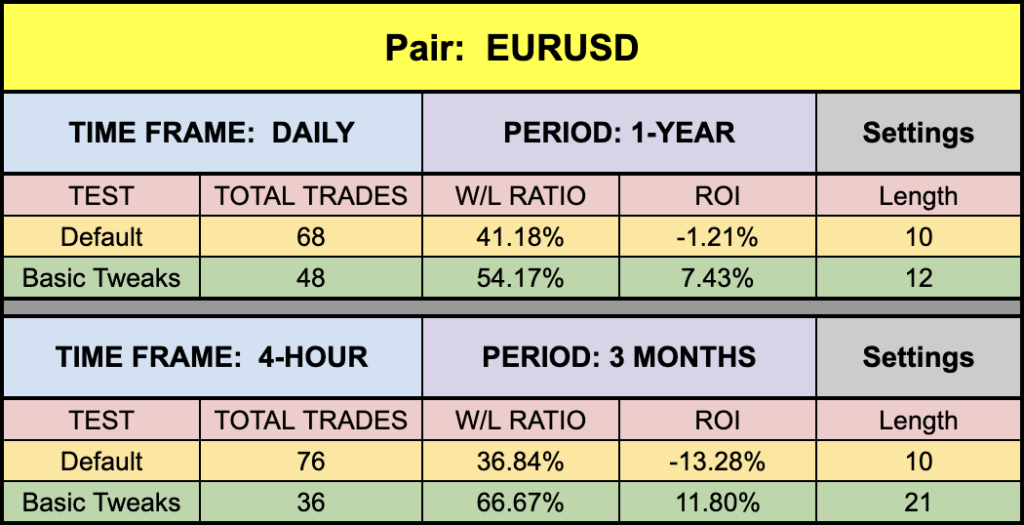
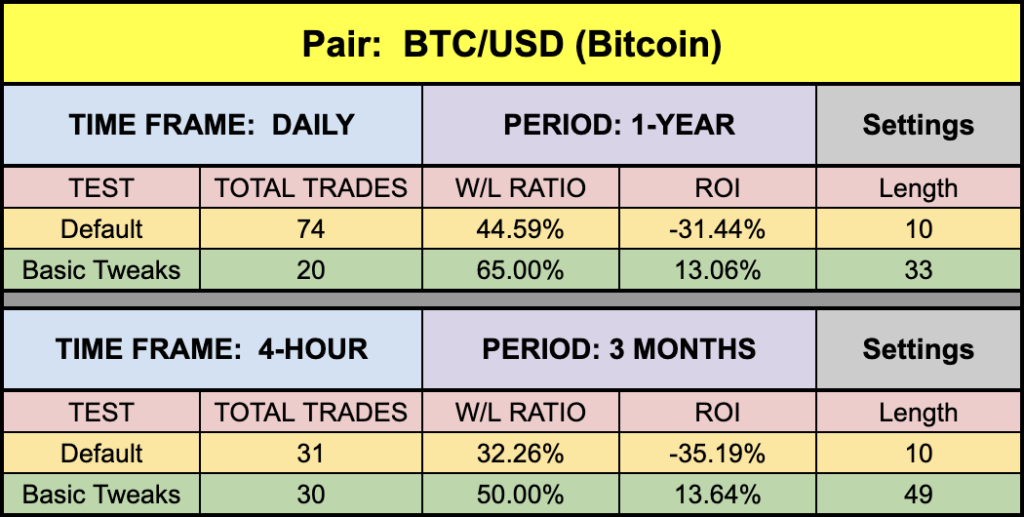
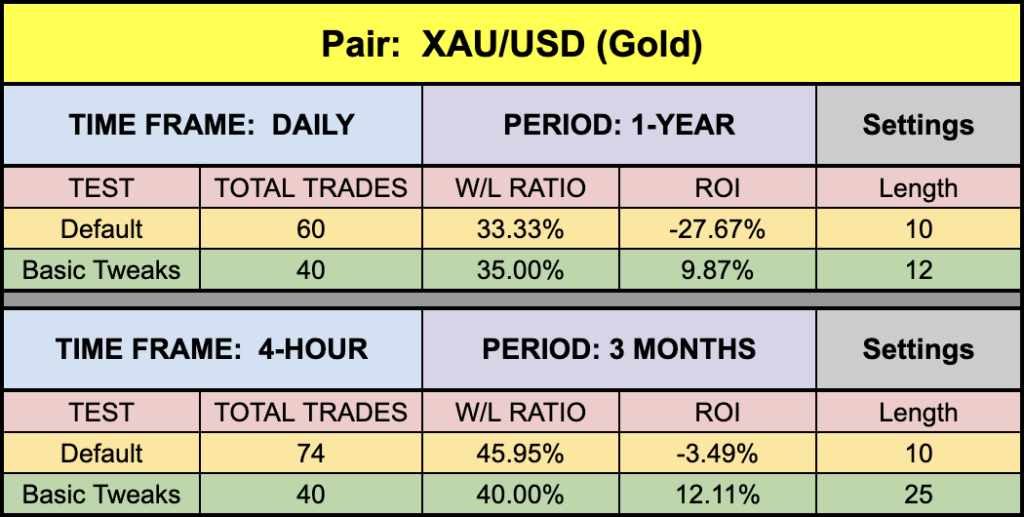

The green highlighted rows represent “basic tweaks” on the settings which returned better results. Are these the best? Not necessarily. Given that variables including testing date range and broker data are different from person to person, you may find better settings.
Next Week’s Blast From the Past
We’re going to begin looking at some indicators which were developed from a French mathematician named Edmond Nicolas Laguerre and whose work inspired super smart contemporary traders, engineers, and others to create some very interesting indicators. Don’t miss it!
Trust In Yourself
Remember, the overall NNFX philosophy of taking profit, risk, and drawdown is that YOU are creating a system which YOU will be trading. Don’t let anybody else take that away from you. Part of the learning process is digging in and doing the work yourself. To learn more about these topics, check out the Advanced Course!
That being said, the results we post in these blogs should never be considered specific trading advice.
***Note: Remember, never use just this one indicator as your decision of whether to open or close a trade. It should be part of a system.
Money Management
If you are curious as to what money management is used on our tests; we have a certain way of determining wins and losses, which can be found in the Advanced Course. Our goal here is to determine how well the indicator reacts to price with respect to producing a long or short signal. Your system, with its risk profile, will dictate individual returns.
Resources
As we did with past indicator studies, we’ve made the Center of Gravity indicator is available for download on our site from the indicator library. We will keep adding better indicators with each study for your use, at no charge. When you’re ready to get it, click HERE.
More to Come
There’s a lot more to come. We are excited to provide more trading tips in the near future. Sign up on our contacts page or subscribe to our YouTube channel. Receive early notifications as we continue to publish helpful, relevant, and informative Forex related material to support your quest to become a better trader.
And, now you are aware of another indicator that many traders don’t know or use.
Our only goal is to make you a better trader.
BTW – Any information communicated by Stonehill Forex Limited is solely for educational purposes. The information contained within the courses and on the website neither constitutes investment advice nor a general recommendation on investments. It is not intended to be and should not be interpreted as investment advice or a general recommendation on investment. Any person who places trades, orders or makes other types of trades and investments etc. is responsible for their own investment decisions and does so at their own risk. It is recommended that any person taking investment decisions consults with an independent financial advisor. Stonehill Forex Limited training courses and blogs are for educational purposes only, not a financial advisory service, and does not give financial advice or make general recommendations on investment.