***Caution***
There were a few questions on VP’s video that we wanted to address. We did some on-line research and conducted a few bench tests discovered instances where the indicator “redrew” an arrow. This being said, we can only caution you when using this indicator. We have seen instances of a non-repainting version as part of a system and will see if we can get that for the resource page.
Additionally, the black dots are the indicator’s attempt to call trend continuations and reversals – something we do not use, or test for.
As for whether it can be used as a C1 or a C2, that’s entirely up to you and your individual algorithm.
Live Long and Prosper
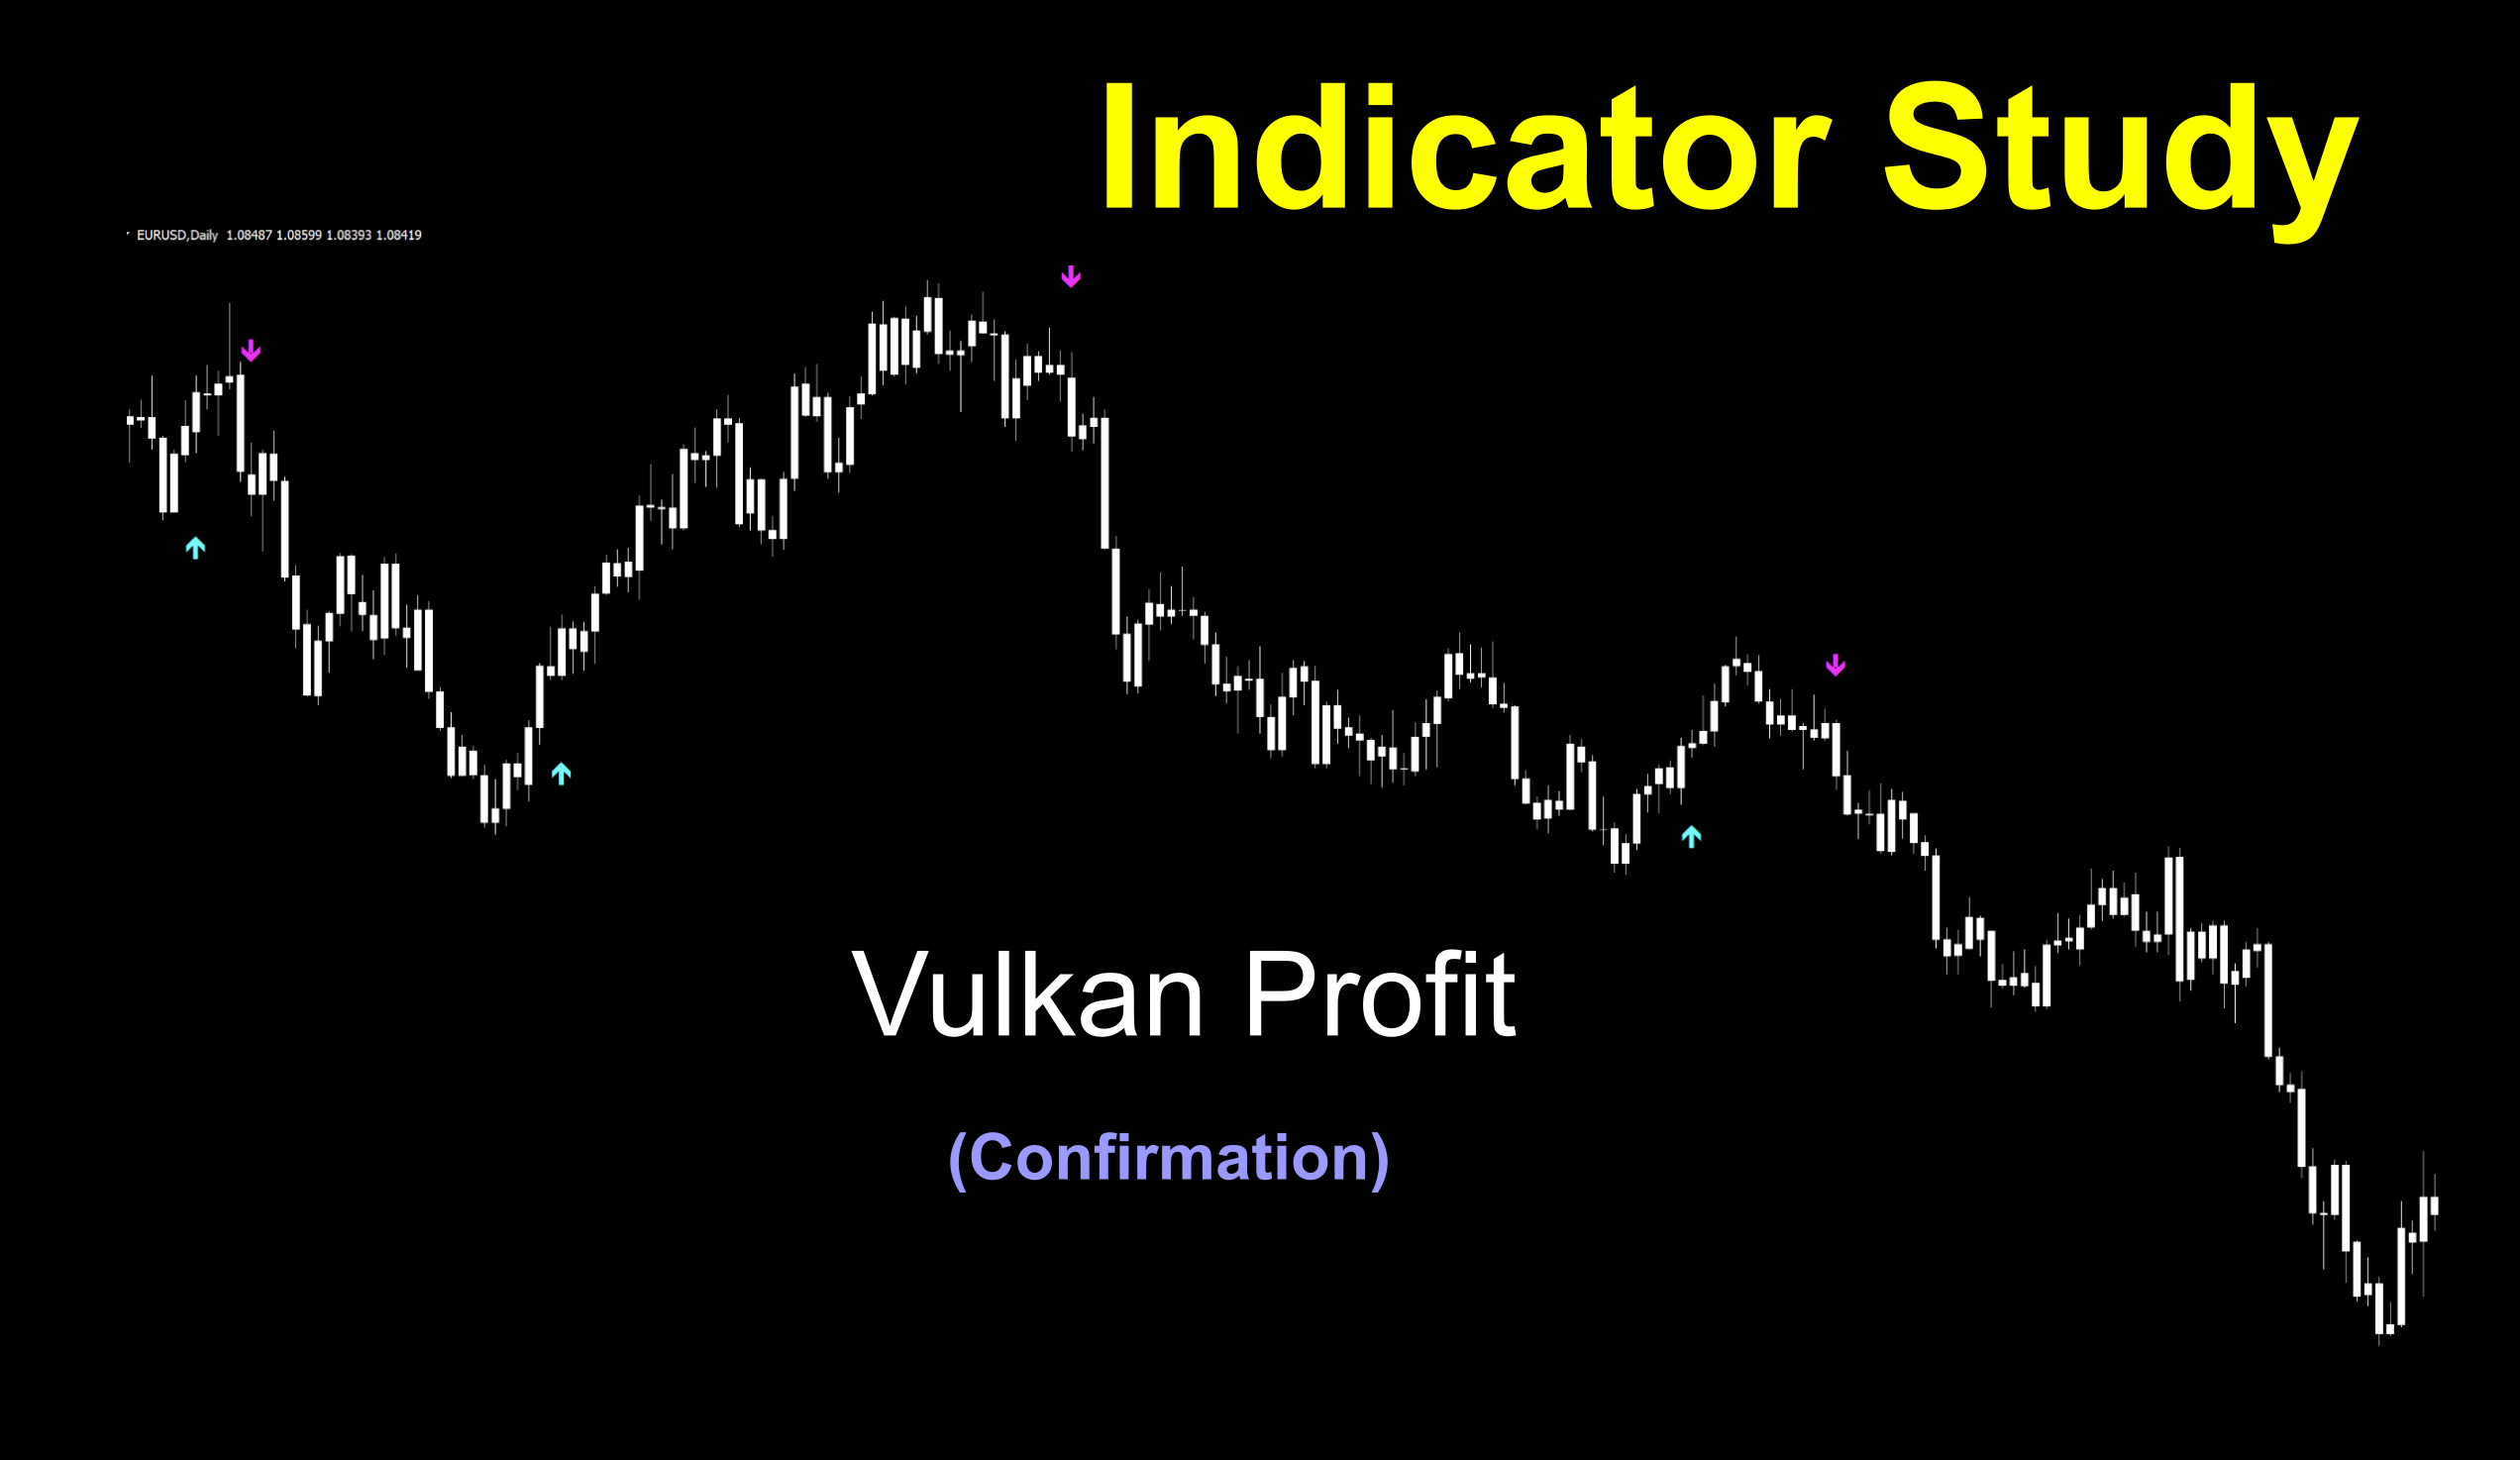
When we saw the title, we immediately went to “phasers on stun” and wondered what kind of indicator this might be. Granted, it’s not spelled exactly the same, but…semantics, right? This week’s indicator is called Vulkan Profit and as a profile first, it’s an arrow indicator, meaning that you only see red and blue arrows.
Easy Like Sunday Morning
No squiggly lines, no levels, no crosses, and no color changes. Pretty simple. For sure, this is one not included in the boxed set found on MT4 and definitely one we wanted to bring to you. Let’s raise an eyebrow (Trekkies will understand this…am I dating myself?) and press on.

Secret Agent…Person
Created by another mystery coder in 2016, trying to discover who actually created the indicator can be a bit of a challenge. This indicator was developed from an earlier arrow type indicator using a methodology called the “Sidus Method”.
You’ve Got Mail
Since we’ve added the new email address (stonehillindicator@gmail.com) anybody who believes they know who developed this indicator is welcomed to email us. We appreciate your contributions, and we’ll update the blog.
Simply, logical.
The Vulkan Profit indicator uses a series of different types of moving averages in concert to create the arrows. Sometimes just using the indicator without worrying about the underlying math just gives you that peaceful, easy feeling. Thankfully, the variables are labeled, so you’ll know what we’re changing.
Confirmation Indicator
As mentioned before, an arrow change provides the long and short signals. It can be used as a C1 or C2 indicator, and possibly as an exit indicator as well. Obviously this depends on how the indicators in your algorithm react with each other, and of course price. Do the work, you’ll thank us for it later.
Vector Me With an Arrow
In the screenshot below, we’ve changed the arrows from blue/red to aqua/magenta and increased the size from 2 to 5 (the maximum) for easier signal identification. Of course, price has been changed to white, so we can focus on what’s important, the indicator.
Settings
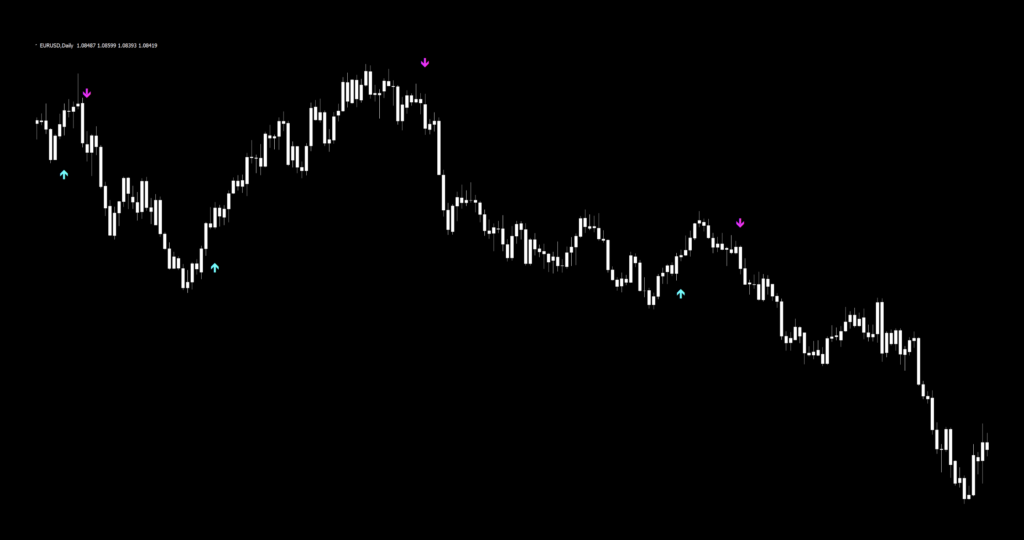
This indicator has a few variables in the settings window; however, we’re only going to concern ourselves with the four moving average settings. Below is the settings screen.
VP_WMA: The moving average variable that uses the other settings to calculate the arrows. The default value is 3.
SlowerLWMA: A linear weighted moving average used in the calculation of the VP moving average. The default value is 8.
FasterSidus EMA: The faster exponential moving average used in the calculation of the VP moving average. The default value is 18.
SlowerSidusEMA: The slower exponential moving average used in the calculation of the VP moving average. The default value is 28.
Advantages
* Colored arrows give you definite, easy to see indicators.
* May be used as an exit indicator depending on the rest of your algorithm.
How we use it
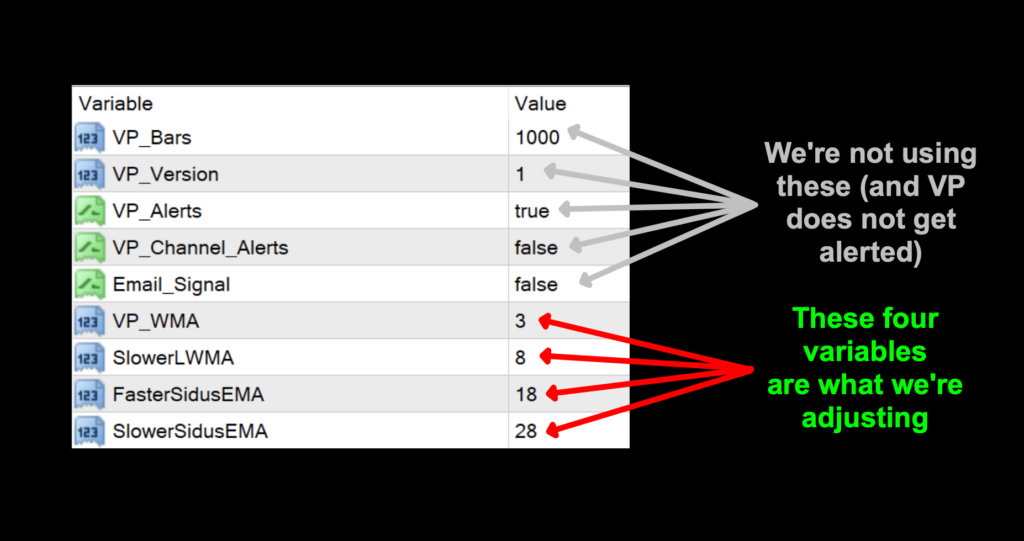
Long signal – When a blue arrow prints on the screen, entry is made on the open of the next period.
Short signal – When a red arrow prints on the screen, entry is made on the open of the next period.
Now that we know what we’re looking for, let’s see how the default settings do.
Other Settings
There are a few other settings which don’t actually affect the signals. They revolve around various alerts to give you notification. Use them as you please.
Sortir
French for exit, we wondered if this indicator could be used to exit a trade? We think it can…if the settings are right and price is reacting well to your algorithm. Ultimately, it’s up to you and the results of your testing. If it doesn’t mesh well with your system, or price isn’t playing nice, then try something else. You have the “power”!
Other Notes of Interest
There were a few questions on VP’s video that we wanted to address. We did some on-line research and conducted a few bench tests and could find no evidence of repainting. If you have proof of repainting please email us at stonehillindicator@gmail.com.
*** Update – after further review and research, we did discover isolated instances where the indicator “redrew” an arrow. This being said, we can only caution you when using this indicator.***
Additionally, the black dots are the indicator’s attempt to call trend continuations and reversals – something we do not use, or test for.
As for whether it can be used as a C1 or a C2, that’s entirely up to you and your individual algorithm.
Testing…Testing…Testing…
Remember, comprehensive analysis is strongly suggested, and we advocate backwards and forward testing indicators or systems prior to trading actual funds. We propose conducting your tests on the following pairs.
EUR/USD
AUD/NZD
EUR/GBP
AUD/CAD
CHF/JPY
CAD/SGD
If it doesn’t work on these 6 pairs, chances are it won’t work on other pairs. This is not an absolute, but we’ve found this rule is reliable in most cases.
The markets we test our indicators are the:
EUR/USD (Euro/US Dollar)
BTC/USD (Bitcoin/US Dollar)
XAU/USD (Gold/US Dollar)
SPX500 (S&P500 Index)
Timeframes and Results
In our initial test, we’ll run the Vulkan Profit indicator on the EUR/USD, BTC/USD, XAU/USD, and the SPX500 using the default settings across the daily and 4-hour timeframes on the MT4 strategy tester. We use the fast method of testing the indicator to get a general idea; however, you may also run the tick-by-tick data set for a more precise result (which takes considerably more time).
As No Nonsense Traders – and therefore Swing Traders, we will not examine shorter time frames in these studies. We will also run an additional test, using different values for the settings, to analyze which one may work better and examine the following results:
Total trades
Win/Loss ratio
ROI (return on investment)
There are other metrics included in the strategy tester report, which can be compared, but these three metrics provide the necessary gauge to make quick decisions as to the usefulness of a particular indicator and its settings.
Next, for comparison, we’ll explore the following;
Daily – 1 year
4-hour – 3 months
The reason exceptionally long (or short) testing periods are not included is due to changing market conditions, which might return irrelevant information. A balance of statistically significant data is necessary for accurate results.
And the Outcome…
Below are the spreadsheets illustrating the results from our tests.
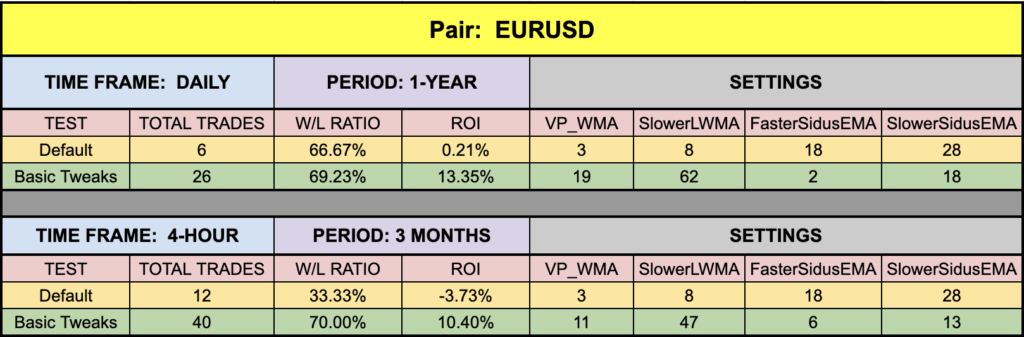
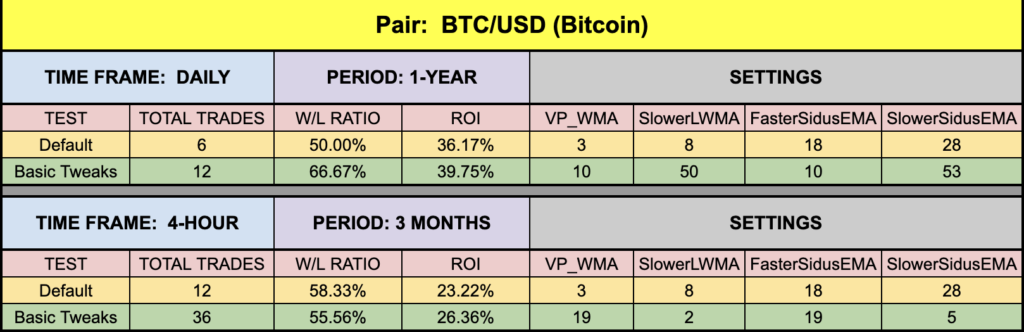
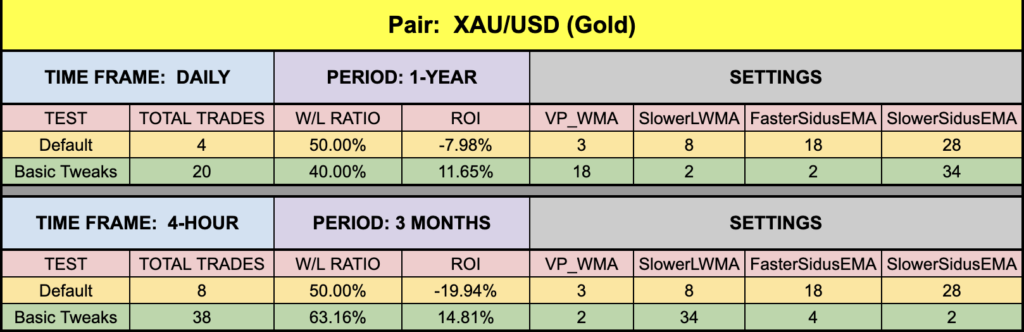
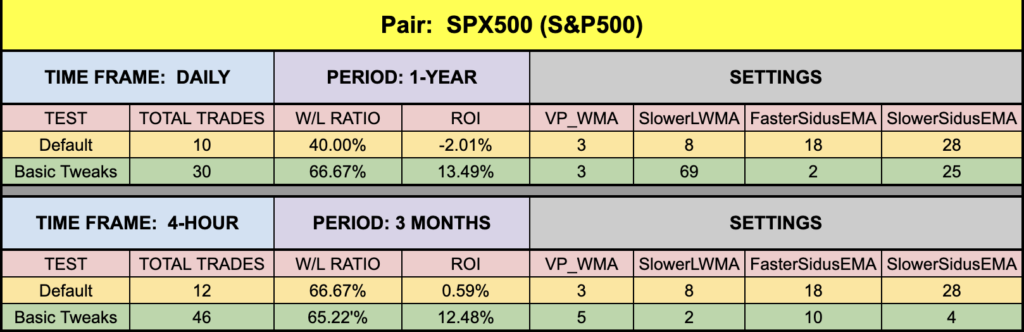
The green highlighted rows represent “basic tweaks” on the settings which returned better results. Are these the best? Not necessarily. Given that variables including testing date range and broker data are different from person to person, you may find better settings.
Not Bad At All
Overall, the results (even on the default settings…except for gold) are pretty good. With a few adjustments, this could definitely find a place in your traders’ tool box.
Trust In Yourself
Remember, the overall NNFX philosophy of taking profit, risk, and drawdown is that YOU are creating a system which YOU will be trading. Don’t let anybody else take that away from you. Part of the learning process is digging in and doing the work yourself. To learn more about these topics, check out the Advanced Course!
That being said, the results we post in these blogs should never be considered specific trading advice.
***Note: Remember, never use just this one indicator as your decision of whether to open or close a trade. It should be part of a system.
Money Management
If you are curious as to what money management is used on our tests; we have a certain way of determining wins and losses, which can be found in the Advanced Course. Our goal here is to determine how well the indicator reacts to price with respect to producing a long or short signal. Your system, with its risk profile, will dictate individual returns.
Resources
As we did with past indicator studies, we’ve made the Vulkan Profit indicator is available for download on our site from the indicator library. We will keep adding better indicators with each study for your use, at no charge. When you’re ready to get it, click HERE.
More to Come
There’s a lot more to come. We are excited to provide more trading tips in the near future. Sign up on our contacts page or subscribe to our YouTube channel. Receive early notifications as we continue to publish helpful, relevant, and informative Forex related material to support your quest to become a better trader.
And, now you are aware of another indicator that many traders don’t know or use.
Our only goal is to make you a better trader.
BTW – Any information communicated by Stonehill Forex Limited is solely for educational purposes. The information contained within the courses and on the website neither constitutes investment advice nor a general recommendation on investments. It is not intended to be and should not be interpreted as investment advice or a general recommendation on investment. Any person who places trades, orders or makes other types of trades and investments etc. is responsible for their own investment decisions and does so at their own risk. It is recommended that any person taking investment decisions consults with an independent financial advisor. Stonehill Forex Limited training courses and blogs are for educational purposes only, not a financial advisory service, and does not give financial advice or make general recommendations on investment.