International Origins
We’re spreading our wings and decided upon an indicator which finds its origins across the “pond” in France…in the 1800s. Fear not, this is not a 150-year-old indicator, but the math behind it does go back that far; and that’s pretty darn awesome. You’ll never find this on the MT4 platform and will need to look beyond the “boxed set”…and that’s the point. We aim to bring you those hidden gems, for free, and explained, so you’ll have more sharp tools for your trader’s toolbox. Let’s dig in!

Gars Intelligent
Edmond Laguerre was a mathematician whose primary works resided in areas of geometry and complex analysis, among other things. Very smart guy. Fun Fact; construction on the Eiffel Tower began a year after he died. We wonder what he would have thought about its geometry. Let’s fast-forward a bit…say, well over a century and see what a certain special somebody did with that research. That someone special is our hero, John Ehlers, who described an indicator in his 2004 book, “Cybernetic analysis of the stock and futures market” which used a price smoothing algorithm – and that became the Laguerre Indicator. By the way, “smoothing” is a simple term to describe filtering out market noise without sacrificing signals.
Coding the Math
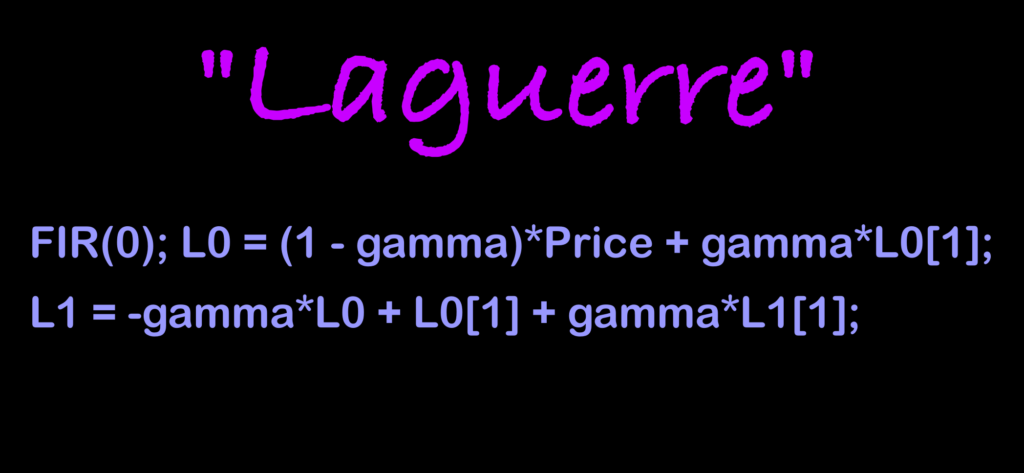
The formula behind the indicator is noted below.
For Our Coding Friends
If you’re a coder and want to embark on a weekend project, here is the EasyLanguage code for a 4-element Laguerre filter. My hats off to you…I’ll just use the indicator, thank you.
Inputs: Price((H+L)/2),
gamma(.7);
Vars: L0(0),
L1(0),
L2(0),
L3(0),
Filt(0)
FIR(0);
L0 = (1 – gamma)*Price + gamma*L0[1];
L1 = -gamma*L0 + L0[1] + gamma*L1[1];
L2 = -gamma*L1 + L1[1] + gamma*L2[1];
L3 = -gamma*L2 + L2[1] + gamma*L3[1];
Filt = (L0 + 2*L1 + 2*L2 + L3) / 6;
FIR = (Price + 2*Price[1] + 2*Price[2] + Price[3]) / 6;
Plot1(Filt, “Filt”);
Plot2(FIR, “FIR”);
Trends are Where it’s At
We’ve been told that this indicator is an excellent trend tool. New and experienced traders like it because it has the distinct ability to highlight market cycles better than most of the indicators found on the MT4 platform because it can point out start and ends of trends. We’ll see, right?
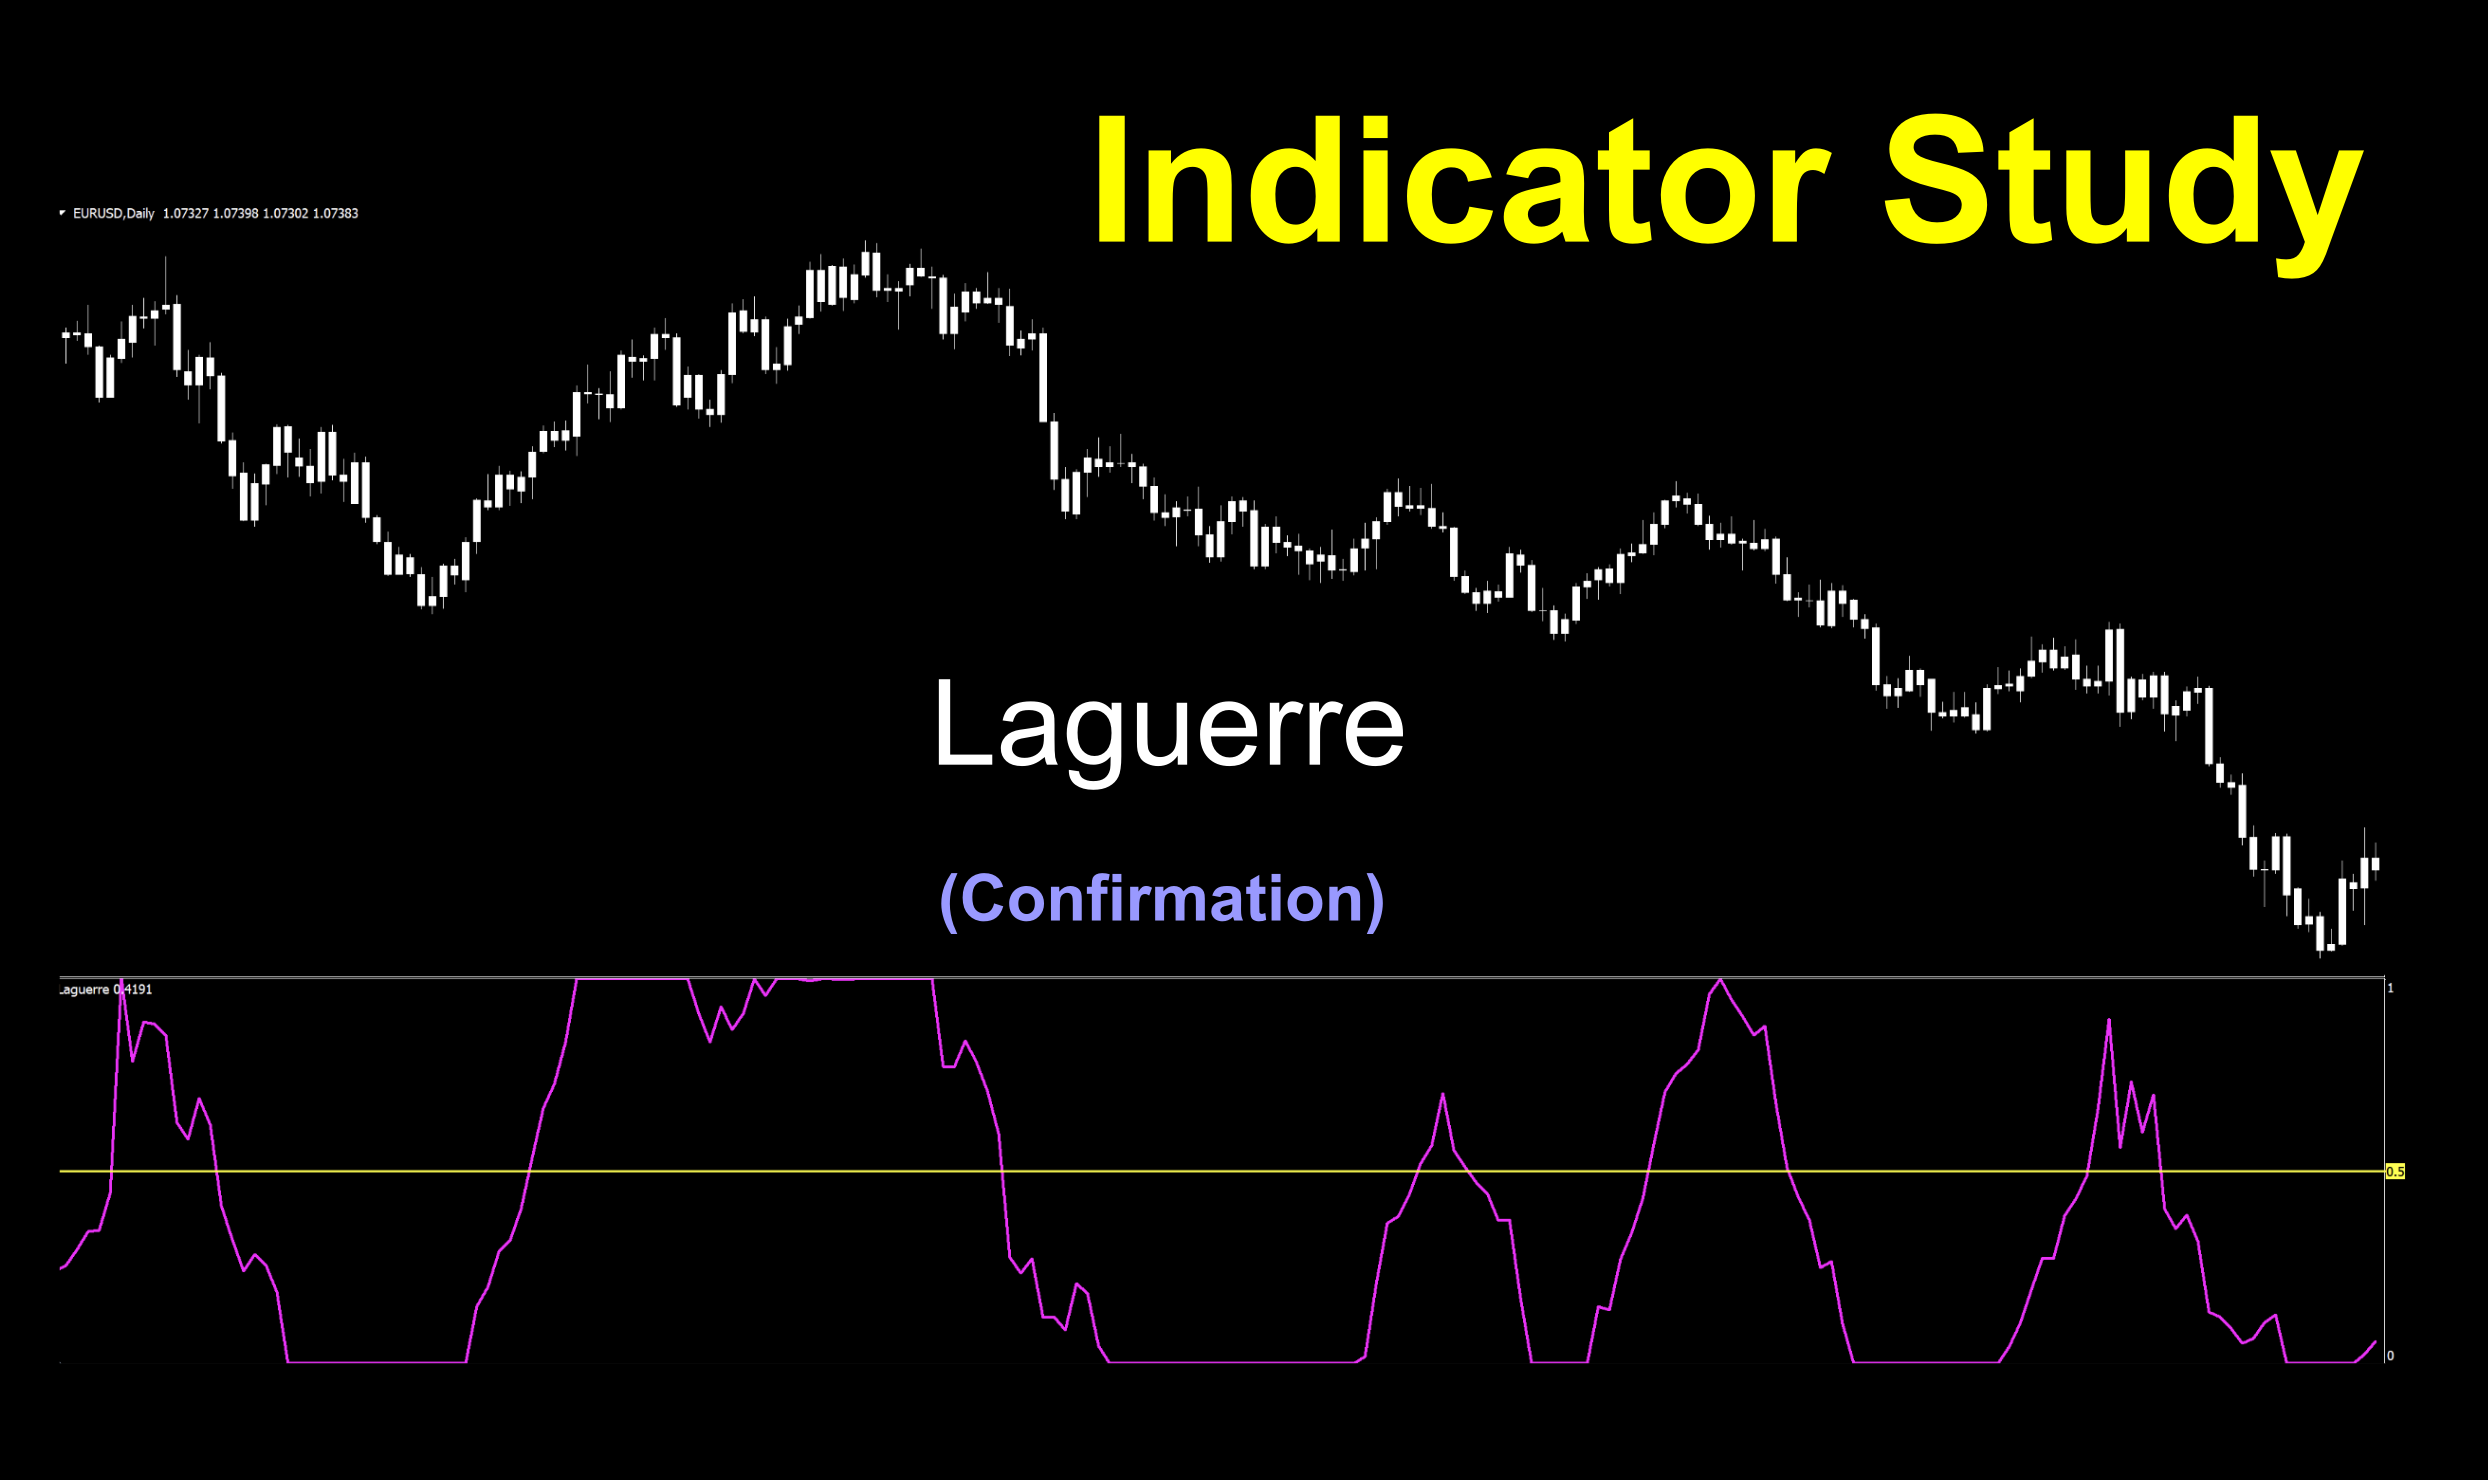
Confirmation Indicator
This indicator falls into the category of an oscillating mid-line cross, sometimes called a zero-cross…but in this particular instance the midline is, 0.5 and finds itself below your chart and can serve as either your C1 or C2, depending on what your second indicator is.
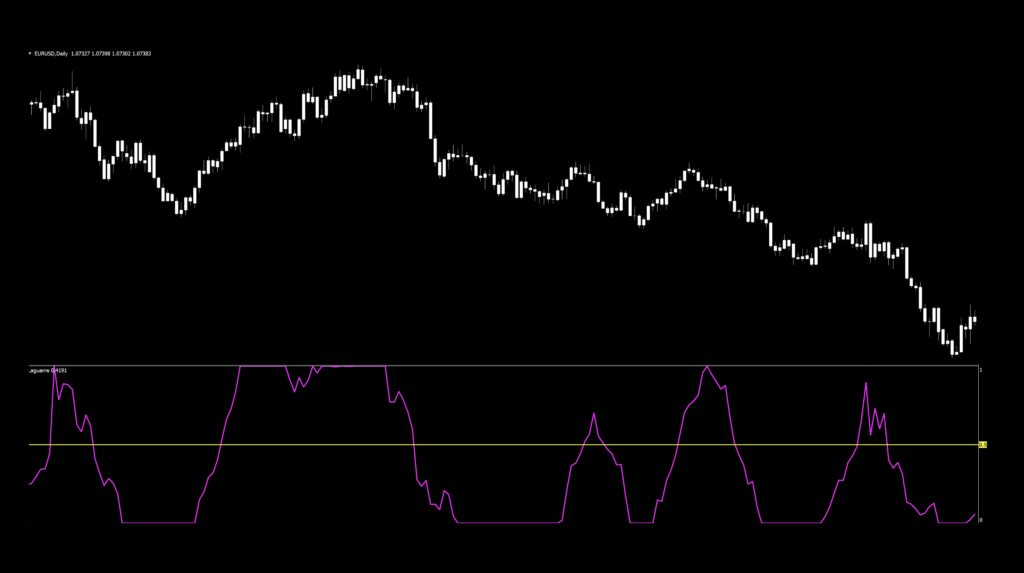
Bright and Cheery
In the screenshot below, we’ve thickened up the line which is already a nice bright magenta, but we added the midline to give us our place to take signals. We’ll go through a couple of screenshots to help you set it up. As mentioned, you won’t find this in the default listing on the MT4 platform…and price candles are changed to white to remove price bias, so we can concentrate on what’s important.
Plotting the Midline
The first thing we’ll do is call up the settings menu and click on the “levels” tab to remove the 0.8 and 0.2 levels.
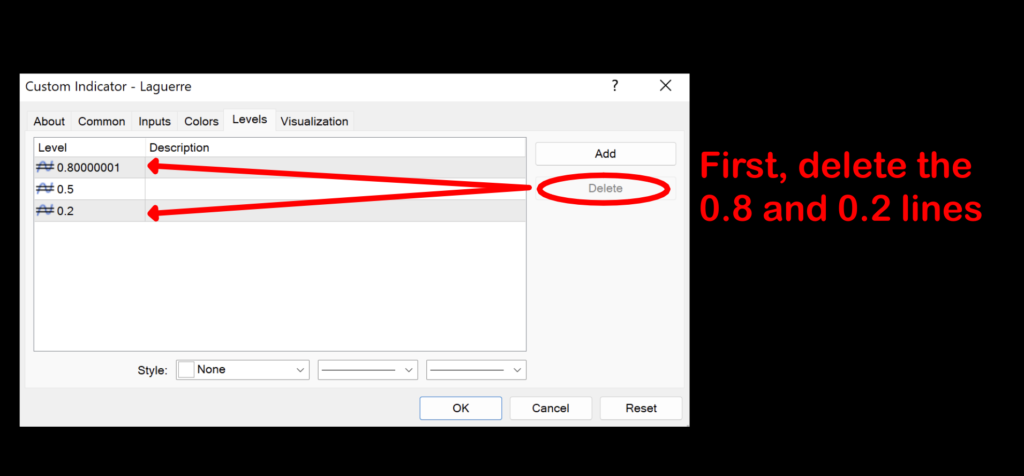
Then, we’ll color the remaining 0.5 line yellow.
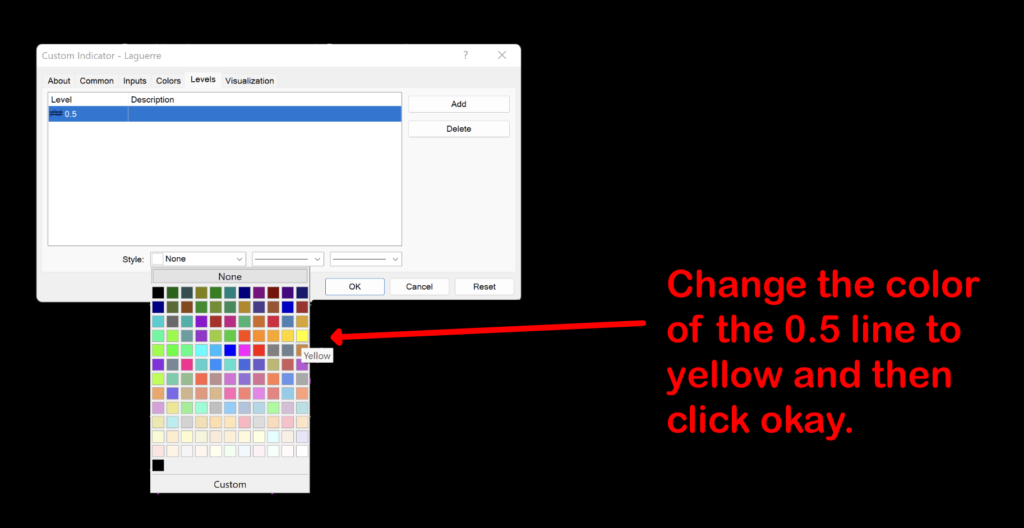
Don’t forget to thicken up the signal line if you want. We chose “4” for our example. It makes it easier to see.
Settings
There is only one variable, with a narrow range, which makes this an easy indicator to adjust.
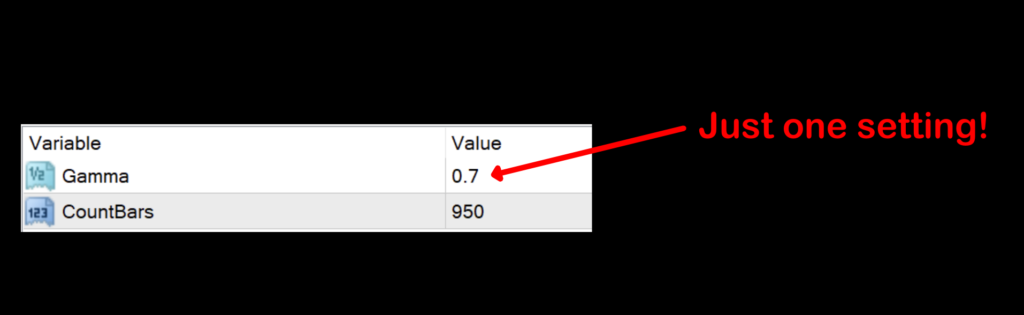
Gamma: This setting is the coefficient for calculating the level of the indicator. The higher the value, the smoother the line will be. The default setting is 0.7.
CountBars: The number of periods the indicator will look back for plotting purposes. The default setting is 950 which is plenty for our purposes.
Slim Pickings
We found during our testing that the effective range was between 0.1 and 0.9. No significant results were found over 0.9…so testing this should fairly quick and easy.
Advantages
* One Level Cross creates easy to identify signals.
* Narrow testing across one variable.
* Smooths out market data.
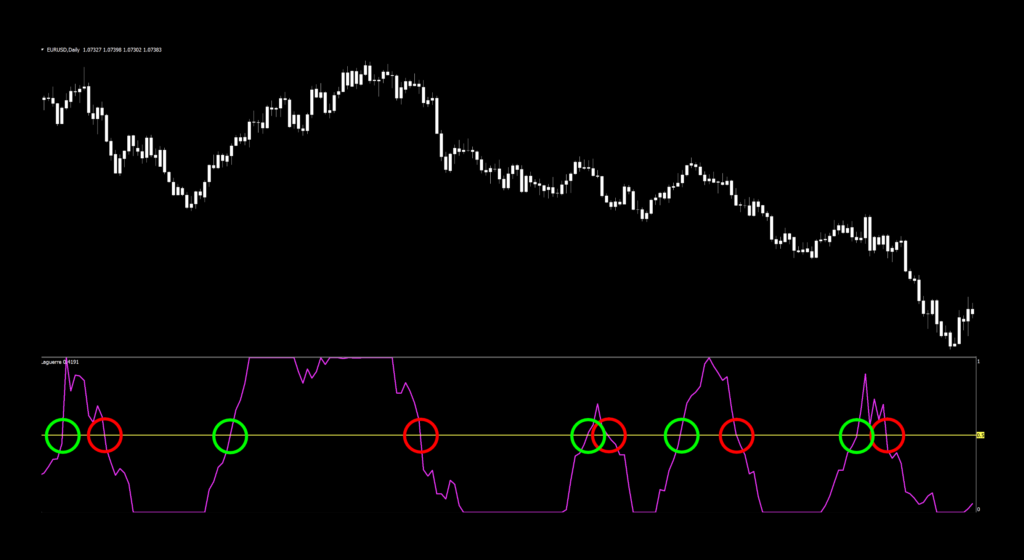
How We Use It
Long signal – When the red signal line crosses above the mid-line, the entry occurs on the open of the next candle.
Short signal – When the red signal line crosses below the mid-line, the entry occurs on the open of the next candle.
Let’s take a look at a marked up chart to see what kind of signals were generated using the default settings.
You Don’t Say
There are mentions where this indicator may be used for predicting market reversals by using amplitude (distance from the mid-line) and the line’s relationship with other levels. This attempts to foretell overbought/oversold levels or “turns” in the market. However, this is guessing, which is purely subjective. Our opinion is that it’s better to take more quantitative signal than try to guess when price will change direction.
Testing…Testing…Testing…
Remember, comprehensive analysis is strongly suggested, and we advocate backwards and forward testing indicators or systems prior to trading actual funds. We propose conducting your tests on the following pairs.
EUR/USD
AUD/NZD
EUR/GBP
AUD/CAD
CHF/JPY
CAD/SGD
If it doesn’t work on these 6 pairs, chances are it won’t work on other pairs. This is not an absolute, but we’ve found this rule is reliable in most cases.
The markets we test our indicators are the:
EUR/USD (Euro/US Dollar)
BTC/USD (Bitcoin/US Dollar)
XAU/USD (Gold/US Dollar)
SPX500 (S&P500 Index)
Timeframes and Results
In our initial test, we’ll run the Laguerre indicator on the EUR/USD, BTC/USD, XAU/USD, and the SPX500 using the default settings across the daily and 4-hour timeframes on the MT4 strategy tester. We use the fast method of testing the indicator to get a general idea; however, you may also run the tick-by-tick data set for a more precise result (which takes considerably more time).
As No Nonsense Traders – and therefore Swing Traders, we will not examine shorter time frames in these studies. We will also run an additional test, using different values for the settings, to analyze which one may work better and examine the following results:
Total trades
Win/Loss ratio
ROI (return on investment)
There are other metrics included in the strategy tester report, which can be compared, but these three metrics provide the necessary gauge to make quick decisions as to the usefulness of a particular indicator and its settings.
Next, for comparison, we’ll explore the following;
Daily – 1 year
4-hour – 3 months
The reason exceptionally long (or short) testing periods are not included is due to changing market conditions, which might return irrelevant information. A balance of statistically significant data is necessary for accurate results.
And the Outcome…
Below are the spreadsheets illustrating the results from our tests.
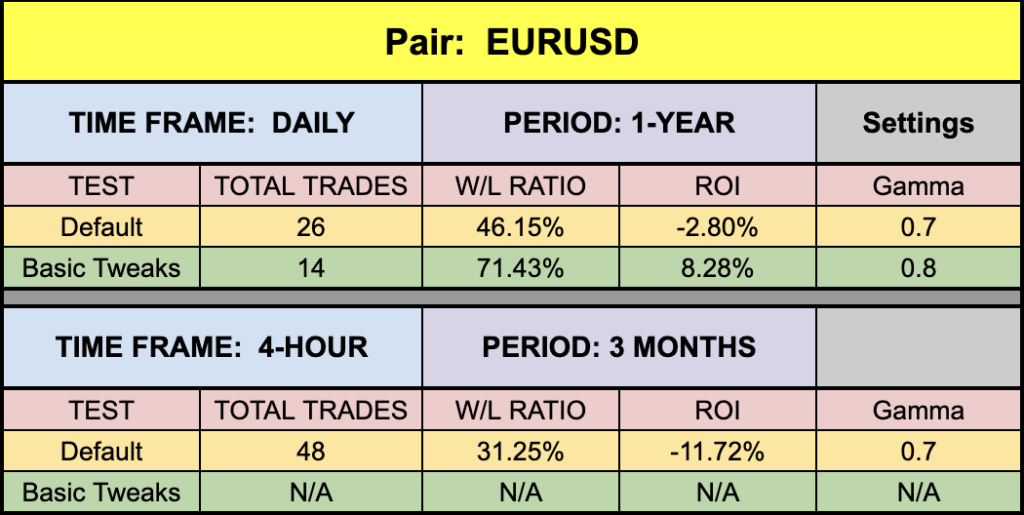
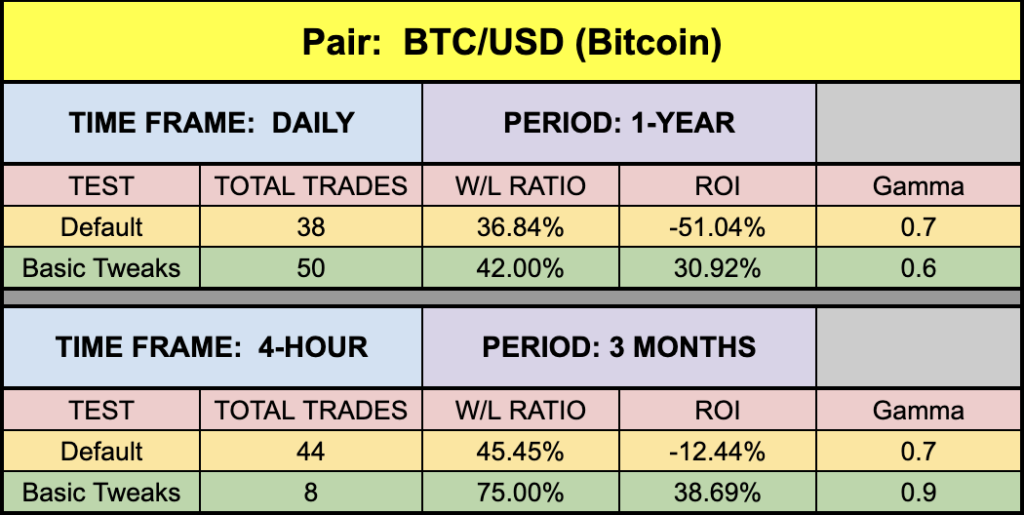
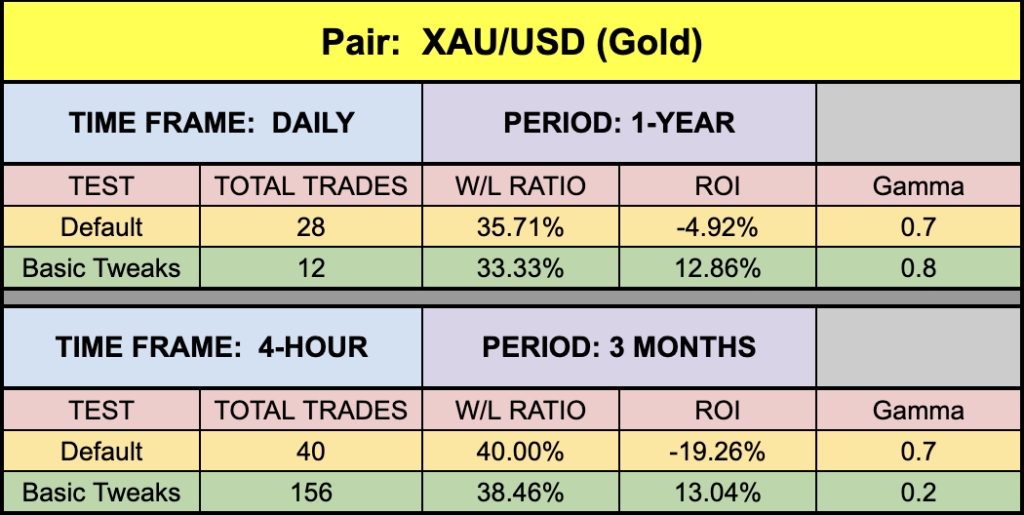
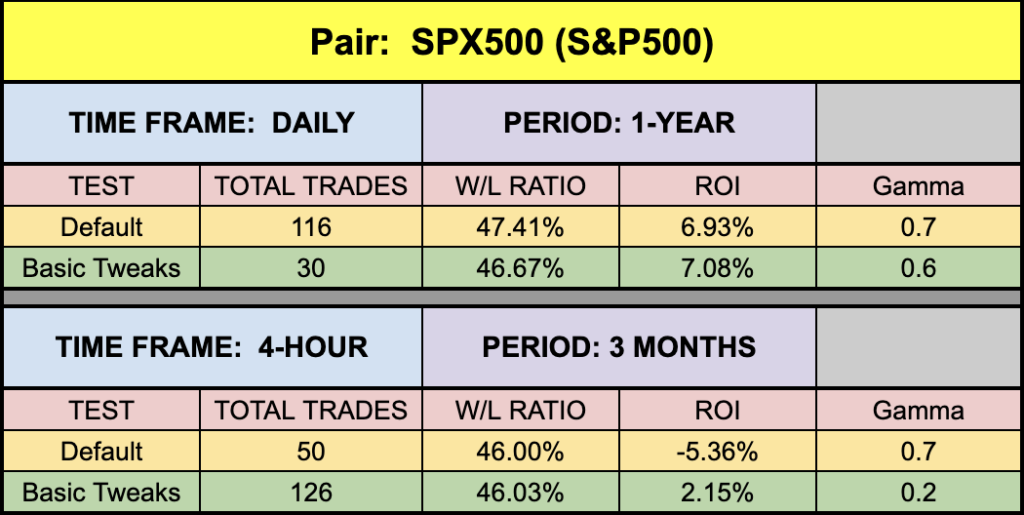
The green highlighted rows represent “basic tweaks” on the settings which returned better results. Are these the best? Not necessarily. Given that variables including testing date range and broker data are different from person to person, you may find better settings.
Trust In Yourself
Remember, the overall NNFX philosophy of taking profit, risk, and drawdown is that YOU are creating a system which YOU will be trading. Don’t let anybody else take that away from you. Part of the learning process is digging in and doing the work yourself. To learn more about these topics, check out the Advanced Course!
That being said, the results we post in these blogs should never be considered specific trading advice.
***Note: Remember, never use just this one indicator as your decision of whether to open or close a trade. It should be part of a system.
Money Management
If you are curious as to what money management is used on our tests; we have a certain way of determining wins and losses, which can be found in the Advanced Course. Our goal here is to determine how well the indicator reacts to price with respect to producing a long or short signal. Your system, with its risk profile, will dictate individual returns.
Resources
As we did with past indicator studies, we’ve made the Laguerre indicator is available for download on our site from the indicator library. We will keep adding better indicators with each study for your use, at no charge. When you’re ready to get it, click HERE.
More to Come
There’s a lot more to come. We are excited to provide more trading tips in the near future. Sign up on our contacts page or subscribe to our YouTube channel. Receive early notifications as we continue to publish helpful, relevant, and informative Forex related material to support your quest to become a better trader.
And, now you are aware of another indicator that many traders don’t know or use.
Our only goal is to make you a better trader.
BTW – Any information communicated by Stonehill Forex Limited is solely for educational purposes. The information contained within the courses and on the website neither constitutes investment advice nor a general recommendation on investments. It is not intended to be and should not be interpreted as investment advice or a general recommendation on investment. Any person who places trades, orders or makes other types of trades and investments etc. is responsible for their own investment decisions and does so at their own risk. It is recommended that any person taking investment decisions consults with an independent financial advisor. Stonehill Forex Limited training courses and blogs are for educational purposes only, not a financial advisory service, and does not give financial advice or make general recommendations on investment.