Back on Track
After a lot of lab hours and many days working to get our first paid indicator to market, we’re back in the free lane with one for the profile series. Mind you, we are currently knee deep creating new and improved trading products for you magnificent traders, so be sure to keep checking in here and with VP to find out when they’re released. After all, time is money and the sooner you can be trading for profit, the sooner your lifestyle can change…and who doesn’t want a change for the better?

It’s Just a Name
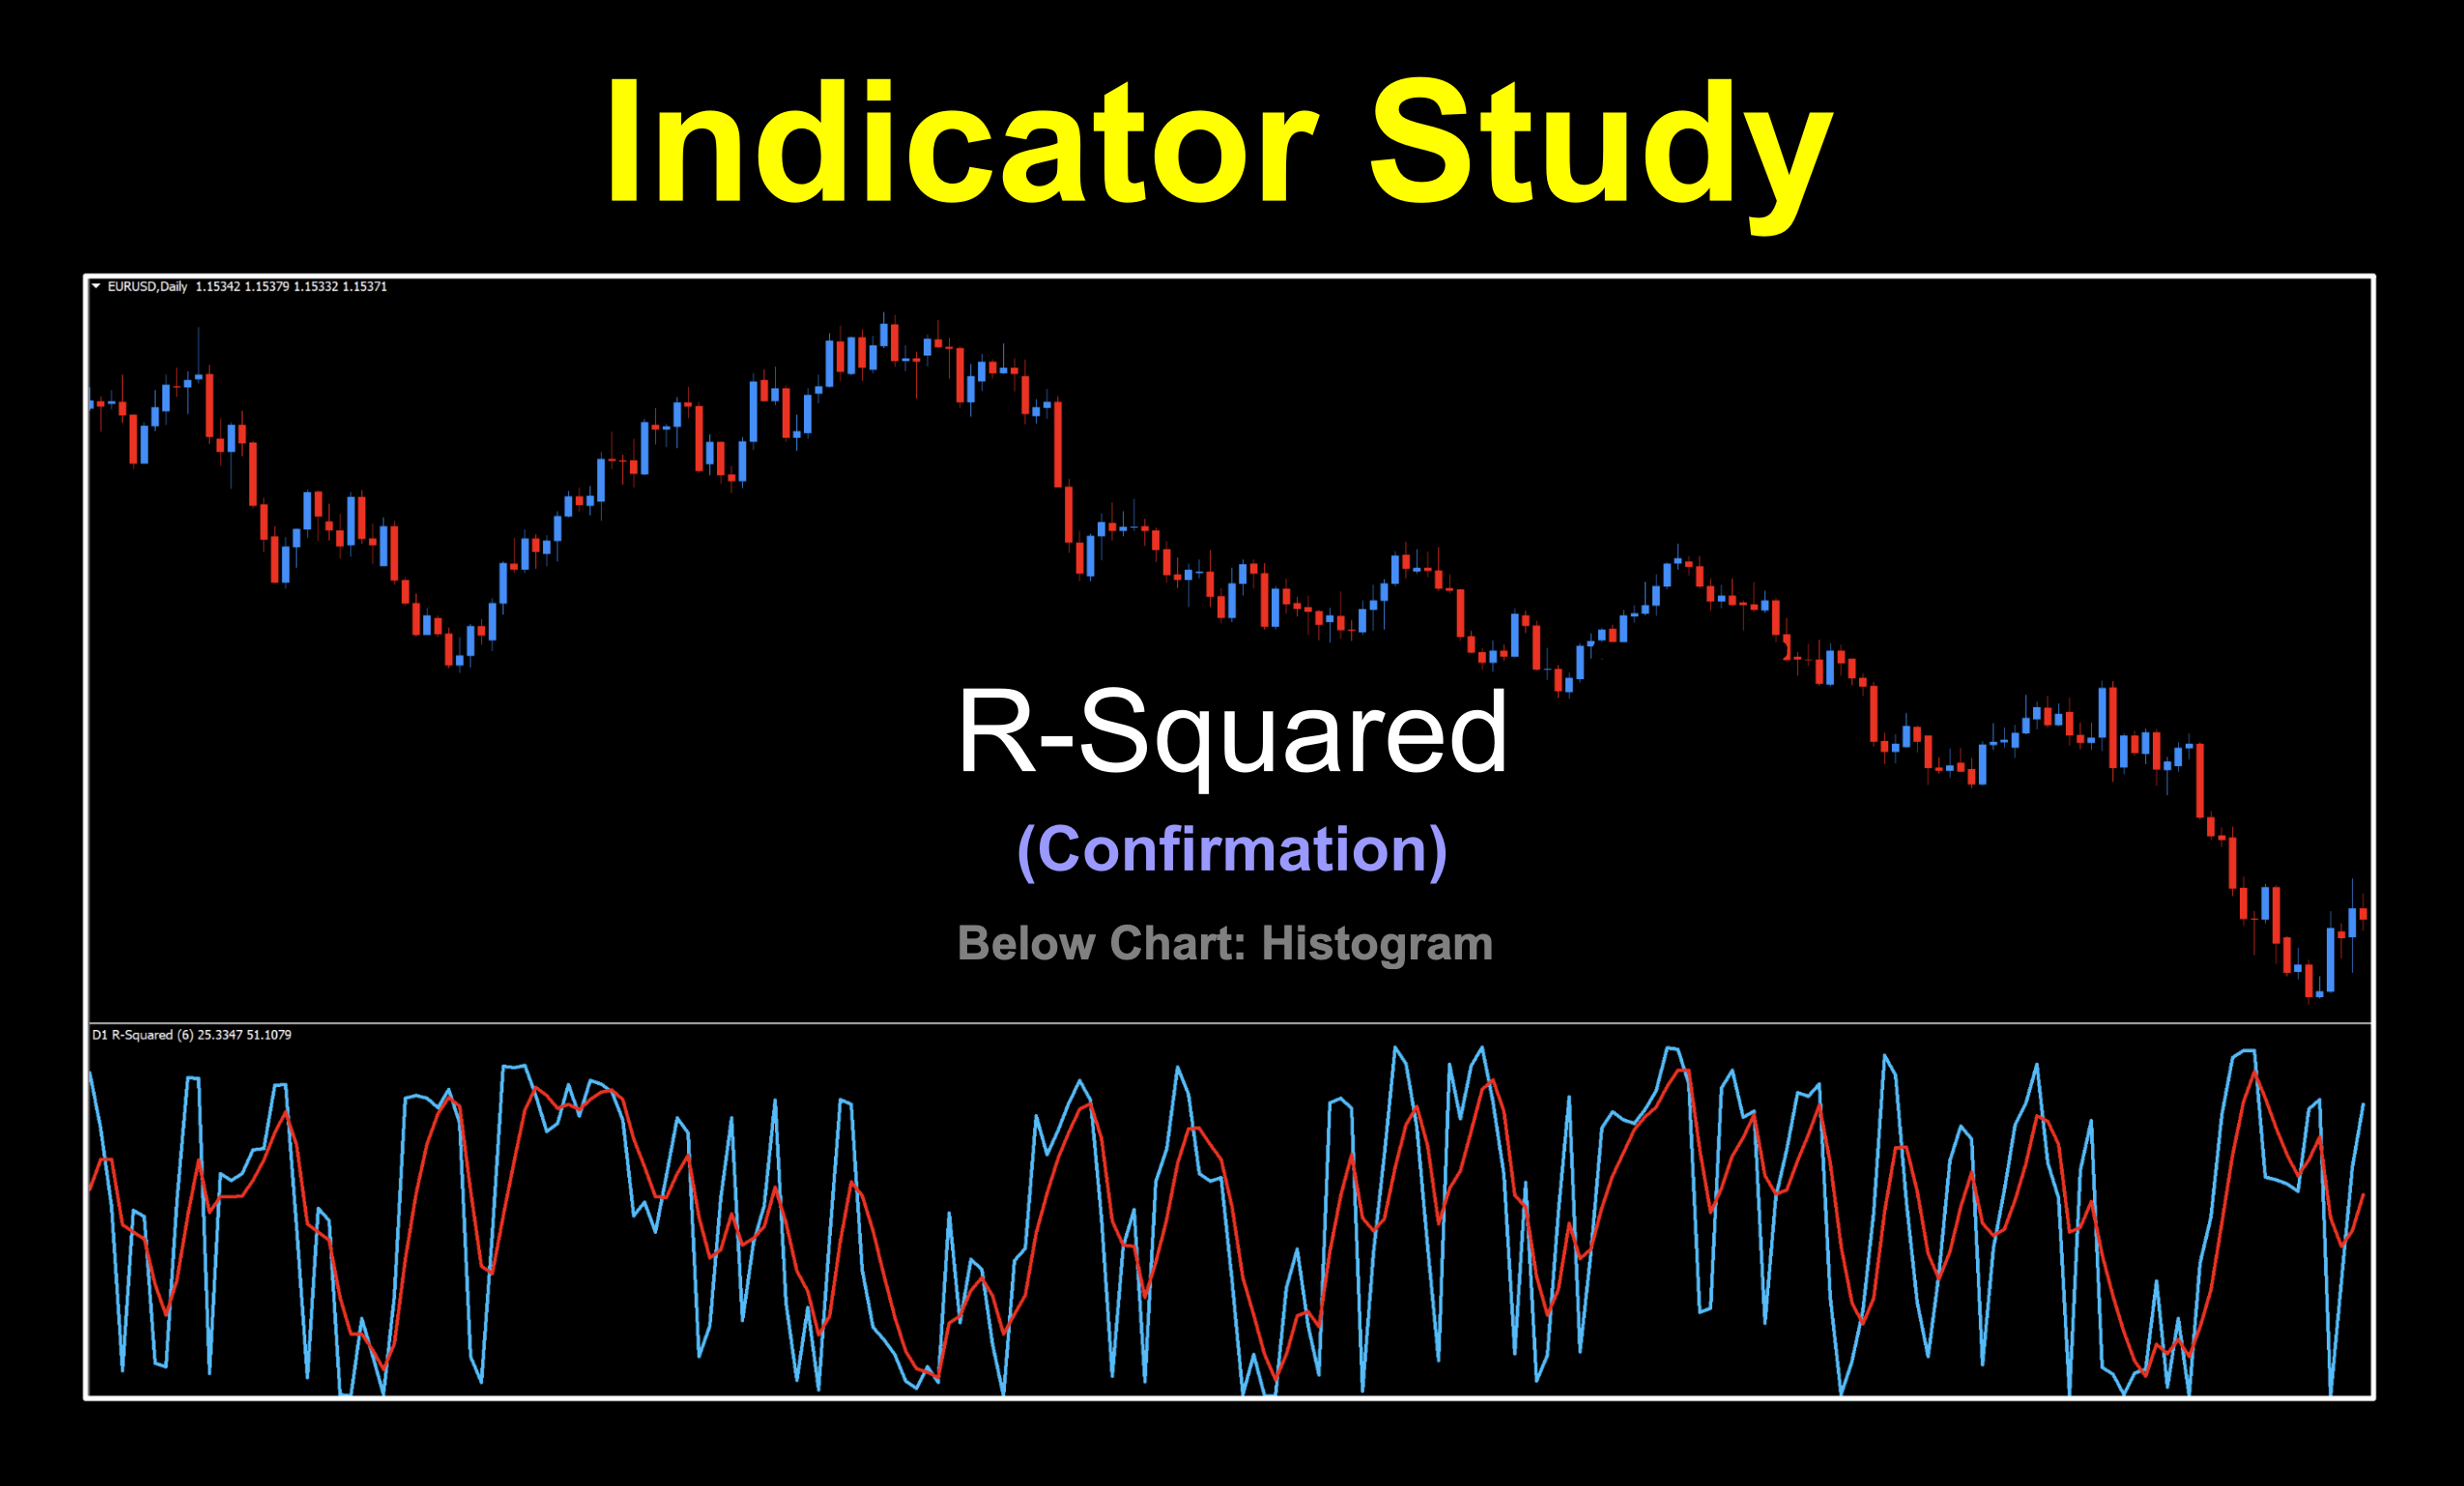
The abbreviated name we chose for this profile is to keep things simple. We’re just calling it “R-Squared” but it’s full birth certificate name is “R-Squared Automatic Higher Time Frame version 1.1”. The main breakdown is an R-Squared (Coefficient of Determination) indicator with a moving average signal line. It actually reminds me of an old punchline:
The Setup: “You can call me brilliant, you can call me handsome, you can call me the King of the Universe…”
The Punchline: “…but just don’t call me late for dinner.”
As for it’s “born on date”, that’s a bit of mystery. We suspect (through some research) that the original coding was scripted between 2009 and 2013 with some minor updates along the way (for the 1.1 version) before it was released to us in 2019.
Dig Deeper
You know how we operate so let’s take a closer look at this fascinating tool. This indicator calculates the R-squared value (also known as the coefficient of determination) for price data over a rolling period. It then applies a moving average to the R-squared values, creating a smoothing effect that helps reduce noise in the signals.
Got The Time
The indicator also supports multi-timeframe (MTF) functionality. This includes automatic selection of higher timeframes and the option to interpolate (insert) higher timeframe values onto lower timeframe bars. For our purposes, however, we’ll simply leave the setting on “Current Time Frame.”
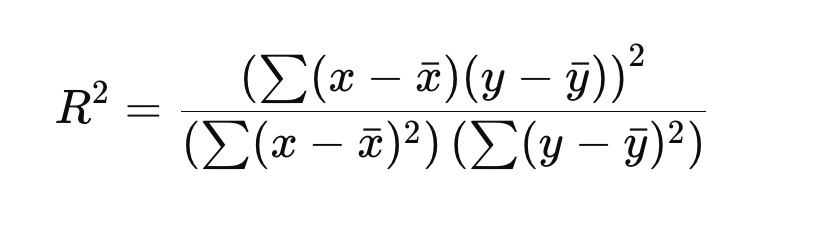
Core Concept
The core R² formula code calculates the blue line below:
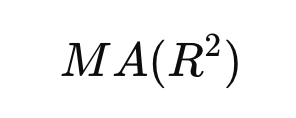
The second red dotted signal line is simply:
It’s Fast
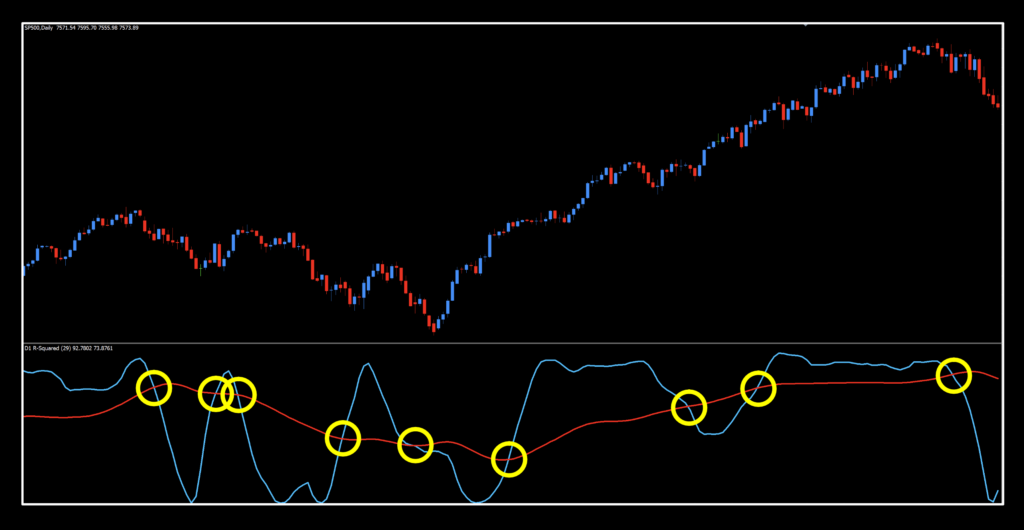
Looking at the default chart, you can see that the signals come pretty quickly. Let’s take a look and see what it looks like before going on.
At first glance, it looks like absolute chaos. Let’s just calm down and take a beat. Remember, when coders publish indicators, they may assign values with no particular reasons behind their choices. It’s fine. In fact, it’s very rare that the default settings will be acceptable anyway. Coders aren’t necessarily traders, and that’s okay.

Besides, not everybody looks for the same kind of tool to get the job done. To some, this might cause anxiety. To others, they smile knowing they might make a killing.
Settings
Let’s go take a look at the settings and see what’s going on before moving forward with our investigation.
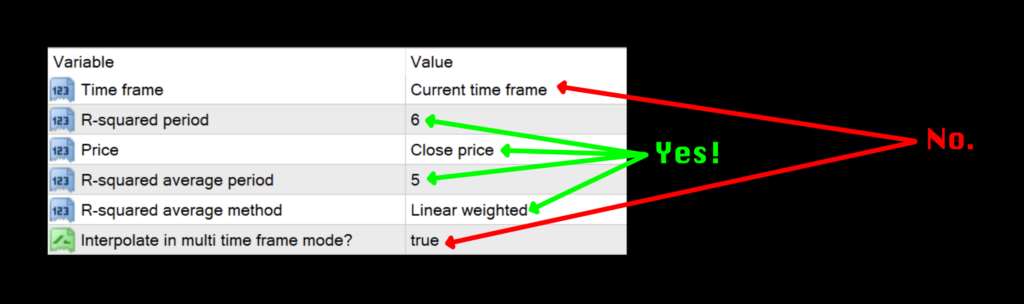
Time frame: Time frame used for the calculation. Current chart, a fixed time frame (M1 – MN1), or automatic higher time frames. The default frame is “Current time frame”. Just leave this alone.
R-squared period: Lookback window for R². Smaller numbers are faster/noisier; larger numbers are smoother/slower. The default value is 6.
Price: Applied price. 0=close, 1=open, 2=high, 3=low, 4=median, 5=typical, 6=weighted. The default setting is 0-close.
R-squared average period: Moving Average period applied to the R² series and smooths the blue line. The default value is 5.
R-squared average method: Moving Average type: 0-SMA, 1-EMA, 2-SMMA, 3-LWMA and controls responsiveness of the smoothing line. The default value is 0-SMA.
Interpolate in multi time frame mode?: In MTF mode, fill lower time frame bars between higher time frame values. Default value is true and we suggest leaving it.
Daily Maintenance
Remember, once you’re ready to perform daily maintenance on your trades during the last 20–30 minutes of the trading day (1700 New York time), you’ll be presented with one of four options.
- Opening a trade.
- Closing a trade
- Maintaining a trade; i.e.
- Moving a stop loss level.
- Exiting a trade.
- Taking a pass (nothing to do).
Long: When the blue line crosses and closes over the red line.
Short: When the red line crosses and closes over the green line.
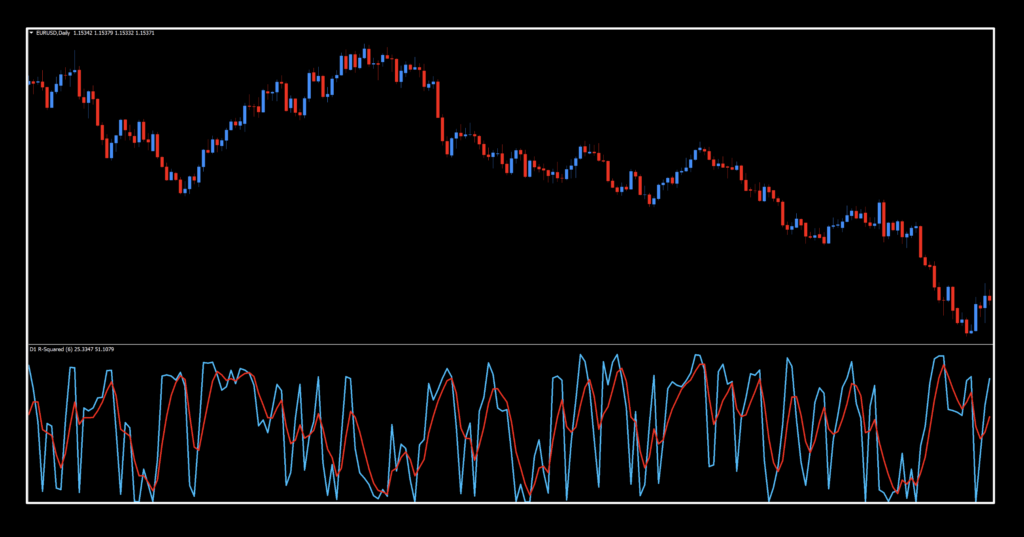
Slow and Low
Normally, we display the chart on the default settings but as noted in the image above, it’s just too busy for us to clearly define the settings and frankly, we’d probably never use the default settings. That being the case, we made some adjustments.
That’s better. You can see that the blue R² still moves pretty quickly and that the red moving average of the R² series geared down makes for some better signals.
Get Them Numbers
Below are the numbers from our testing sessions. Take a close look and we’ll see you at the bottom.
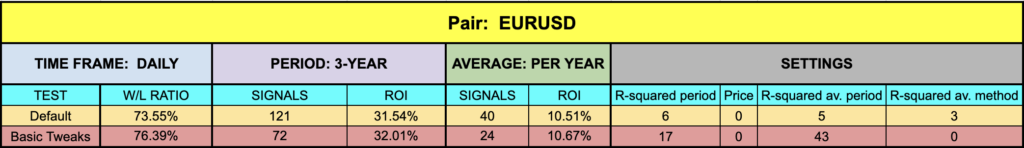
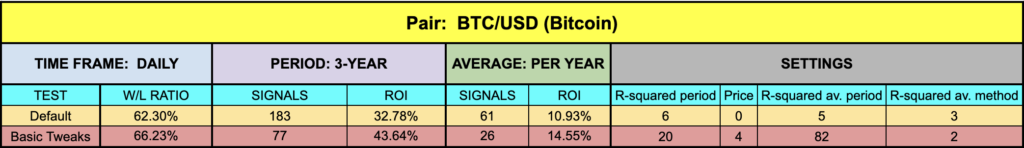

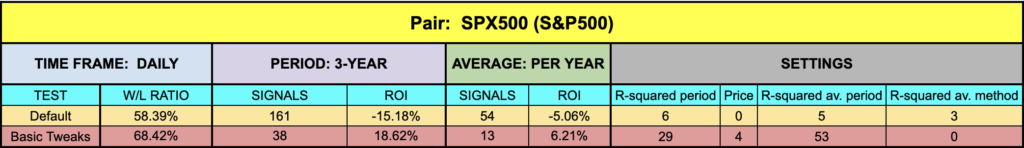
Wild Stuff
Looking back at the numbers, we actually were pleasantly surprised at some of the results but some of the default settings were certainly in the toilet. Except for the EURUSD. What’s up with that? We haven’t seen numbers in that range for some time. XAU’s default values are almost comical. You could reverse those and do quite well, although we don’t recommend that kind of contrarian trading.
Resources
You’ll find this oddball in the indicator library for free HERE and it’ll have “NEW” in red to alert you to its location. Make sure you’re subscribed to the Stonehill Forex YouTube channel so you can see this oddity in action. The Advanced NNFX Course is HERE to help fast track your trading career so you can cut your learning time in a fraction of conventional methods.
Our only goal is to make you a better trader.
*Our published testing results are based on money management strategies employed by the NNFX system and depend on varying external factors, which may be different between individuals and their specific broker conditions. No guarantee, trading recommendations, or other market suggestions are implied. Your results and subsequent trading activities are solely your own responsibility.
BTW — Any information communicated by Stonehill Forex Limited is solely for educational purposes. The information contained within the courses and on the website neither constitutes investment advice nor a general recommendation on investments. It is not intended to be and should not be interpreted as investment advice or a general recommendation on investment. Any person who places trades, orders or makes other types of trades and investments etc. is responsible for their own investment decisions and does so at their own risk. It is recommended that any person taking investment decisions consults with an independent financial advisor. Stonehill Forex Limited training courses and blogs are for educational purposes only, not a financial advisory service, and does not give financial advice or make general recommendations on investment.