What Happened
Back at the end of 2024, $EVZ (the EUR/USD Volatility Index) appeared to stop trading, which caused some confusion. In reality, it wasn’t suspended for any serious or negative reason. There were no compliance issues, financial trouble, or regulatory problems behind it. What likely happened instead was something much more routine such as a temporary trading halt, or low trading activity due to holidays or timing around announcements. This made it looked like trading just “stopped,” on charts or broker apps.
What It Was
The “Euro VIX” measures the market’s 30-day expectation of volatility for the EUR/USD exchange rate. It was calculated by analyzing options pricing on the Invesco CurrencyShares Euro Trust (FXE) ETF, reflecting investor sentiment regarding future Eurozone economic and political risks. We wrote a blog on it back in September 2021 called “$EVZ (EURO FX VIX): Pre-trading tool” and you can read it HERE.
How We used It
The short version is that we used it to gauge how much interest and volatility was available to us in the Forex markets. Our baseline number was “8”. North of that number was great and anything below it was considered a dead market. At some point, that benchmark was lowered a bit (7) but the overall guideline remained. If the number fell to the “5ish” area, then a different approach was necessary as explained in the “Trading Dead Markets” video that VP put out…which is accessible via the blog.
Was It Replaced
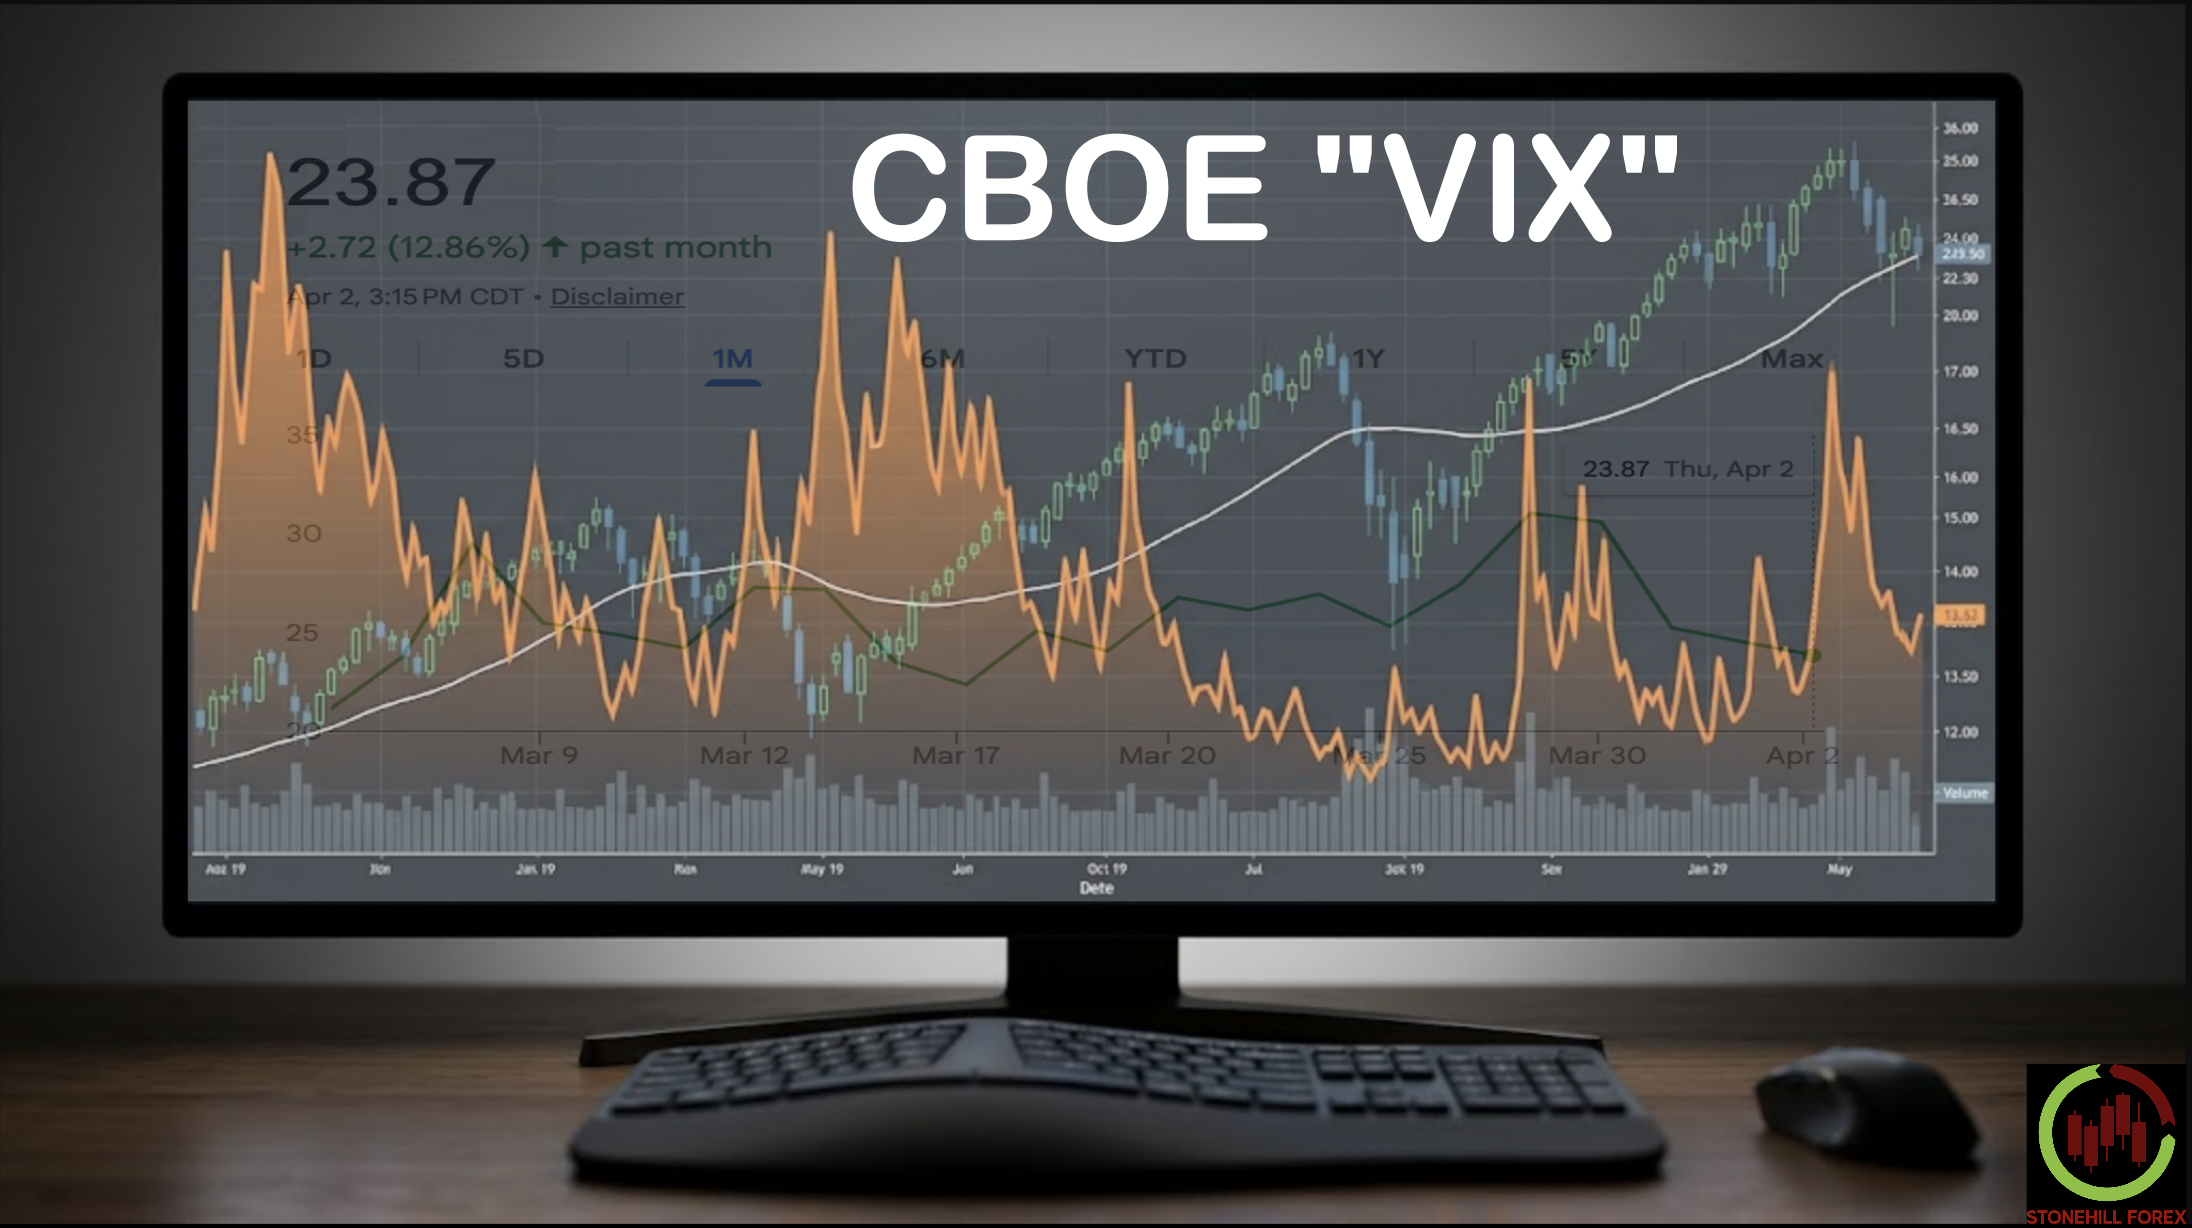
There really wasn’t a product which directly replaced it and we’ve reached out to community for assistance. Unfortunately, there really weren’t any credible responses, so we starting digging ourselves. What we settled on was the VIX, or officially called the CBOE (Chicago Board Options Exchange) Volatility Index. It is often called the…
FEAR GAUGE
What gauge is it referring to? Why, the fear of the stock market. It measures the market’s expectation of volatility (how much prices will swing) over the next 30 days, based on options prices on the S&P 500.

Benchmark Values
At first glance, it’s just numbers. Below is a snapshot of what you’d see.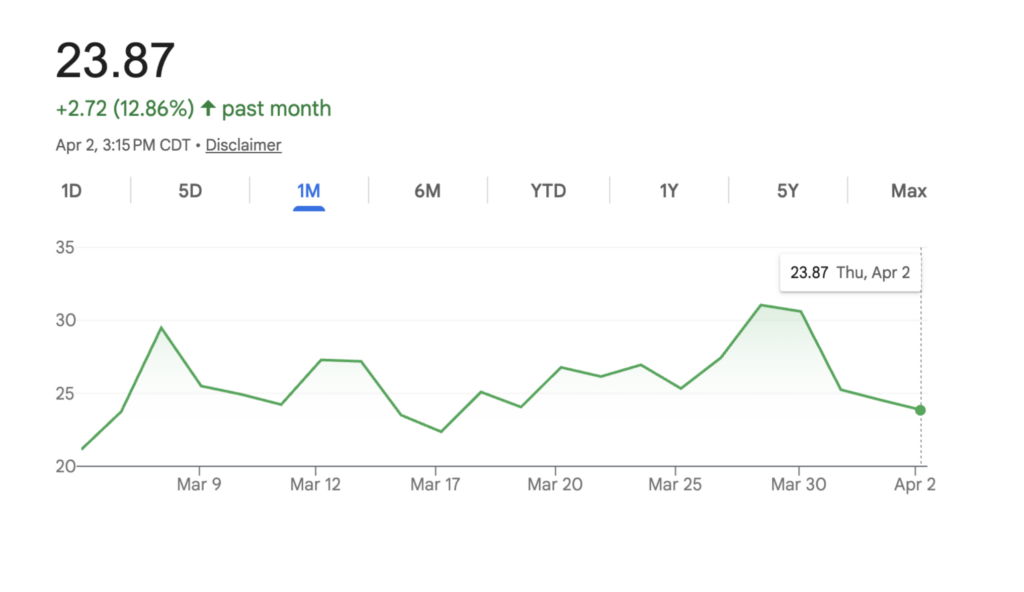 This is the monthly view with the cursor on the last day of open markets a couple of days ago (Closed for Easter Friday). The generally accepted “fear” levels are the following:
- Low VIX (e.g., 10–15):
- Markets are calm, investors feel confident
- Moderate VIX (15–25):
- Normal uncertainty
- High VIX (25+):
- Increased fear, big market swings expected
- Very high VIX (40+):
- Panic levels (often during crashes or crises)
The VIX doesn’t measure actual market movement—it measures expected volatility. What this means is that the number tends to spike when stocks fall (good for Forex trading).
Whatever Shall We Do
So, the bigger question remains. What can we use a pre-trading tool now that the $EVZ has gone the way of the Dodo?

We started looking at the VIX and wondered it it could be used in its place. What we discovered is that this may be possible. Granted, it’s not a perfect replacement, but more of a suggestion. So, here goes.
Data Please
What we did was take data from 2024, which was the last full year that the $EVZ was published and ran a comparisioin to the VIX. This is what it looks like.
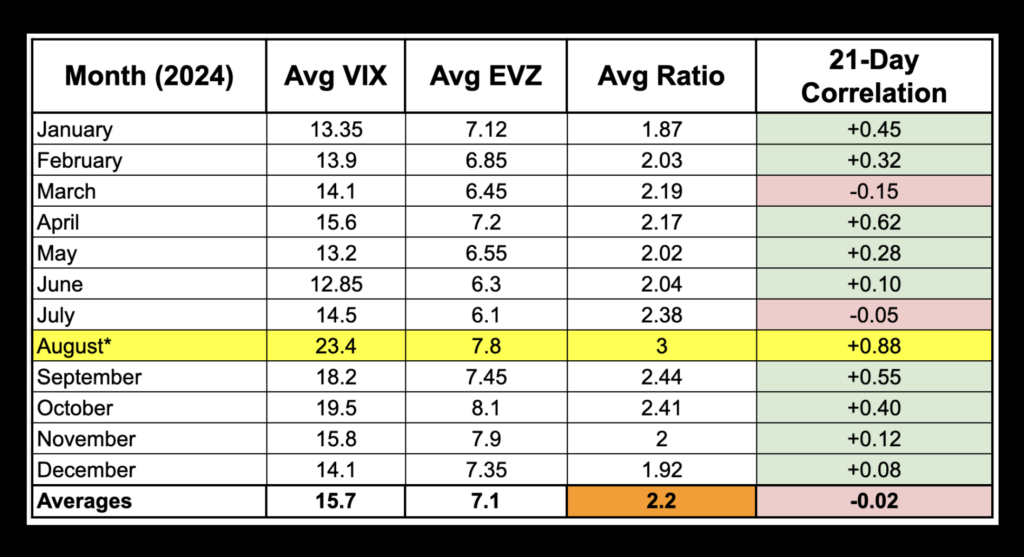
August Excitement
You’ll notice that August numbers seemd to fall outside the expected range. There was a reason for this. The VIX $EVZ moved very closely together because global investors were worried about the same big issues; interest rates, inflation, and economic growth. When this happens, people tend to get nervous. So when stock market fear went up (raising the VIX), currency market uncertainty also went up (raising the EVZ), their movements became very similar, which is why their correlation was so high.
Recalculate
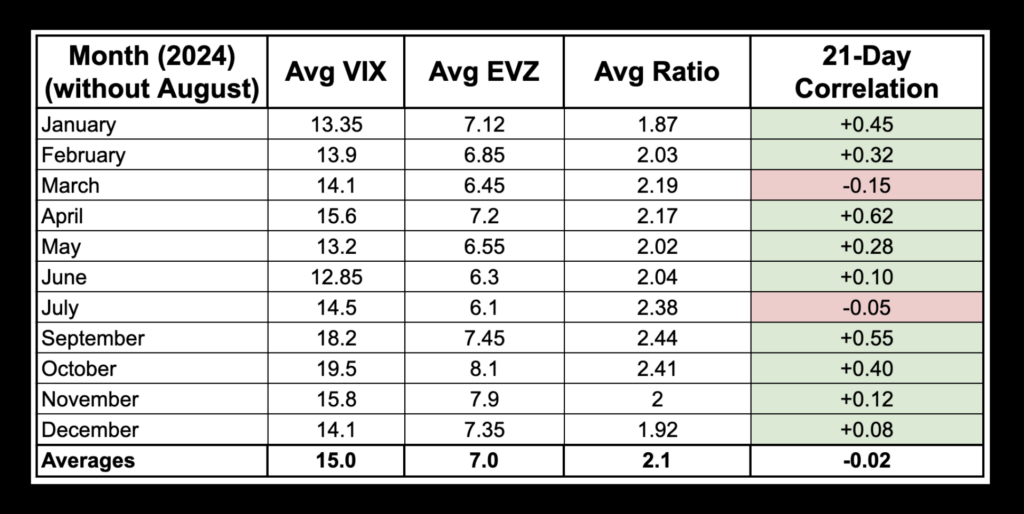
In an effort to smooth things out around August’s follies, we decided to see what it looked like without August getting crazy with the Cheez Whiz. This is how it played out.
Bottom Line
There was a small difference but at the end of the day, we’re suggesting that whatever the VIX is, just cut it in half and you’d get a pretty close number. For example, last Thursday’s closing VIX (the earlier image) was 23.87. If we divided that by the overall average of 2.1;
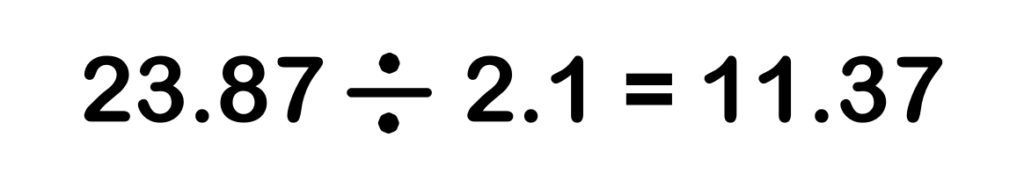
So, if I was just taking a very quick look, I’d just divide 24 by 2 and call it 12. Good enough for government work. So, bottom line; Take the VIX and cut it in half. Badda bing, badda boom.
Resources
Finding it is easy enough. Just Google VIX and you’ll come up with an easy to read chart. But since we’re helpful guys, we’ve included three links where you can get the chart and additional information, if you’re so inclined. The links are in no particular order, just the way they were listed.
Our only goal is to make you a better trader.
***Just a quick heads-up: Everything you see here is for informational purposes and to help you learn. It isn’t intended to be professional legal, tax, or investment advice. While we love sharing what we know, we aren’t suggesting you buy or sell any specific financial products, and our content doesn’t take into account your personal financial situation.
Because everyone’s needs are different, it’s always best to chat with a professional before making big moves or make your own decisions without the influence of others. By using our site (and the information herein), you agree that any decisions you make are your own, and you won’t hold Stonehill Forex, LTD or our partners responsible for the outcome.