Lisen Up
If you’ve listened to the No Nonsense Forex podcasts, videos and read through the blogs, you probably have heard the term; “The Euro VIX”, or the Euro currency volatility index mentioned as a pre-trade tool. You may ask yourself; “What it is, how can it help me, and what should I be looking for when checking its chart?” (I’ll supply links to the source websites at the conclusion of this text.)
Financial Benchmark
Simply stated, the Euro VIX is a financial benchmark which estimates expected volatility of the market’s expectation of 30-day implied volatility for the Euro/U.S. Dollar exchange rate (EUR/USD). It is calculated by applying VIX methodology to options on the CurrencyShares Euro Trust ETF (FXE).
Interestingly enough, this “indicator” is a forecasting metric, as opposed to indicators we use in our trading algorithm and are based on actual volatility extrapolated from historical data.
How it’s calculated and from what it’s calculated are not necessarily things which need to be delved into; however, if you’re so inclined, the information is out there and easily accessible on multiple sites. We’re only interested in what the current value is from the chart.
So, what makes it helpful to us?
Helping Hands
Essentially, the VIX number gives us a heads-up on what the expected volatility of the market will be…and volatility is the fuel, created by trading volume. This is what moves our market. Eliminate the fuel, and we experience the dreaded “dead market” where prolonged trending moves are few and far between we so dearly love as swing traders.
By now, you might be asking when where, and what can this alluring tidbit of aid be procured from. The best thing is that it’s free and easily accessible, so let’s answer those questions.
When to Use it
First is the “when”…as in; “When do I use this in my trade process?” The answer is simple. When your system gives you a signal that all criteria have been met, or will be met in the next day or so. Prior to initiating a trade, check this metric. Simple enough, right?
Where to Find it
Where can it be found should be your next concern. There are a few places where you can easily view the chart (and specific level) including barchart.com, investing.com, and on tradingview.com. Don’t worry, I’ll provide links shortly.
When you are viewing the charts, be sure you are on the DAILY time frame and to get a sense of where the number was, is, and might be going, maintain at least 30 days on your chart.
The Magic Number is…
And now, the cherry. “What number should you be looking for?” Again, easy answer. It’s 7. Originally, the level was 8; however, due to market conditions over the past few years, it was lowered. If the VIX is at least 7 and higher, sufficient volume and volatility exist where the potential for a profitable trade can live and breath. You may ask if “7” is a hard target. Not necessarily. It can stray below 7, but you want to consider adjusting your risk. If it gets down to 5, you might want to refer to the “Dead Markets Playbook” video below. Never become a victim of FOMO – Fear of Missing Out. Below is the link to VP’s video about trading with a low VIX number.
Will it Ever go Back up to 8?
When we posted this, the VIX was below 8 (hence the section title). We never know when it will go back up. When it does, we will post an update, so you’ll be able to make the necessary adjustments in your trading. At the time of this post’s update (January ’26), the value is above the minimum threshold, so we’re good.
So…What Does it Look Like?
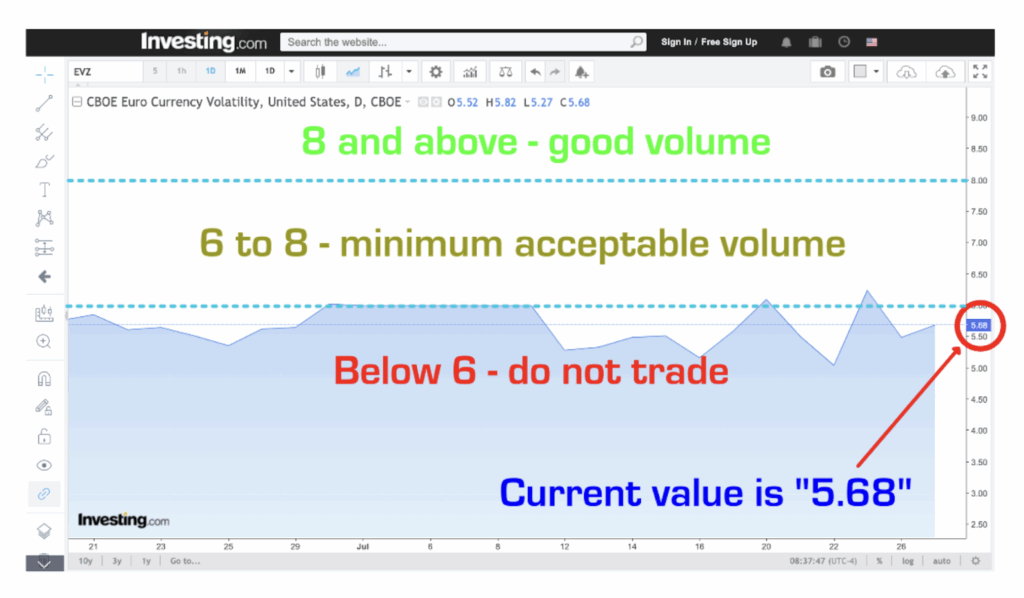
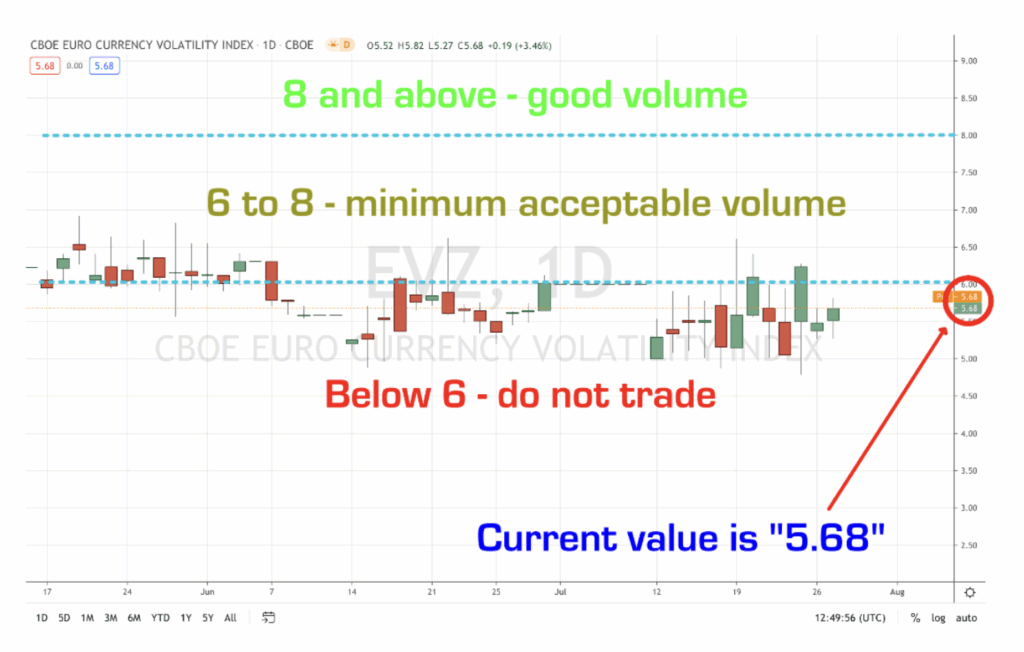
Below is a sample of the chart from both aforementioned websites, with a few notations, so you’ll know what you’re looking for. You can view it as a line chart or as a candlestick chart. It makes no difference. Go ahead and click on the links to visit the site…and just press the “back” arrow in your browser to return to this blog when you’re finished checking each site out. Don’t take the image values with any degree of validity, as they are representative of past numbers.
Investing.com
Tradingview.com
Where Oh Where
Now that you know the “what” and “when”, I’ll give you the “where”. Once you click on the links, be sure to click on the “back arrow” to return to the blog…
On investing.com, the link is: HERE
On tradingview.com, the link is: HERE
*If the link does not take you to the chart, go to www.tradingview.com, click on “chart”, “index”, then enter in “EVZ”. There will be only one choice; “CBOE EURO CURRENCY VOLATILITY INDEX”. Click on that.
There is a third option at barchart as well, the link is: HERE
And, now YOU are aware of a tool that most traders are not even aware of. Be sure to sign up on our contact list for the latest announcements.
Our only goal is to make you a better trader.
BTW – Any information communicated by Stonehill Forex Limited is solely for educational purposes. The information contained within the courses and on the website neither constitutes investment advice nor a general recommendation on investments. It is not intended to be and should not be interpreted as investment advice or a general recommendation on investment. Any person who places trades, orders or makes other types of trades and investments etc. is responsible for their own investment decisions and does so at their own risk. It is recommended that any person taking investment decisions consults with an independent financial advisor. Stonehill Forex Limited training courses and blogs are for educational purposes only, not a financial advisory service, and does not give financial advice or make general recommendations on investment.