Doing Another One
About three summers back in ‘23, we started looking at some indicators from a guy whose been around the proverbial block a few times. On a whim, we reached out to Mr. Katsanos and were pleasantly surprised that we received a response. We didn’t profile whatever indicator we were researching at that time; however, we did profile one of his indicators later that year called Stiffness, a volatility/volume indicator.
He’s The Guy
If you never heard of him, he’s a trader and a Market Analyst known for his work in trading systems development. With a few articles and other publications to his credit, he’s best recognized for a series of indicators he’s developed, of which this is the one we’re talking about today is second of the series.
Which One
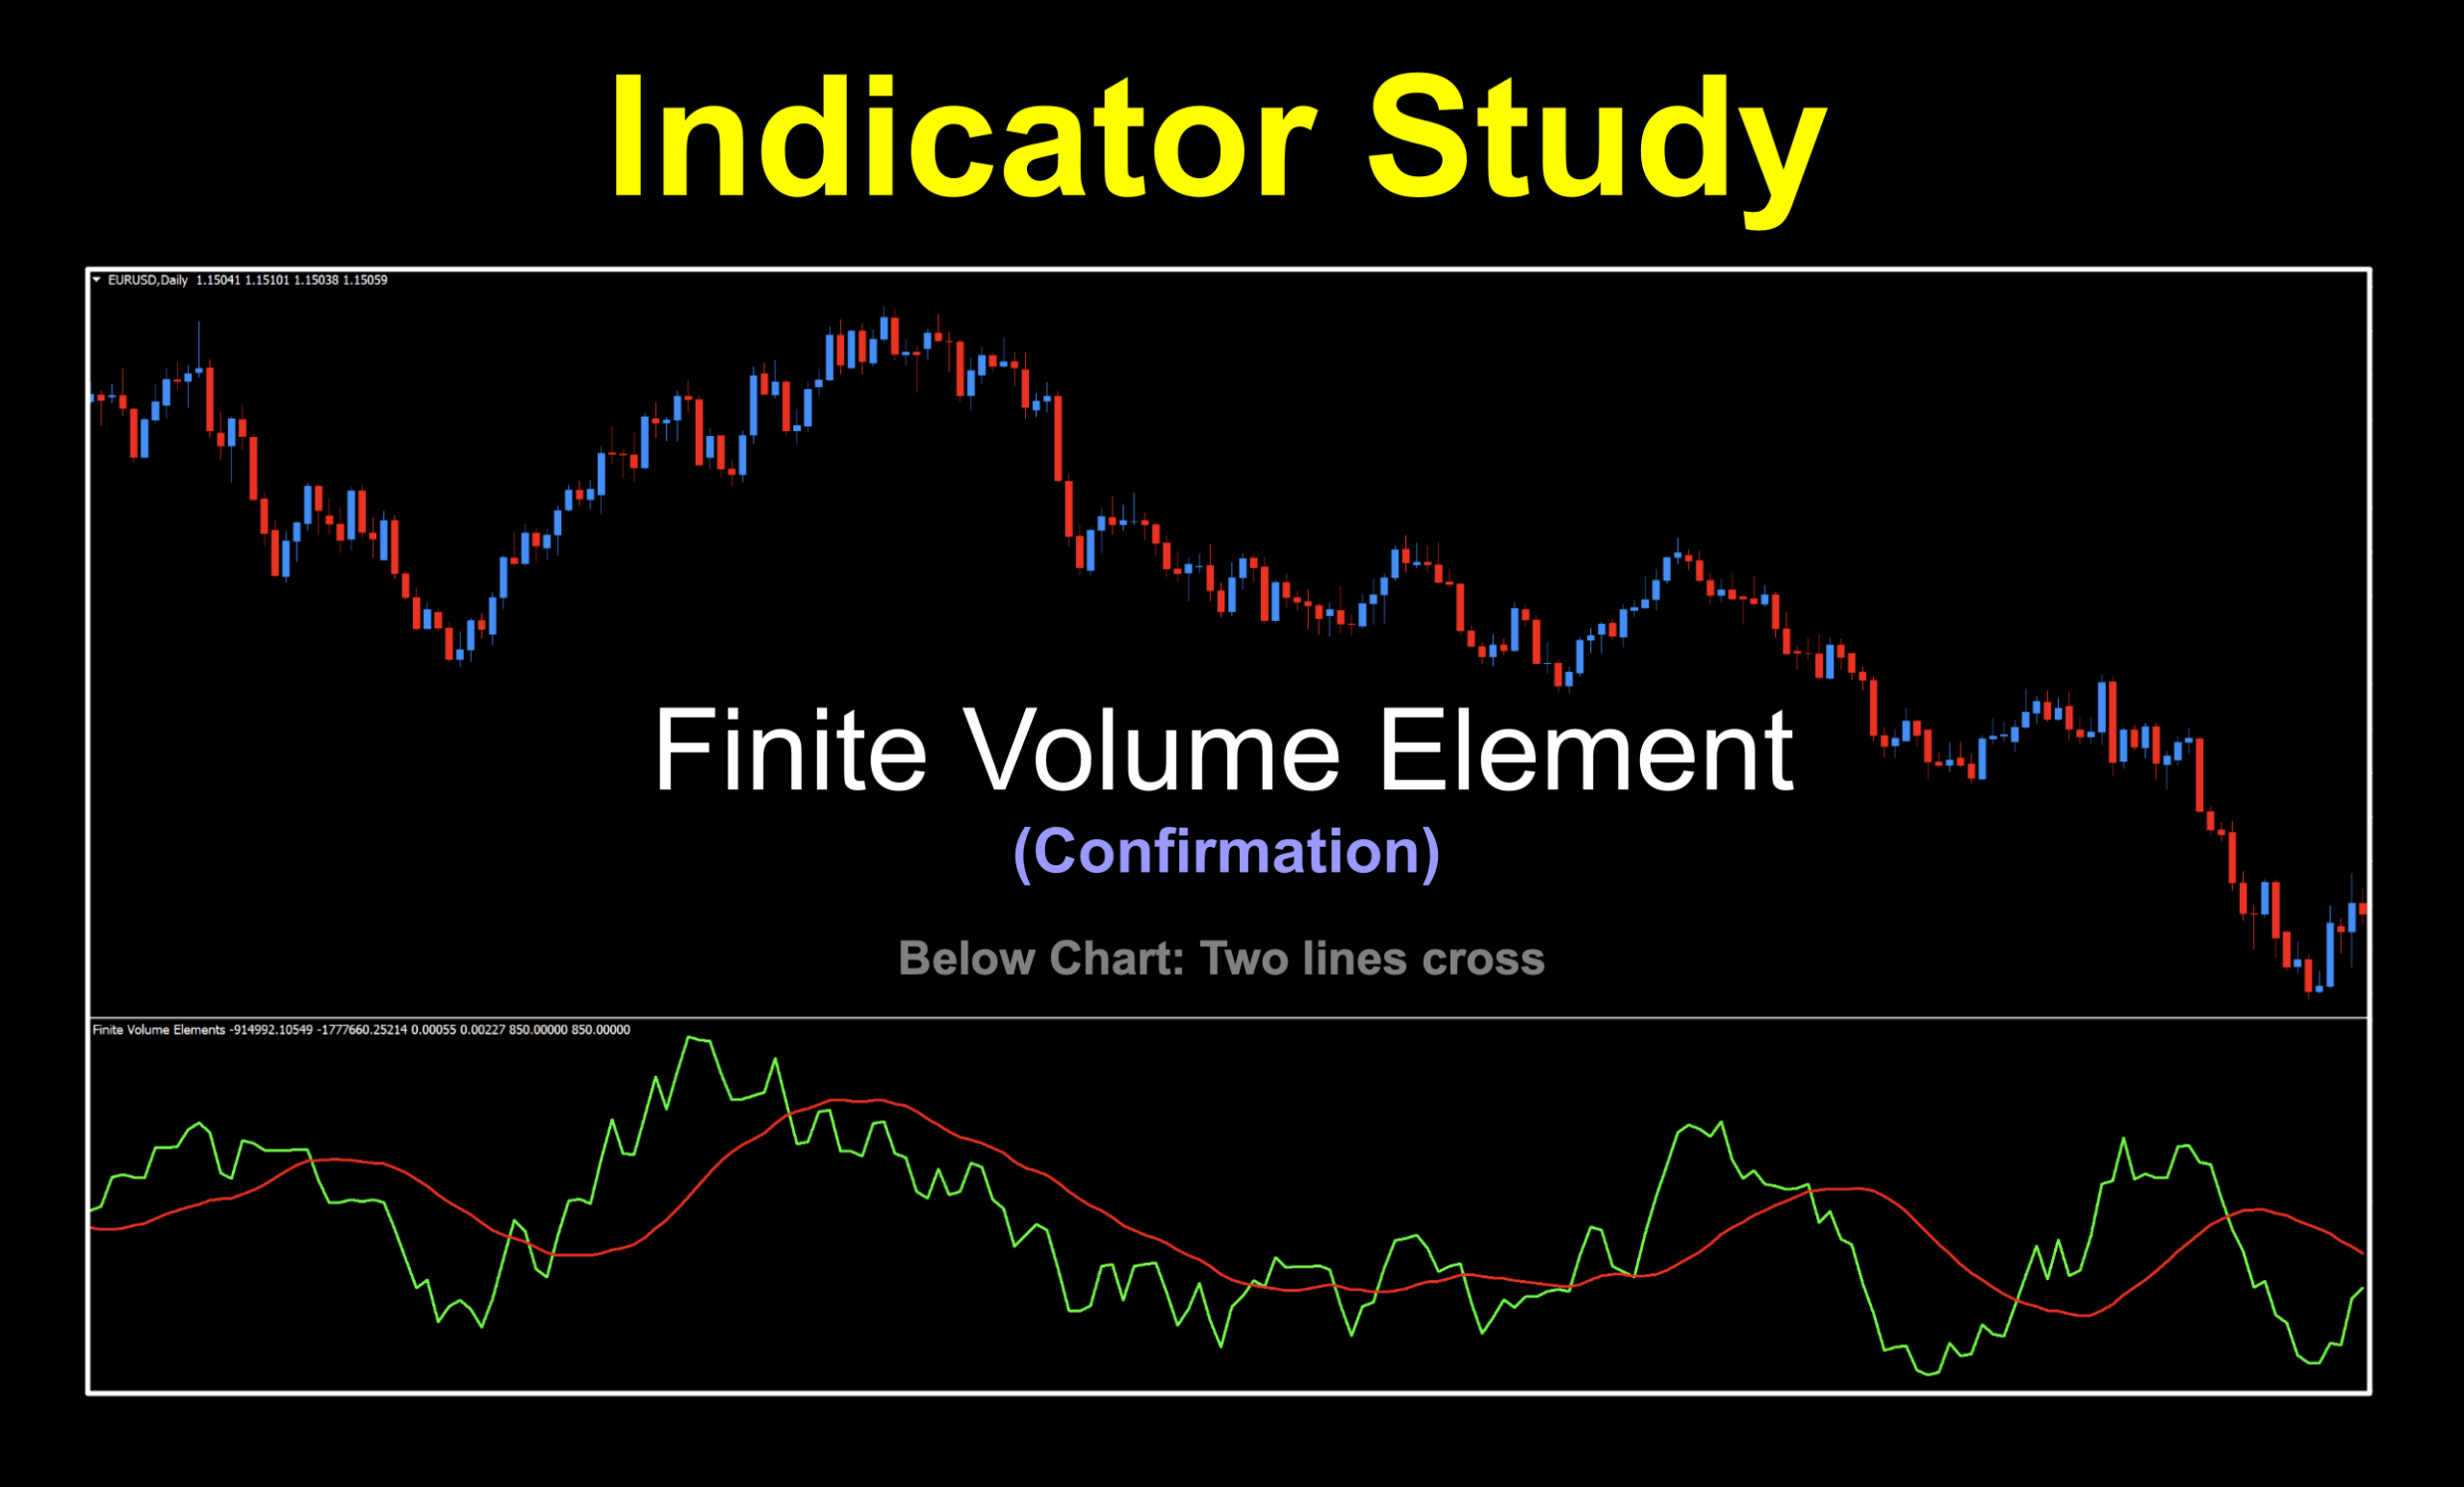
Oh, so which one are we doing today? Great question. We’re going to cover the FVE, or the Finite Volume Element developed in 2003 and featured in the April 2003 issue of Technical Analysis of Stocks & Commodities magazine. By the way, we wanted to clarify that this indicator is a confirmation type, not a volume type.
What’s It Do
It measures buying and selling pressure by combining price movement and trading volume. Positive values indicate accumulation (buying pressure), while negative values indicate distribution (selling pressure). The cool thing is that it resolves issues between intraday and interday movement of price and does not disregard small changes in price for a more complete view of the data.
Different Flavors
There are different versions including a zero cross produced by only the FVE signal line, a version with a moving average to create a two lines cross and even an “normalized” two lines cross version. We’ll be looking at the original two lines cross version today. And for those wondering how to read it, when the green line is on top, it’s a long signal and when the red line is on top, it’s a short signal.
Get Your Math On
For our math minded peeps, we’re including the formula(s) used in this indicator.
INTRA = log(hi) – log(lo)
VINTRA = std(intra,period)
INTER = log(typ) – log(typ.1)
VINTER = std(inter,period)
CUTOFF = 0.1 * (vinter + intra) * cl mf – cl – (hi+lo)/2 + typ-typ.1
VE = volume element:
if(mf>cutoff) ve=+vol else if(mf<-cutoff) else
If(mf<-cutoff) ve=-vol else
ve=0 fve=100 * sum(ve,period)/ma(vol,period)*period)
Where;
STD = Standard Deviation
LOG = Natural Logarithm (base e)
TYPE = Typical Price (HI+LO+CL)/3
PERIOD = FVE Period
And, as Clint Eastwood is known for saying when concluding a scene, “That’s enough of that”.

Eye Candy
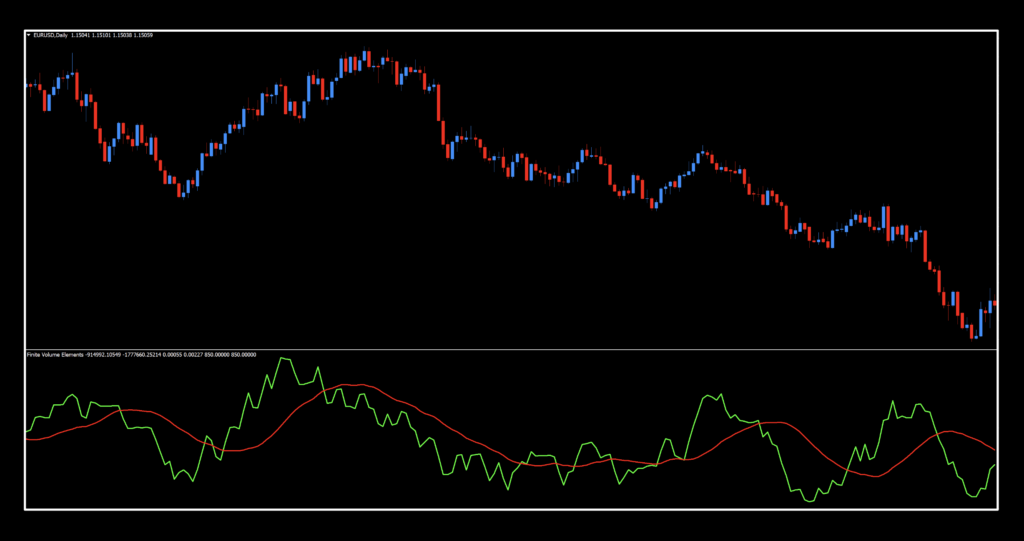
Now we’ll get to the pretty pictures. This first image is pretty much stock with the lines thickened up for better visibility.
Squiggle Smooth
While the FVE (green) signal line paints a somewhat jagged line, the smoother (red) moving average signal line settles things down by giving us long and short signals. The reaction time of the FVE is pretty quick based on its ability to accommodate change in price and with the many possible adjustments, we’ll see some pretty cool stuff.
Settings
This indicator has a few settings, and we are using all of them.
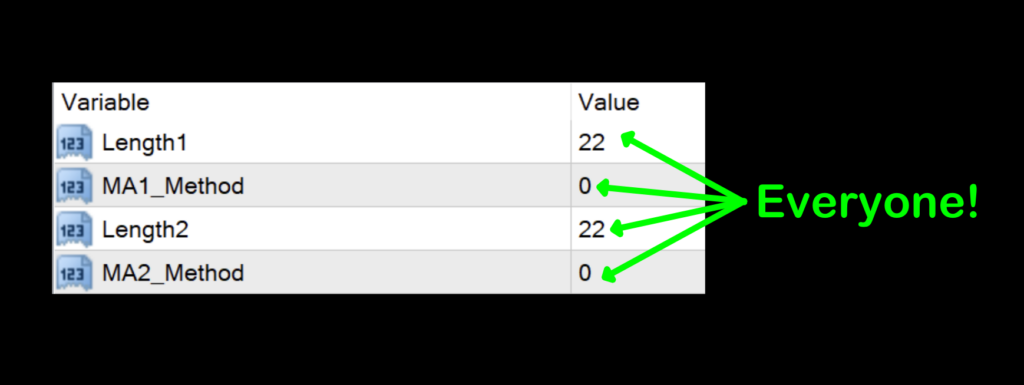
Length1: The number of periods which affect the FVE calculations (also affects the CINTRA – Intraday Coefficient and the CINTER – Interday Coefficient) and is the green line. The default setting is 22.
MA1_Method: The data set used in the Length1 variable where 0 – SMA, 1 – EMA, 2 – SMMA, and 3 – LWMA. The default value is 0 – SMA.
Length2: The number of periods for the moving average (red line). The default value is 22.
MA2_Method: The data set used in the Length2 variable where 0 – SMA, 1 – EMA, 2 – SMMA, and 3 – LWMA. The default value is 0 – SMA.
Doing The Deed
Once you’re ready to perform daily maintenance on your trades during the last 20–30 minutes of the trading day (1700 New York time), you’ll be presented with one of four options.
- Opening a trade.
- Closing a trade
- Maintaining a trade; i.e.
- Moving a stop loss level.
- Exiting a trade.
- Taking a pass (nothing to do).
And Now The Good Stuff
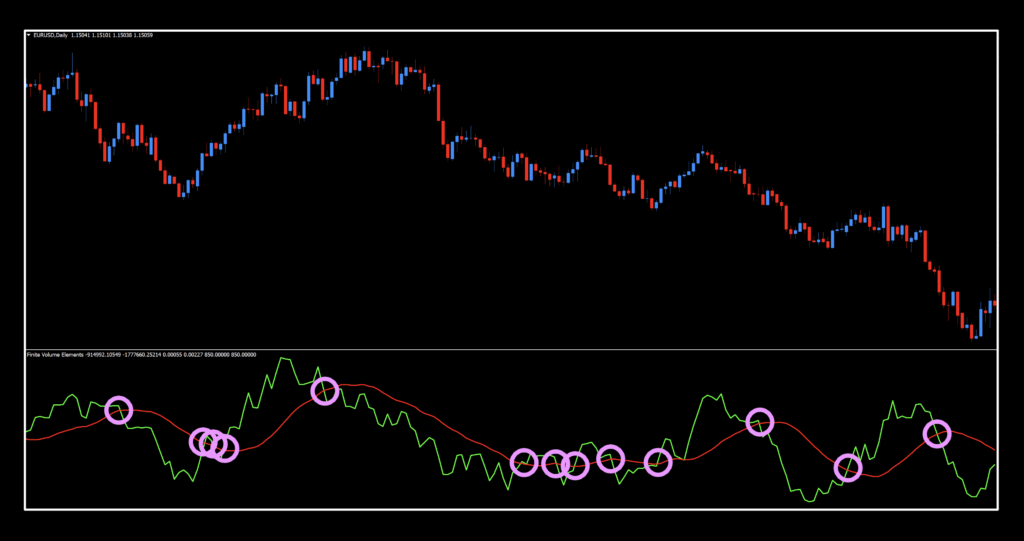
Signals are pretty clear barring the areas where price becomes rangebound. This is not uncommon and the main reason why you never trade with just one indicator. Noodling around with the settings will give you some interesting (and visual) results. Go ahead, try it. We’re not watching…
Rock & Roll
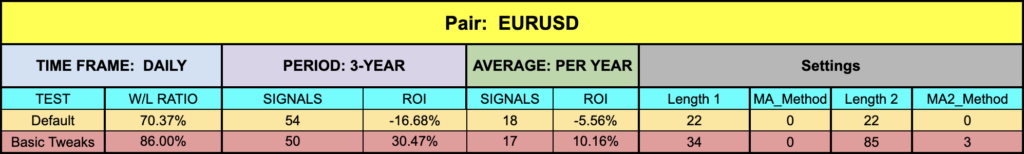


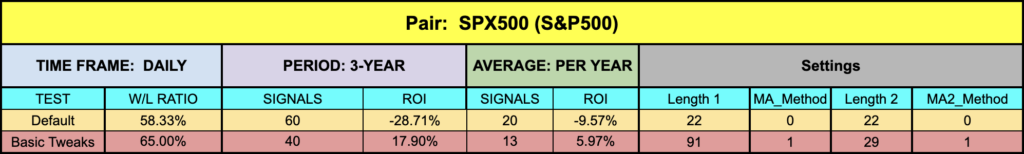
Okay, not bad at all. Given that all four of the pairs started in the negatives (and some pretty deep), we were able to coax out some relatively decent numbers across the the board. But don’t take our word for it, check it out yourself and see what kind of juice you can squeeze from this fruit.
Resources
This bit of goodness from Mr. Katsanos is available in the Stonehill Forex library for free and will have “NEW” in red to alert you to its location. Get it HERE. And, be sure to subscribe to the Stonehill Forex YouTube channel and watch the accompanying technical analysis video to see how it performs. Finally, be sure to consider the Advanced NNFXFor fast-tracking your trading success, be sure to consider the Advanced NNFX Course HERE.
Our only goal is to make you a better trader.
*Our published testing results are based on money management strategies employed by the NNFX system and depend on varying external factors, which may be different between individuals and their specific broker conditions. No guarantee, trading recommendations, or other market suggestions are implied. Your results and subsequent trading activities are solely your own responsibility.
BTW — Any information communicated by Stonehill Forex Limited is solely for educational purposes. The information contained within the courses and on the website neither constitutes investment advice nor a general recommendation on investments. It is not intended to be and should not be interpreted as investment advice or a general recommendation on investment. Any person who places trades, orders or makes other types of trades and investments etc. is responsible for their own investment decisions and does so at their own risk. It is recommended that any person taking investment decisions consults with an independent financial advisor. Stonehill Forex Limited training courses and blogs are for educational purposes only, not a financial advisory service, and does not give financial advice or make general recommendations on investment.