
RSI & CCI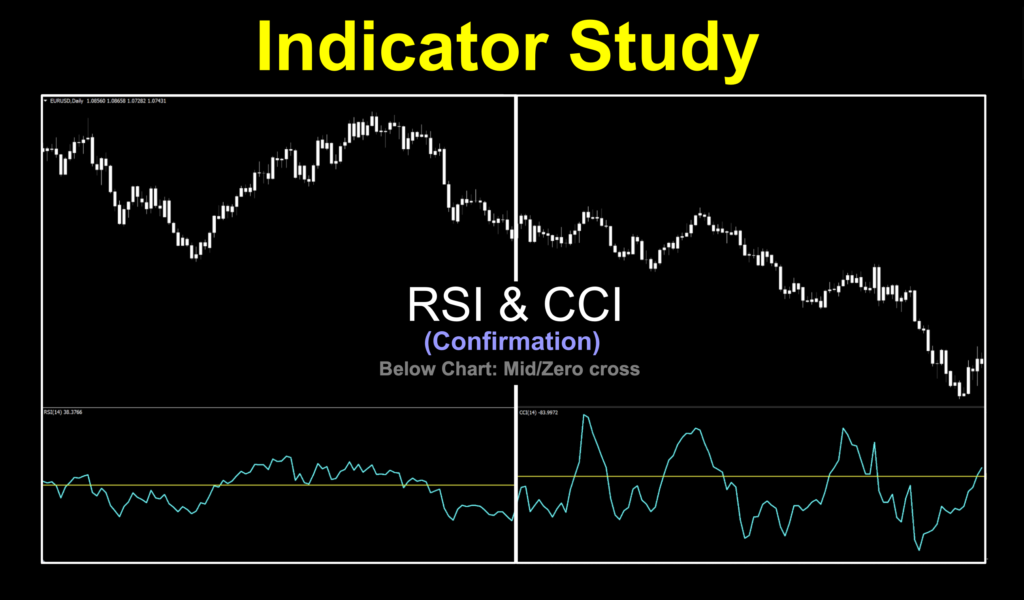
Visiting Old Acquaintances
There have been whispers in the passageways. Murmurs and mutterings about how certain older indicators can hold their own against newer indicators. Maybe, maybe not. Care to place a wager?
We Do Things Differently
There were claims of “their way” is better, and that’s totally cool. We’ve done the same things to indicators we investigate. That’s what makes our trading world so much better. But, if the alternative way of doing things doesn’t garner better results, then better…becomes subjective.
Dirty Birdies
So, all that aside…VP suggested testing the RSI and CCI indicators as mid/zero level cross indicators, rather than as overbought and oversold since reports of better results had been reported through various channels. We were intrigued and met the challenge with vim, vigor, and verve.
Who Dat?
For those who are not familiar with either the Relative Strength Indicator (RSI) or the CCI (Commodity Channel Index), they were developed by J. Welles Wilder in 1978 and Donald Lambert in 1980 respectively. Both indicators aimed to identify turning points of the market based on overbought and oversold trader sentiment. And, as we all know, the concept of overbought and oversold in the Forex market is not really a thing since currencies can move literally thousands of pips for years before any sign of changing direction. Stocks, and other securities, are a different matter.
Crossing Lines
We’ll look at a screenshot of the RSI first in its native form. We’ve brightened up things to make it easier to see, of course.
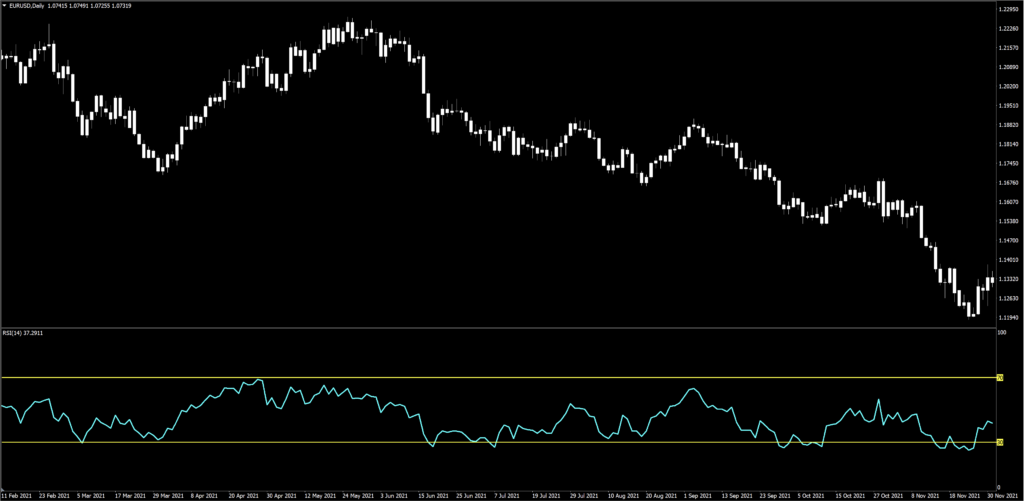
The premise of this is that when the blue line crosses above the upper 70 yellow line, the market is “overbought” and is ripe for reversal. When it dips below the lower 30 line, then the market is considered “oversold” and ready to reverse.
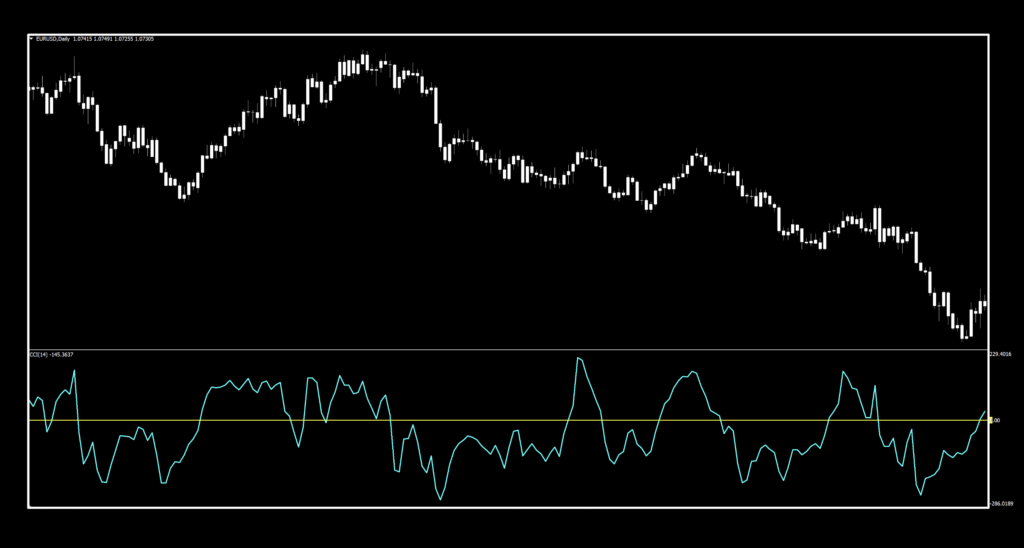
The same goes for the CCI as well, with some minor variations to the visuals.
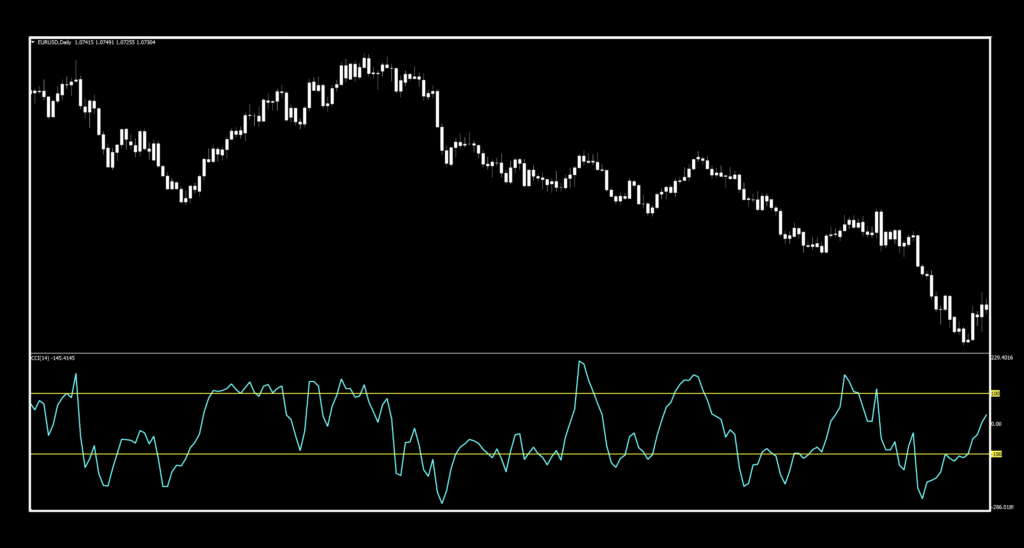
Here, we can see that the overbought and oversold levels are at +100 and -100.
Alternate views
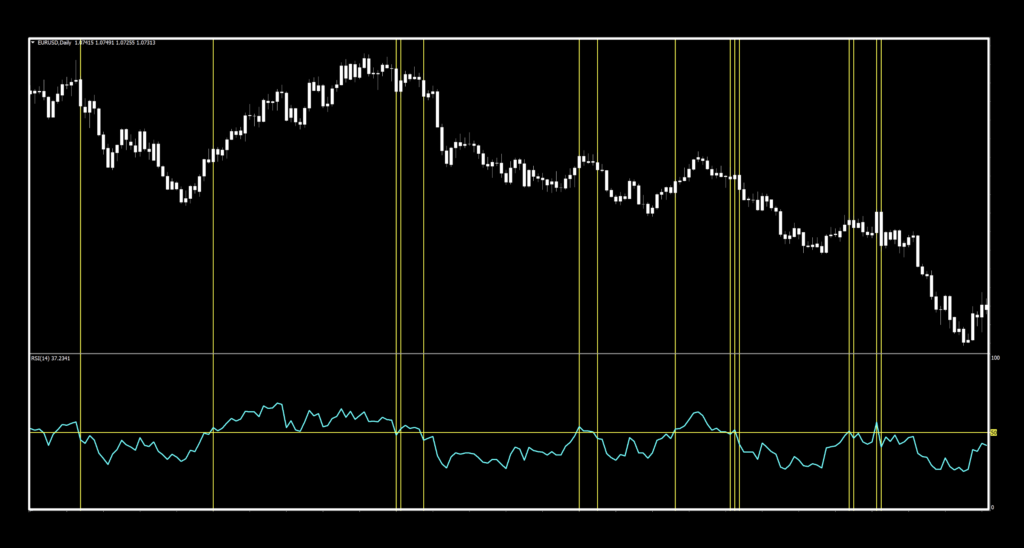
Now that we’ve covered the “historic” perspective, let’s see how they look with the modified mid/zero cross lines in place of the OB/OS lines. The first one is the RSI.
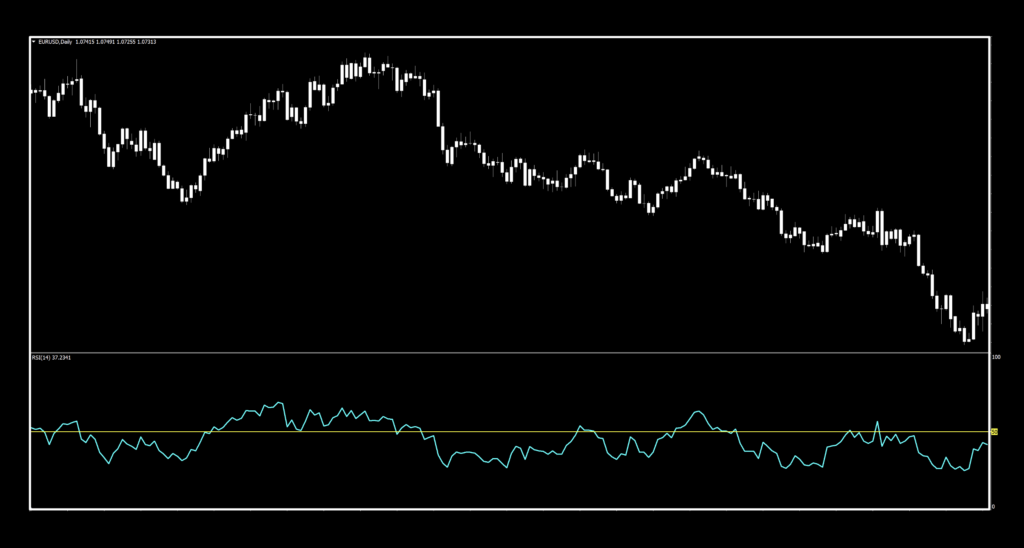
And below, we marked up each signal we saw. There are some decent ones when the market trends well, but there are quite a few losing signals.
And now, let’s look at the alternate view of the CCI.
And the marked up version with each signal we saw.
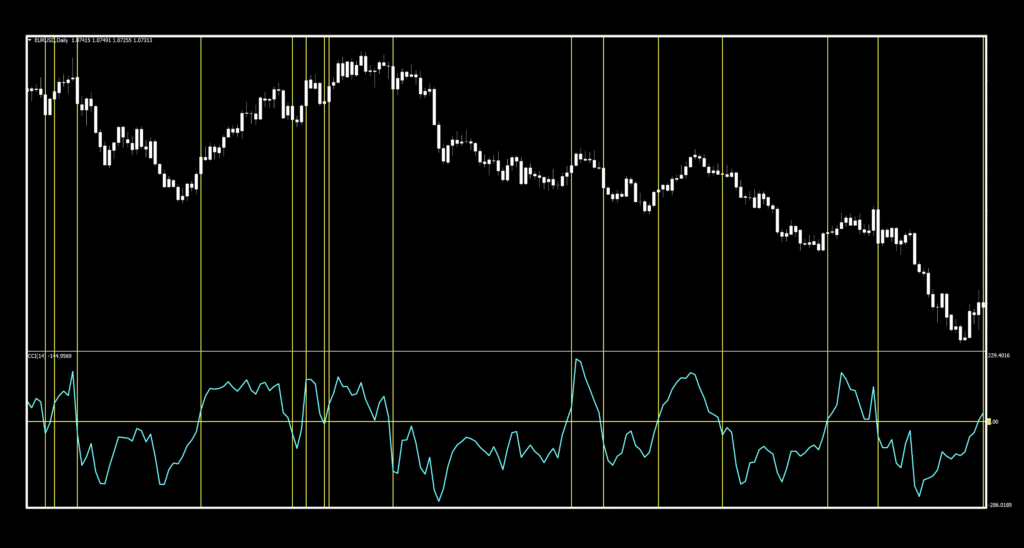
Again, some good signals when the market was trending and a few when there was some chop.
Markets Matter
The one thing we wanted to point out is that we’re using the same chart we always use for indicator analysis and profiling. We won’t cherry-pick the best markets to fluff up an indicator we like or stomp down an indicator we’re not crazy about. But, the market now, is not like the market then…which will be evident in the testing results.
Fair & Square
Before you check out the results, please keep in mind that we were in no way biased for or against anything. We just report what we get. We didn’t pick the best settings because those tend to overfit, which makes trading impractical. We did choose settings that met the criteria for good numbers all around and were in the upper 80% of the results.
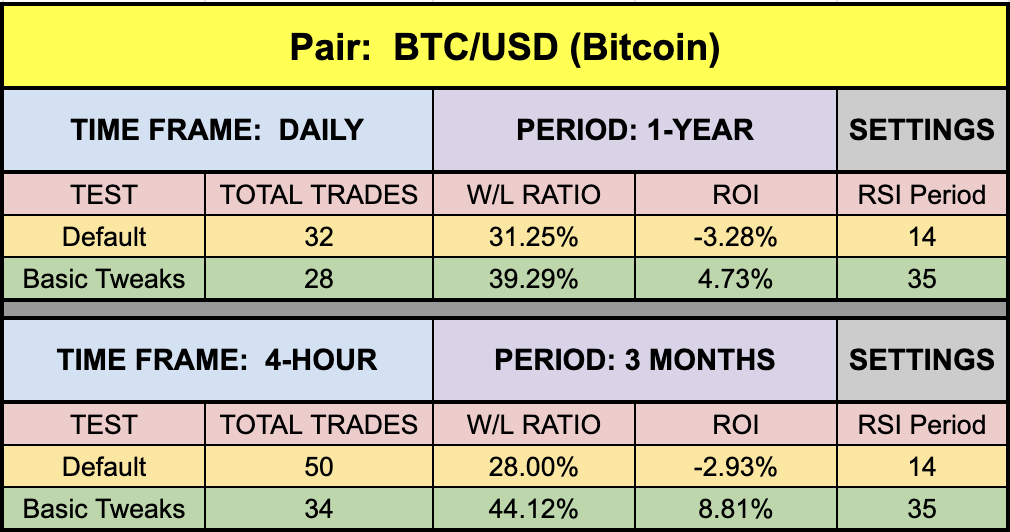
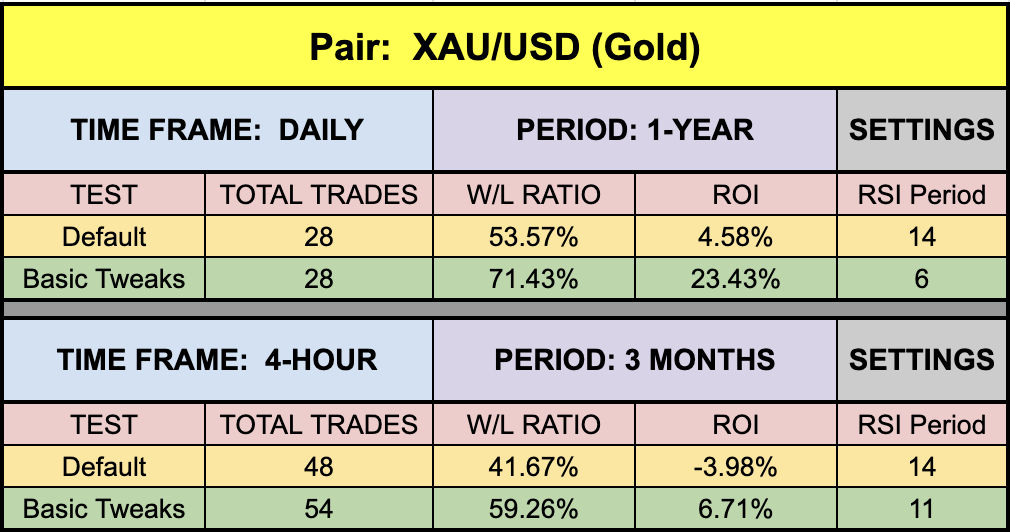
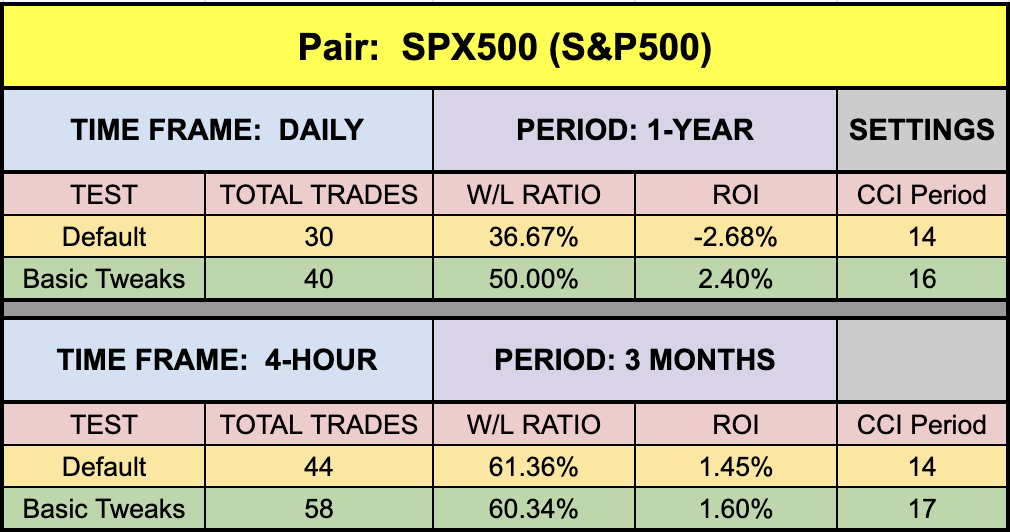
Results for RSI
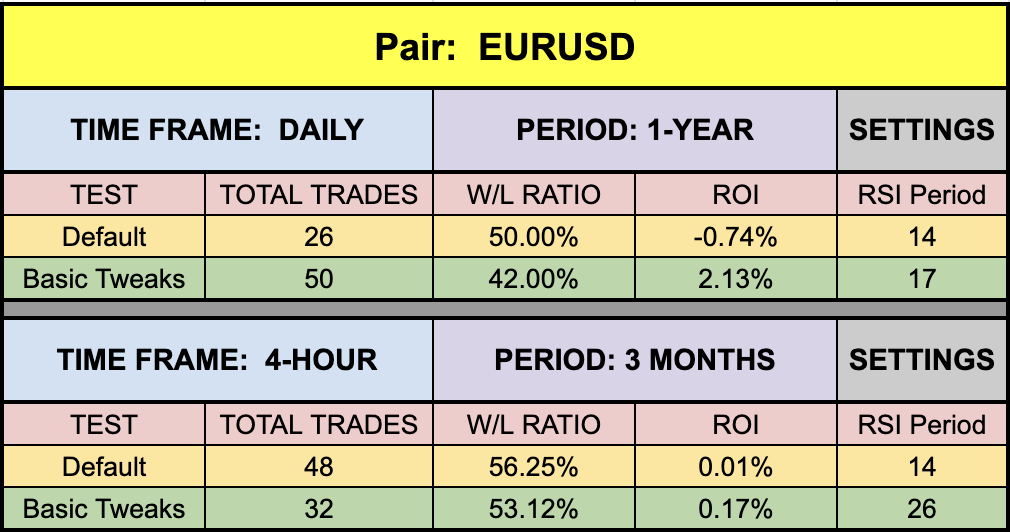

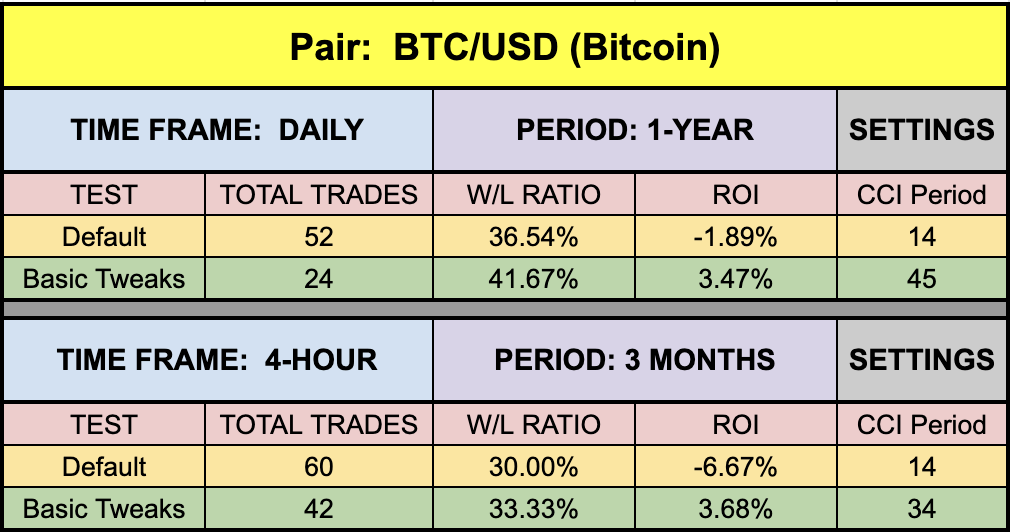
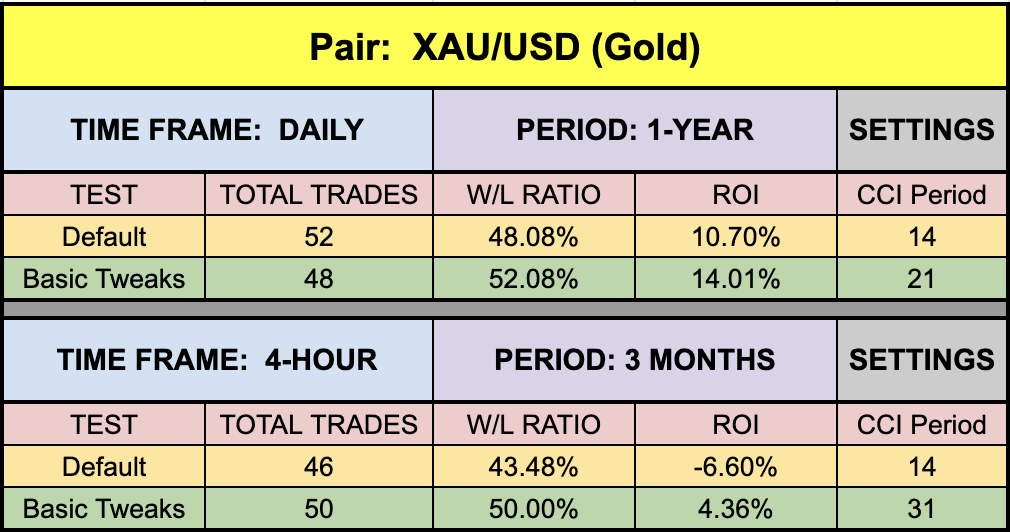
Results for CCI

The Choice is Yours
With so many indicators out there…literally over 10,000 (no joke), you don’t need to try to force a square peg into a round hole. We research and test dozens of indicators before settling on one worth your time. That doesn’t mean we’re telling you not to try these two. We applaud each and every suggestion, challenge, comment, and idea which helps all of us get to the next level. Never stop.
Our only goal is to make you a better trader.
*Our published testing results are based on money management strategies employed by the NNFX system and depend on varying external factors, which may be different between individuals and their specific broker conditions. No guarantee, trading recommendations, or other market suggestions are implied. Your results and subsequent trading activities are solely your own responsibility.
BTW — Any information communicated by Stonehill Forex Limited is solely for educational purposes. The information contained within the courses and on the website neither constitutes investment advice nor a general recommendation on investments. It is not intended to be and should not be interpreted as investment advice or a general recommendation on investment. Any person who places trades, orders or makes other types of trades and investments etc. is responsible for their own investment decisions and does so at their own risk. It is recommended that any person taking investment decisions consults with an independent financial advisor. Stonehill Forex Limited training courses and blogs are for educational purposes only, not a financial advisory service, and does not give financial advice or make general recommendations on investment.