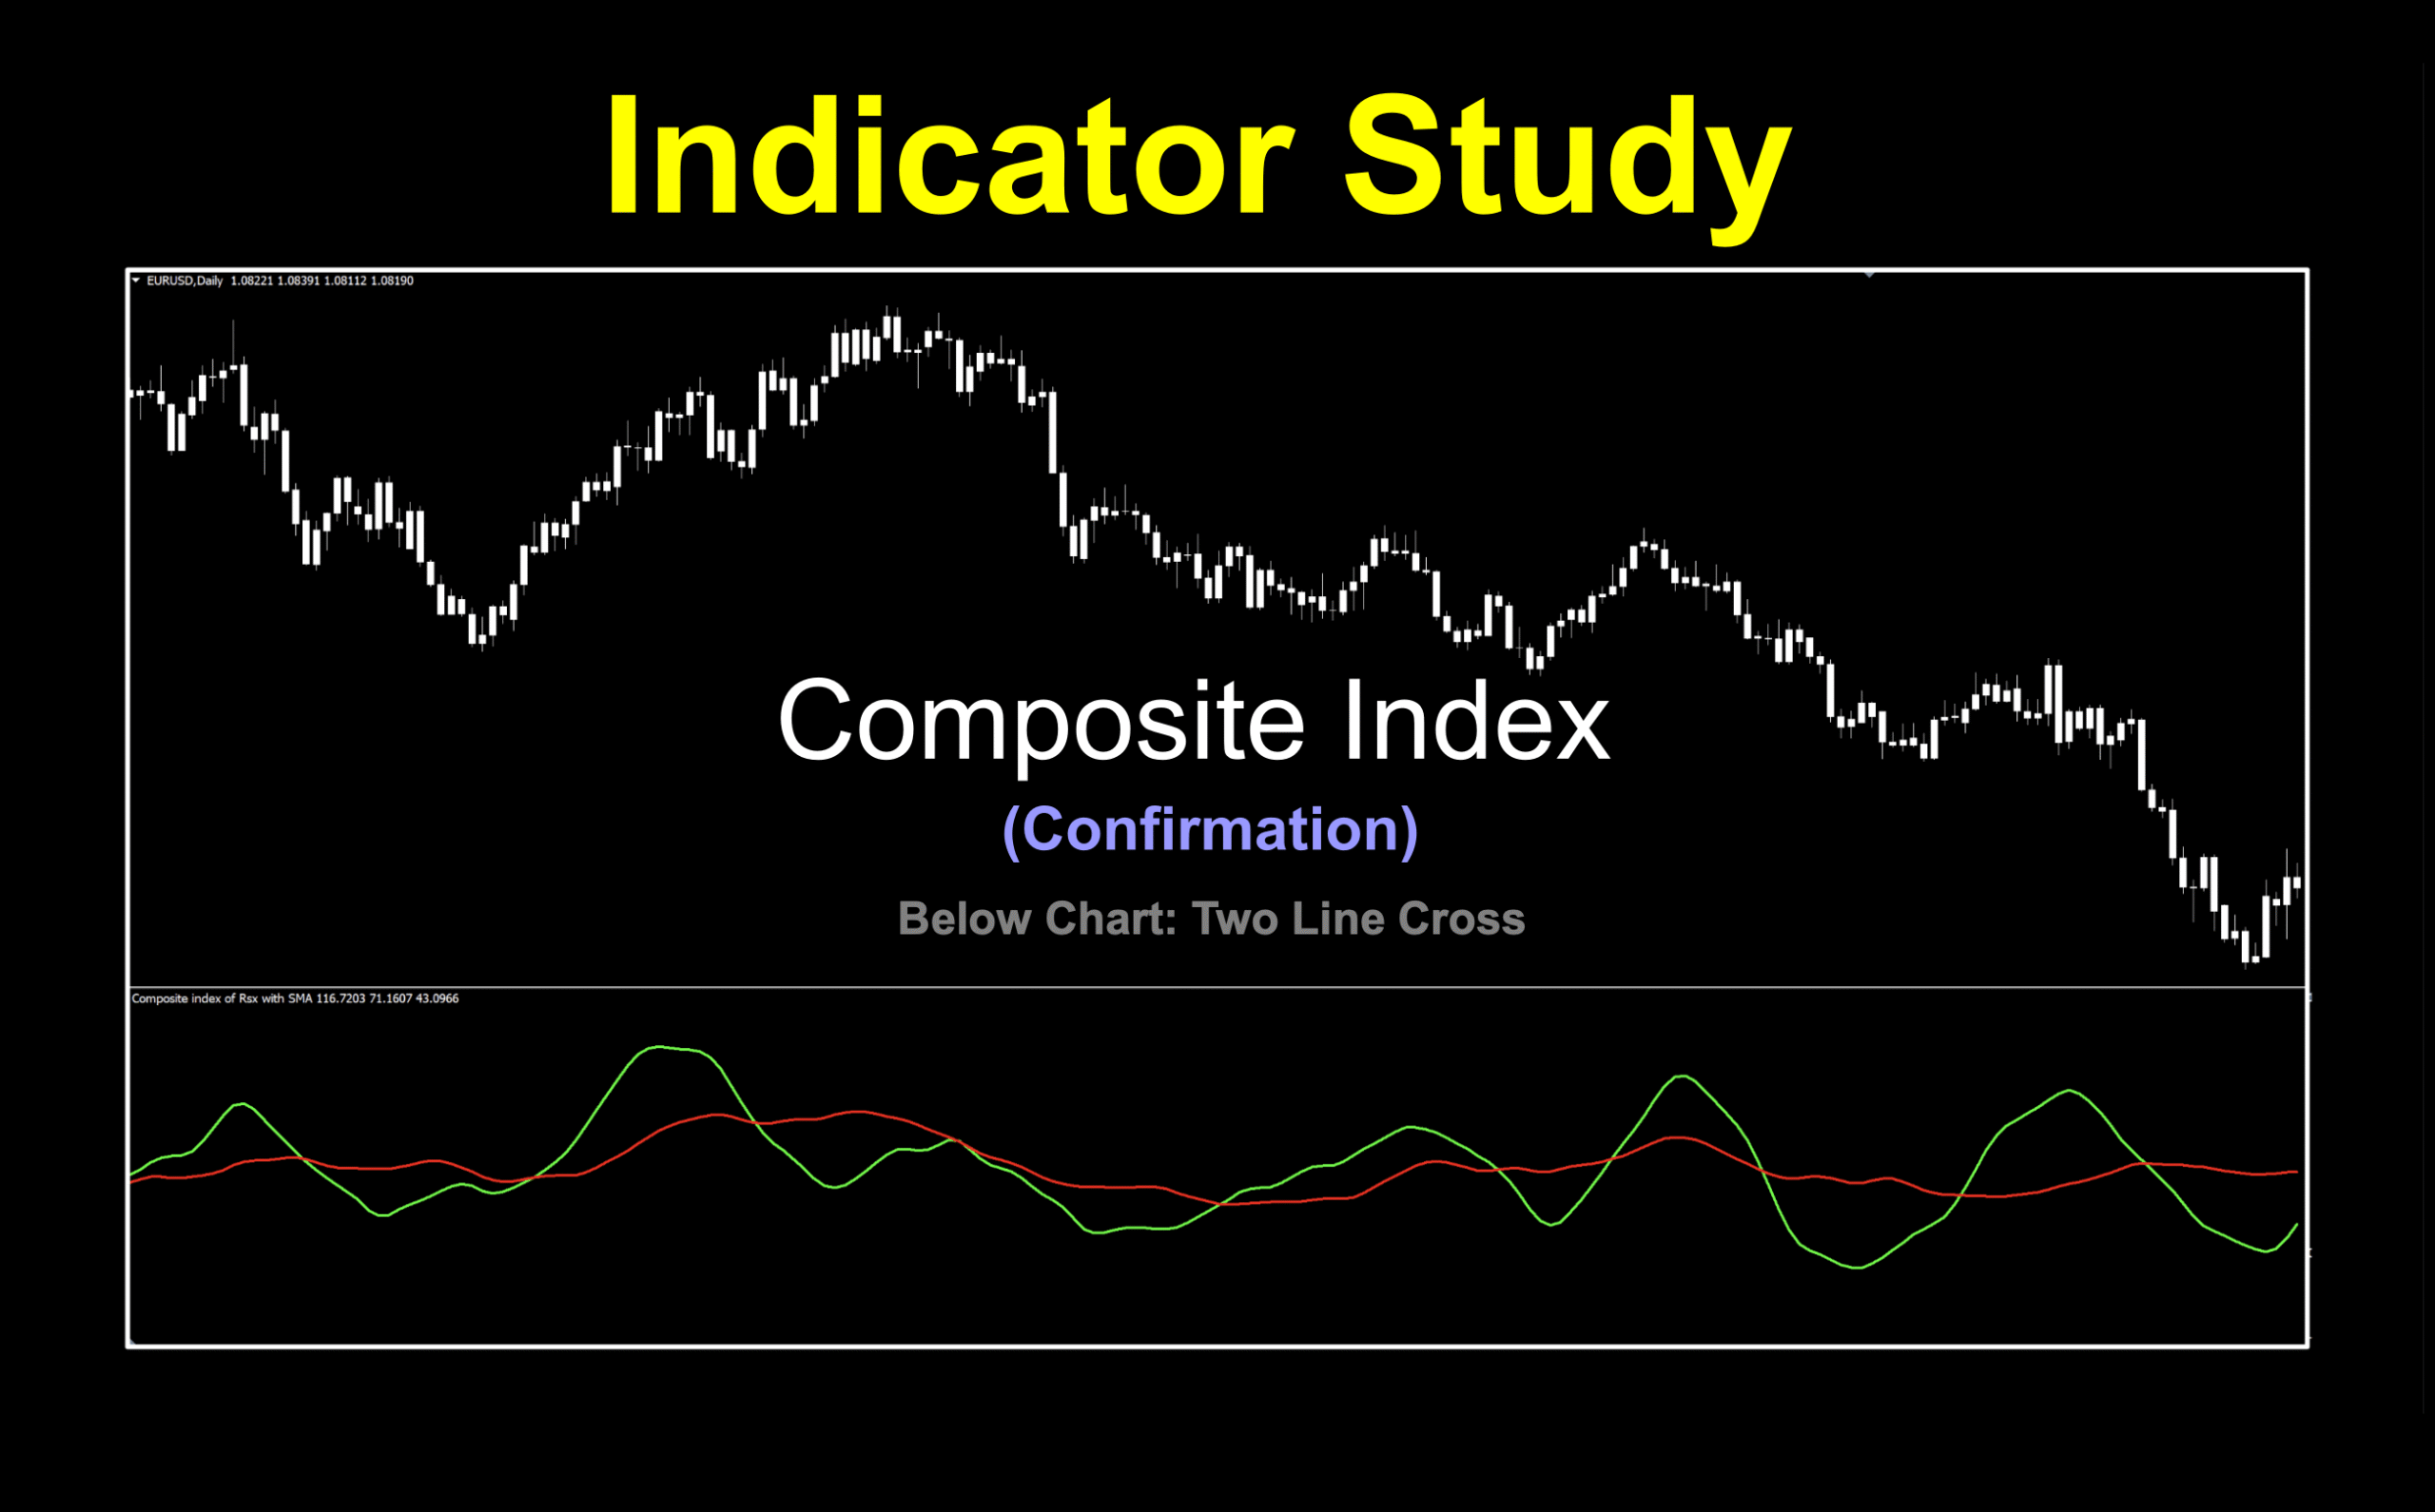
Composite Index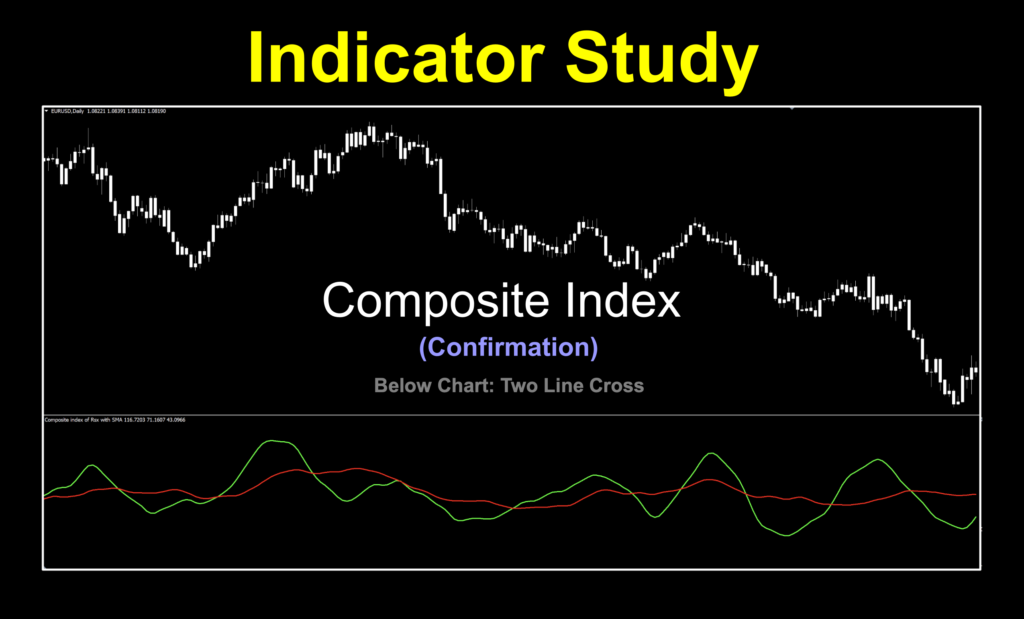
Compounding Magic
Mixing things up can sometimes make it more interesting. If you’ve seen that movie “Ratatouille” with the rat who cooks, you’ll know the scene. It’s when he’s mixing strawberries and cheese, and the resultant reaction is quite apparent. Sometimes this happens in trading as well. We’ve got an indicator this week which takes something old, makes it better, and adds a little something extra to perhaps create something worth writing home about.

The Woman Behind This Scene
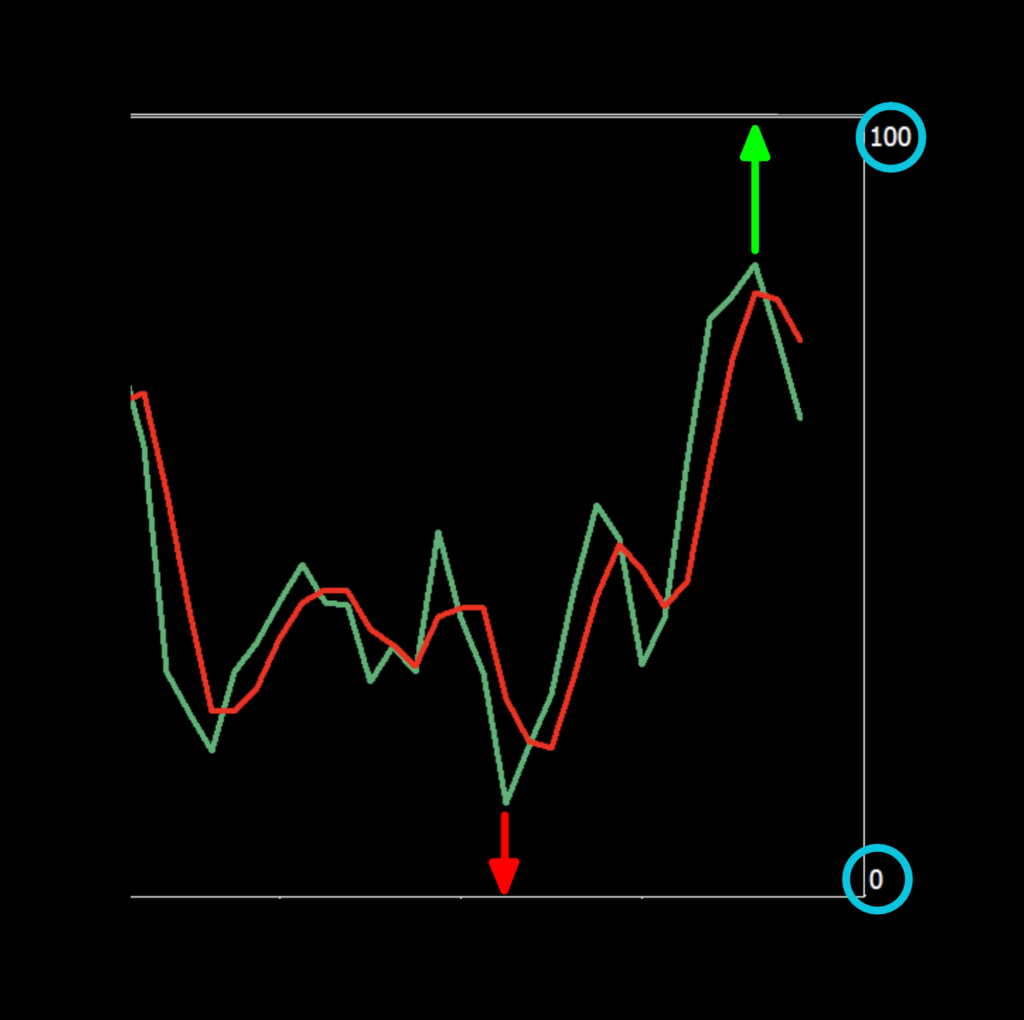
The Composite Index is a below chart indicator with multiple components, various applicable strategies and a bit of history all rolled up in one. Her name is Constance Brown and in 1999 she wrote the book called, Technical Analysis for the Trading Professional, where she introduced this unbounded momentum indicator. That means, the indicator is not “bound” by fixed values, usually 0 to 100 as noted in the typical oscillating indicator below.
Making Old Better
Ms. Brown took the traditional RSI indicator developed by Welles Wilder, added a momentum component and allowed it to roam free; i.e., unbounded. There was some discussion about using it as a reversal and/or divergence indicator…but we’ll just stick to the signals we see, thank you very much.
Spaghetti
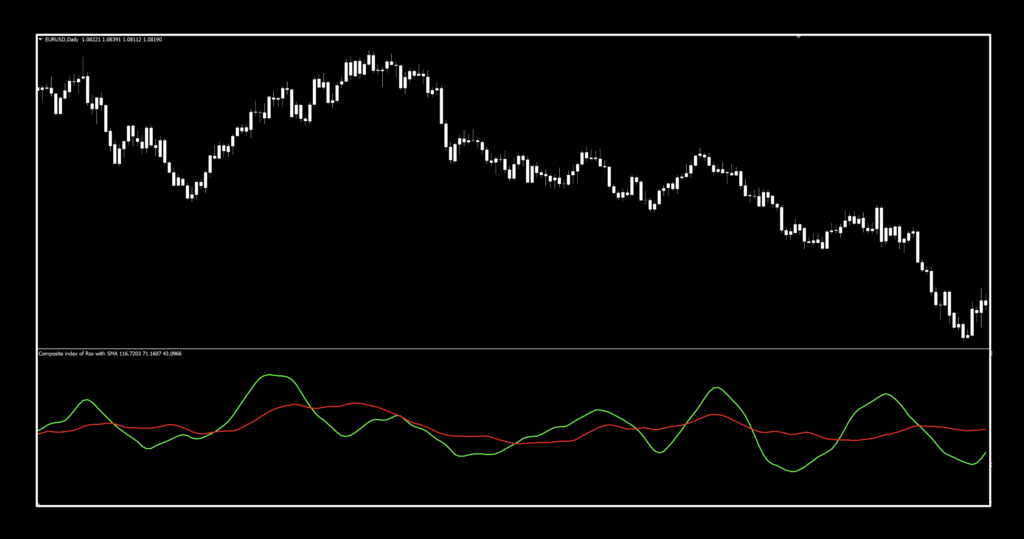
Let’s take a look at the default chart, then break down the components and see how we’re going to use it a bit differently. We did, however, thicken up the lines for better visibility and of course, the candles are blasé white, per our usual focus effect.
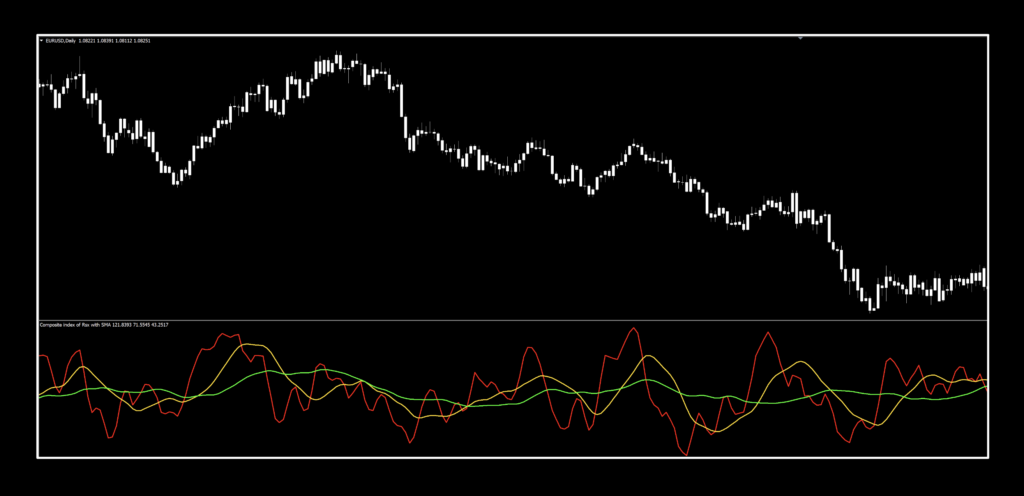
There are three lines for consideration. We’re only going to use two of them.
The first is the Composite Line, which is calculated by applying the following:
Mom Chg = 9-period ROC of 14-period RSI
RSI Mom = 3-period SMA of 3-period RSI
Composite Line = RSI Chg + RSI and is the RED LINE.
The second is the Fast SMA Line, which is a 13(SMA) of Composite Index Line, and is the GOLD LINE.
The third is the Slow SMA Line = 33(SMA) of Composite Index Line, which is the GREEN LINE.
Forget About Me
For our purposes, we’re going to remove the Composite Line by changing the color to “none” and only focus on the two composite moving average lines. We’re also going to change the colors to make it a bit easier to see where the signals are…like this where the fast MA line is green, and the slow MA is red.
Settings
Once you’ve made your color changes, you’ll have a somewhat extensive settings menu to contend with. In fact, I believe this one has the most settings of a profiled indicator. There is a tremendous degree of control which will give you plenty to work with.
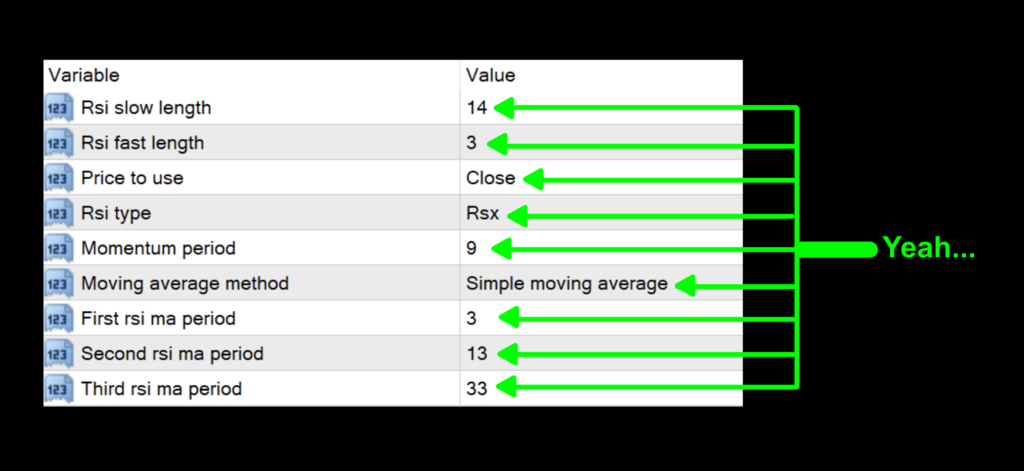
Rsi slow length: The number of periods to use for the first RSI.
Rsi fast length: The number of periods to use for the calculation of the second RSI.
Price to use: Price data set. There are 33 of them. The default is Close.
Rsi type: This setting permits you to apply the formula to different kinds of RSI calculations. The default is RSX.
Momentum period: The number of periods to use for the momentum calculation.
Moving average method: The type of moving average applied to the calculations. There are nine of them, and the default is the SMA.
First rsi ma period: This period applies to the Composite Line. The default value is 3.
Second rsi ma period: This period applies to the slow moving average of the composite line. The default value is 13.
Third rsi ma period: This period applies to the fast moving average of the composite line. The default value is 33.
Advantages
* Tremendous flexibility with regard to settings.
* Trades can be based on varying signal types.
* Added momentum component for better market interpretation.
How we use it.
One of three actions need to happen in the last 30 minutes prior to the close of the trading day. They are; opening, maintaining, or closing, a position. This is when you make your trading decisions, and not actually wait for the close at 1700 EST, because we trade on the daily time frame.
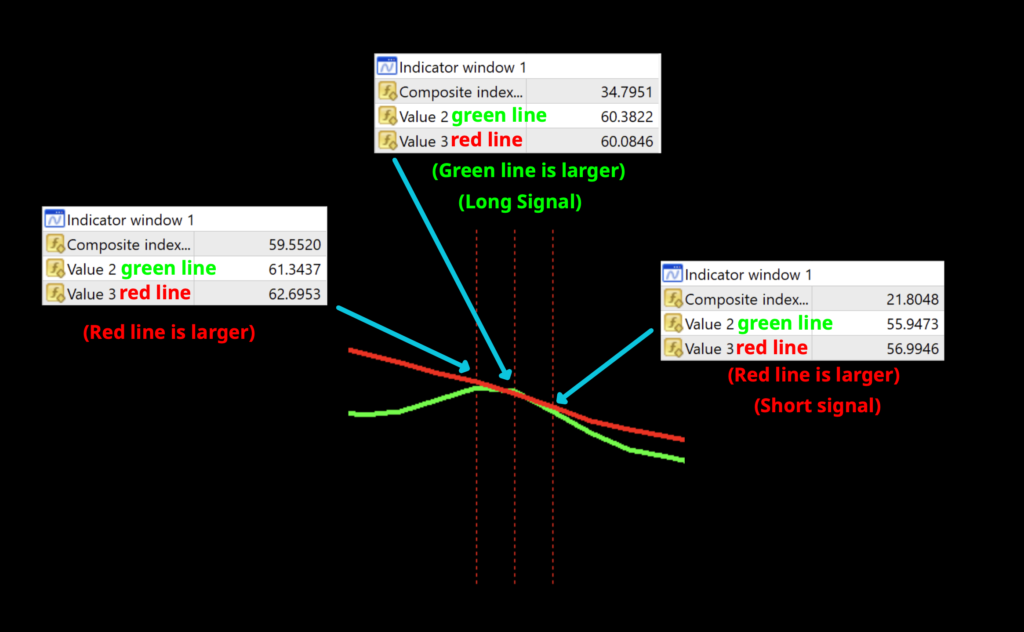
Long: When the green signal line crosses above the red signal line. Entry is in the last 30 minutes of the trading day.
Short: When the red signal line crosses above the green signal line. Entry is in the last 30 minutes of the trading day.
Just Two Noodles
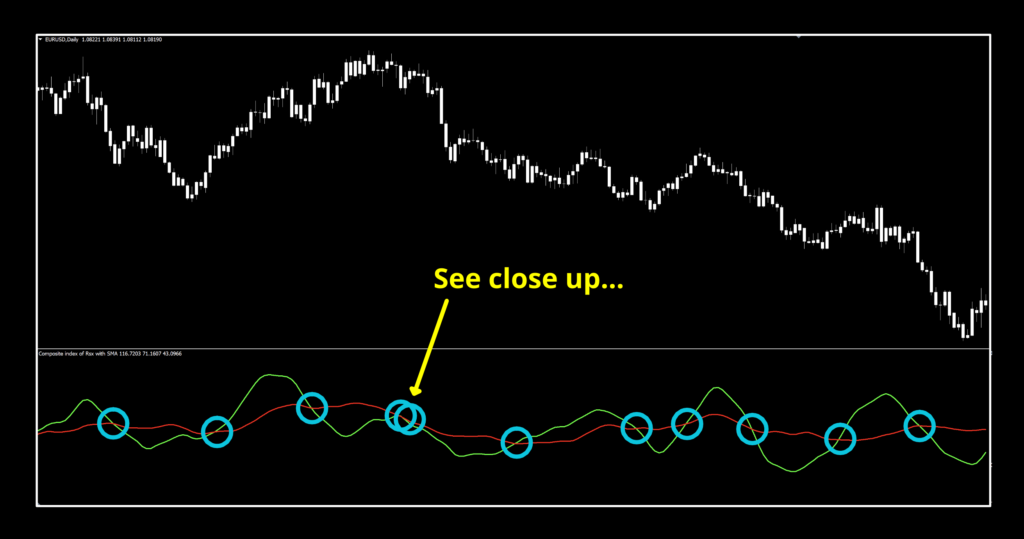
The Close Up
There is one area where the signals are a little difficult to see visually. This is where using the data window function can help you ensure that you’re reading the signals correctly. To pull up the data window, either click “Ctrl + D” or click on this icon:
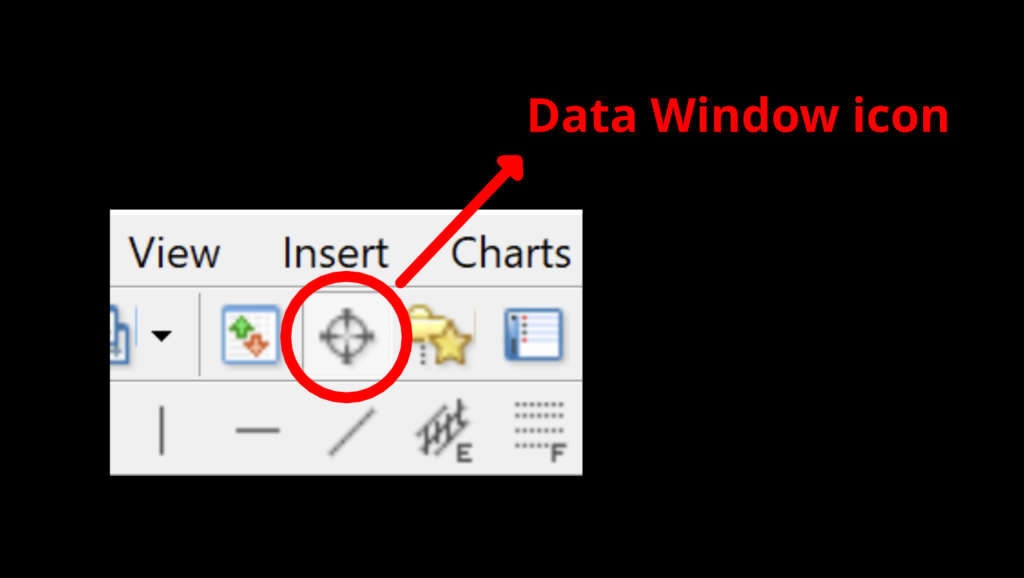
Now that you know where to find this little guy, let’s see what’s actually going on in that area of congestion.
So now we have all the signals identified on the default settings on a random chart. From what we can see, there were some definite winners and a couple of losers, so going forward with the degree of flexibility, finding that right combination might actually be easier.
Whole Lotta Rose
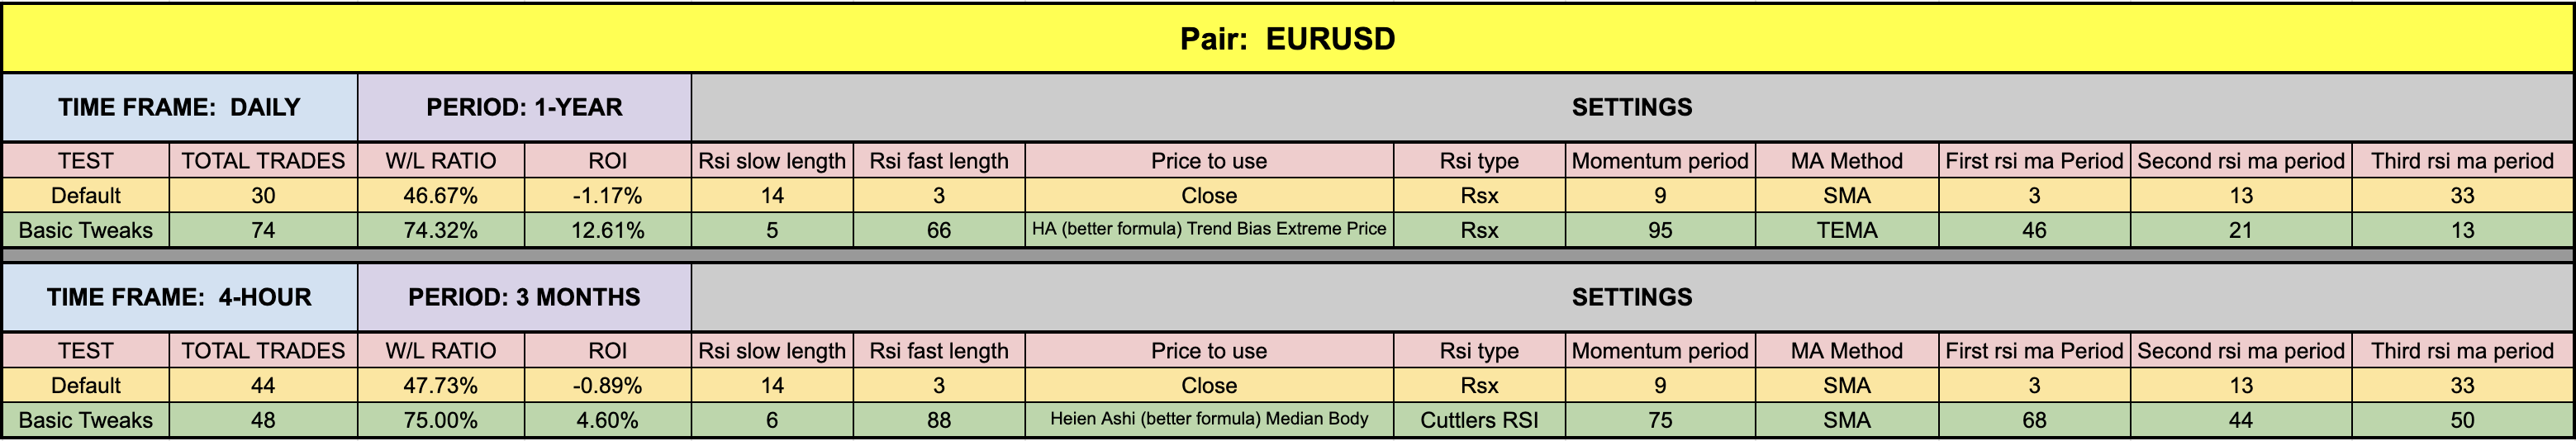
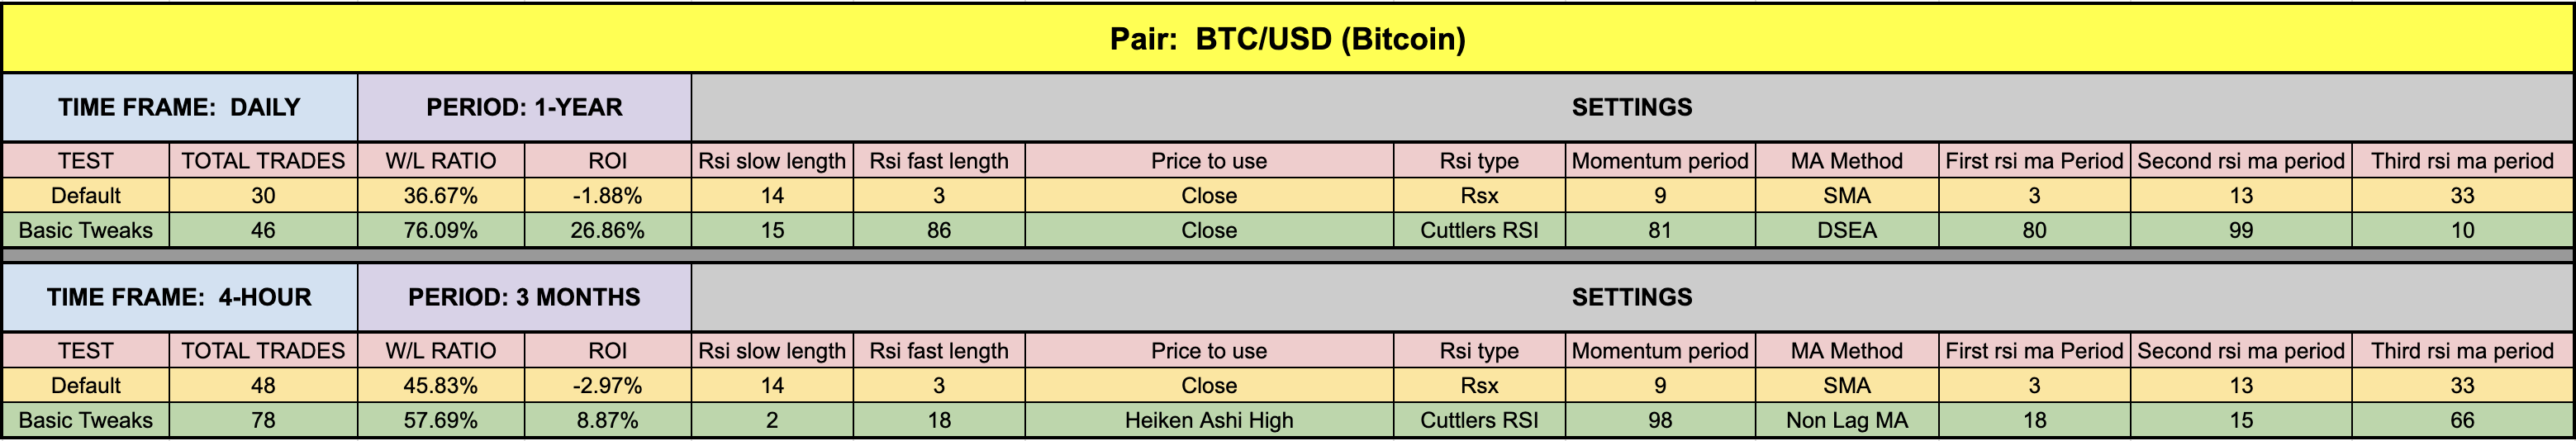
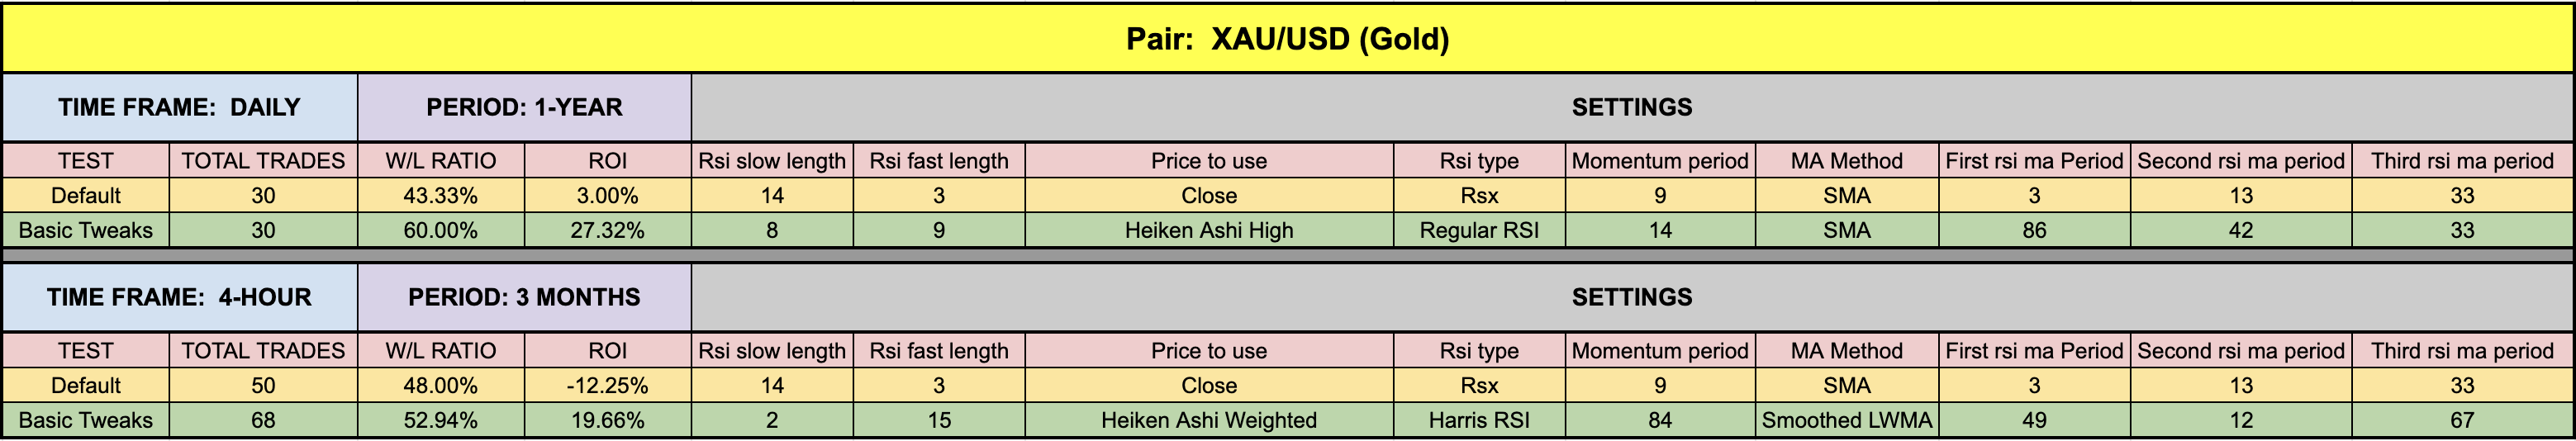
If you’re new to these studies, we recommend looking at some older blogs to understand how we conduct our testing. Below is the data from our testing.
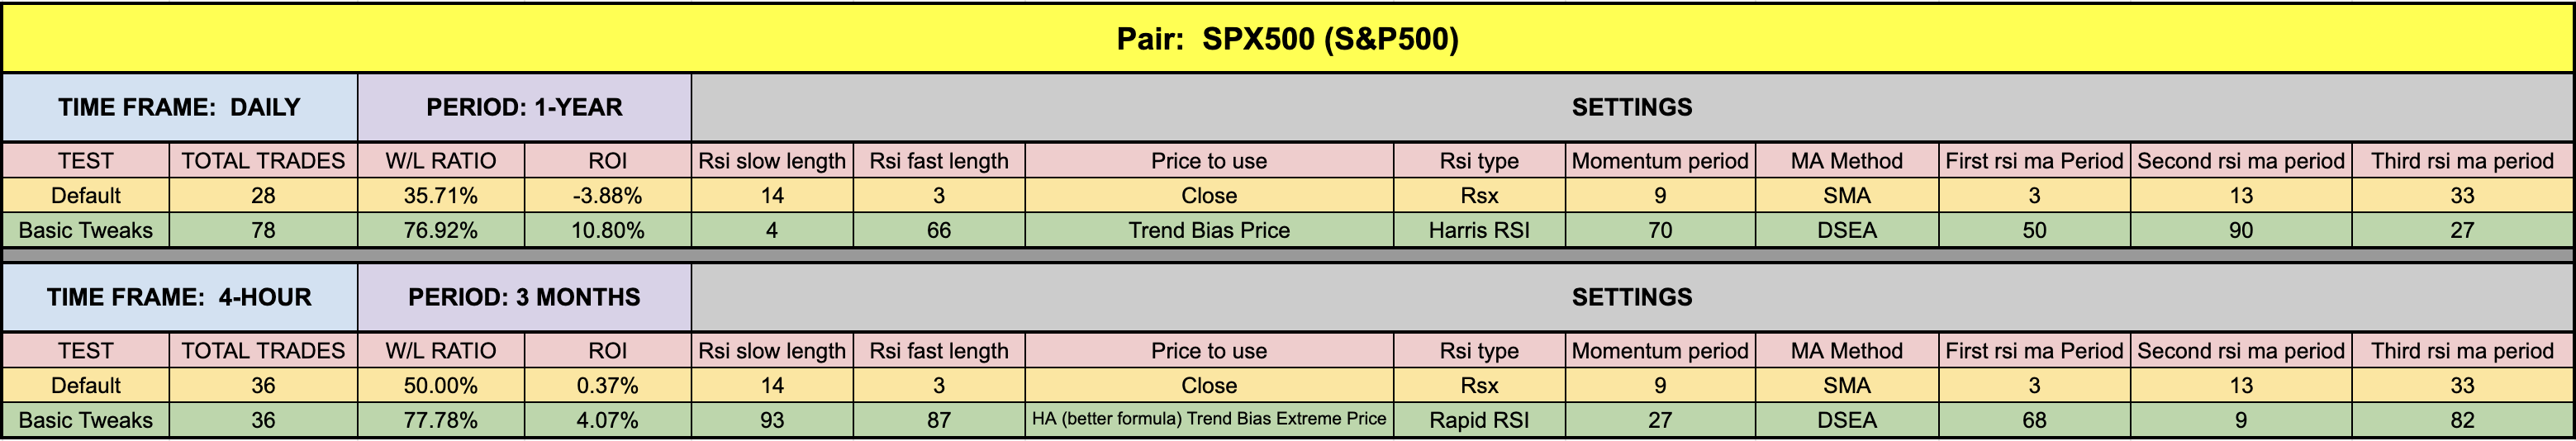
Alright, Alright, Alright…
Amongst all the settings, we’ll focus more on the left side to see what we’ve got. Default values except for 4-hour XAU were positive or pretty close to zero, which is a great place to begin. We found that not every setting needed to be changed to create better signals, but since we had the time, motivation, and coffee, we looked at all of them. From our musings, we were able to get decent numbers for the daily EUR; a nice change. BTC and XAU performed quite well, as they should, given their past movements. In last place is the SPX500, but 10.8% isn’t bad. Remember, we don’t post the worst, the best or even the most recent because we’re just demonstrating that these indicators can be made better. It’s up to you to put in the work and pioneer your own path to success. You CAN do this.
Resources
The indicator is in the library for free. When you’re ready to get it, click HERE. Be sure to subscribe to the Stonehill Forex YouTube channel for the technical analysis videos. Sign up for the Advanced NNFX Course HERE.
Our only goal is to make you a better trader.
*Our published testing results are based on money management strategies employed by the
NNFX system and depend on varying external factors, which may be different between individuals
and their specific broker conditions. No guarantee, trading recommendations, or other market
suggestions are implied. Your results and subsequent trading activities are solely your own responsibility.
BTW — Any information communicated by Stonehill Forex Limited is solely for educational purposes. The information contained within the courses and on the website neither constitutes investment advice nor a general recommendation on investments. It is not intended to be and should not be interpreted as investment advice or a general recommendation on investment. Any person who places trades, orders or makes other types of trades and investments etc. is responsible for their own investment decisions and does so at their own risk. It is recommended that any person taking investment decisions consults with an independent financial advisor. Stonehill Forex Limited training courses and blogs are for educational purposes only, not a financial advisory service, and does not give financial advice or make general recommendations on investment.