
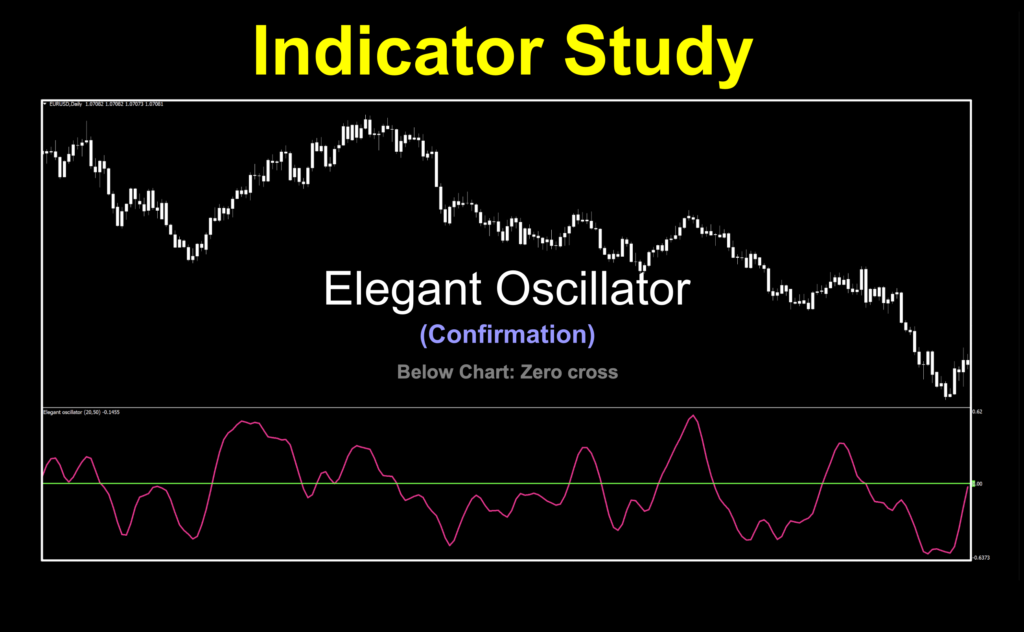
Elegant Oscillator
Reincarnation
Have you ever had that weird feeling that you’ve seen something before but can’t place your finger on it? It happens in trading as well. With over 10,000 indicators available in the MT4 universe, similarities are bound to happen. We’ve got something this week which smacks of something, but different. It was suggested by the developer of the NNFX algo tester — so thank you for that! Intrigued? We were. Follow along with us to uncover a tasty treat from someone we know and love.
Old is New
The Elegant Oscillator from John Ehlers is actually based off of older works; however, this current incarnation is from 2022. The man was a prolific thinker and developer of trading concepts, so naturally, we’re going to be investigating a few of his works as they come across our collective desks. Let’s dig in. Some of you may recognize a few names, but if not, that’s fine. We’re working on the here and now. But first, dim the lights, grab a bowl of Ultimate Butter Orville Redenbacher popcorn and recline your chair for this important public announcement.
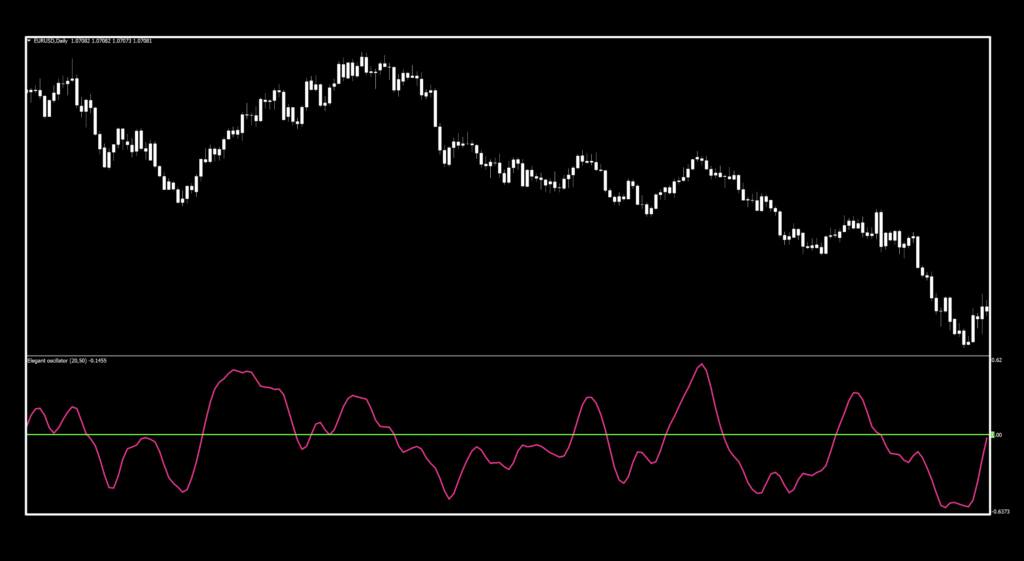
Now that the popcorn is finished, and you’ve watched the video, let’s dive into Mr. Ehler’s world of trading magic. The Elegant Oscillator is founded on the idea that price tend to return to “normal”, or average levels of its historical mean. It calculates the inverse Fisher transform of price and then applies the SuperSmoother to filter market noise and create a signal line. As a NNFX indicator, we see this strictly as a zero cross and base our long and short signals, just like in the image below.
Twists and Turns
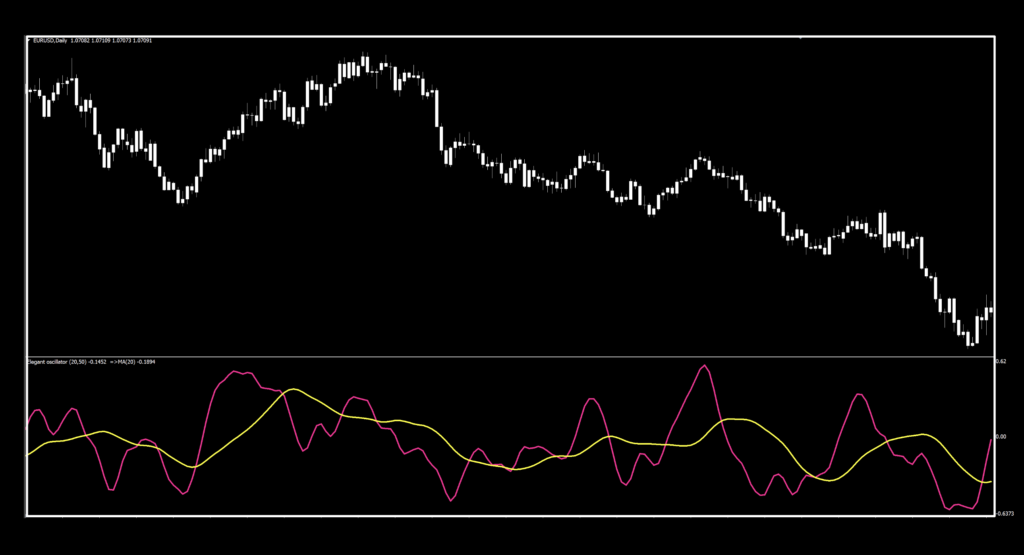
Pretty straight forward. But what if we added a feature to give us different signals? We’re going to show you a way you can use oscillating indicators a little differently by adding a moving average to create a two lines cross indicator. Coincidently, VP put out a video on this topic about four years ago, so it’s definitely something to consider. If you’re confused, have no fear. We’re going to walk you through this so you, too, can have the power.
Walk The Walk
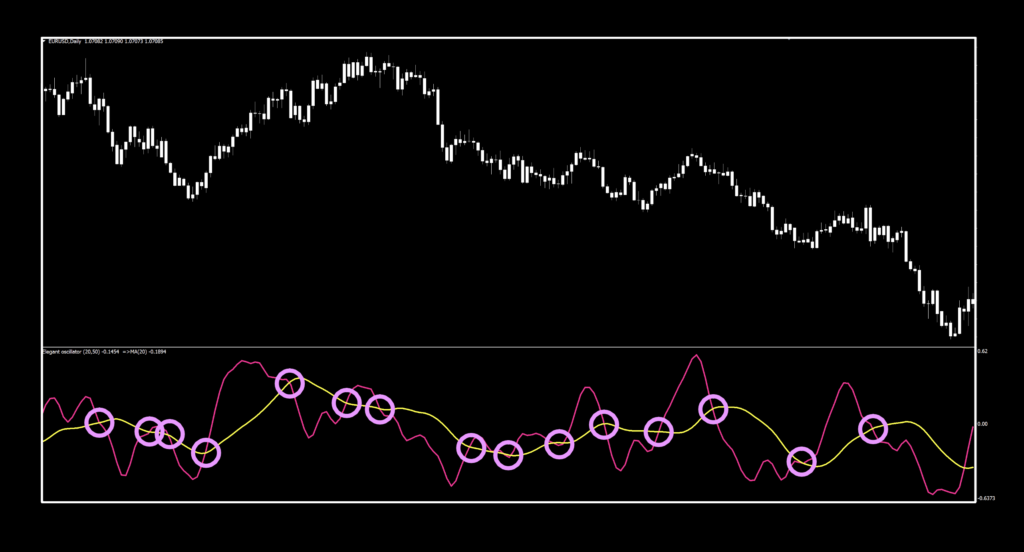
We’re going to overlay the most basic of moving averages for our first glance at this; the Simple Moving Average with a period of 20 — that’s the yellow line. Now, let’s take a look at it.
Holy Double Vision Batman
Before we go any further, we need to cover the whole layering of the two indicators to make one. Once you have your chart up with an indicator below in a separate window;
1. You’ll be adding a moving average from the “Trend” folder in the indicator.
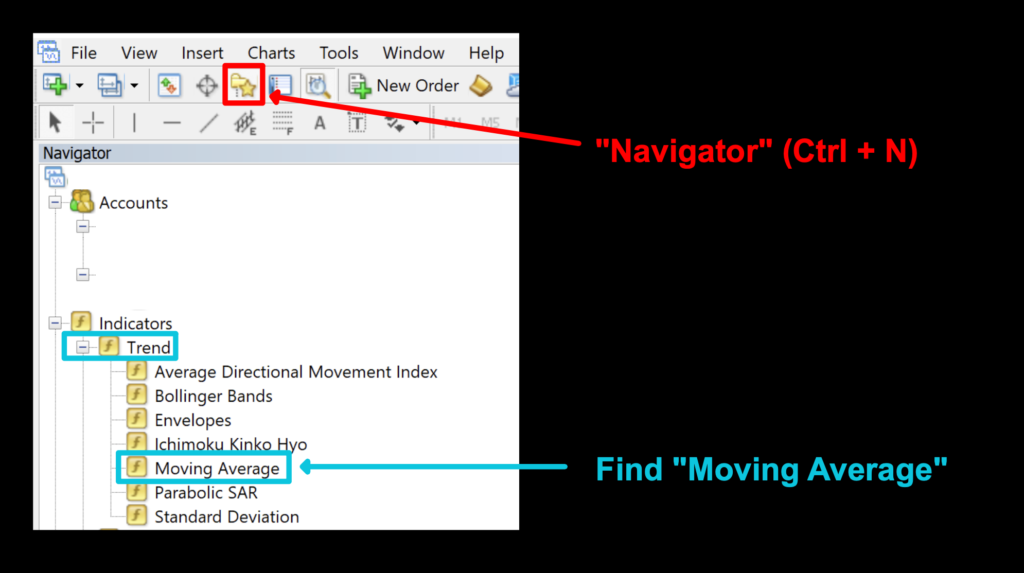
Once you “drag” Moving Average over your chart, you’ll see this menu with its choices.
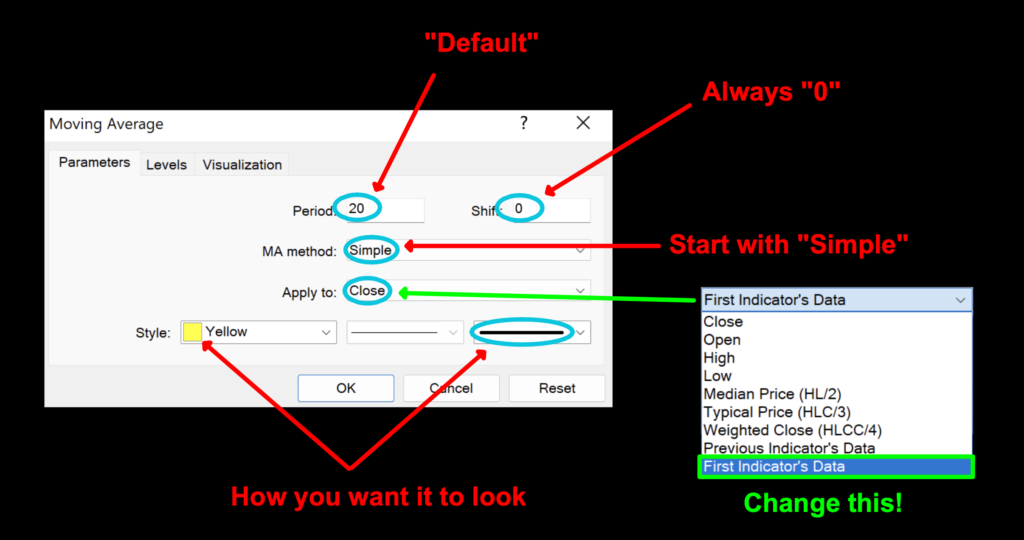
Period: Start with 20 as this is the “default” we use in our testing and on our charts for investigative studies. You can certainly do what you wish, but we’re just letting you know what we do.
Shift: Just leave this at “0”. You do not want to advance or retard the signal line. Signals will not be accurate.
MA Method: You have a choice of Simple, Exponential, Smoothed, and Linear Weighted. You can use any of these, but we’re starting with “Simple” as our initial value.
Apply to: This tells the platform to place the moving average on top of the indicator you want to “stack”.
Color/Thickness: These are your choices. We usually pick a bright color and thicken the line for better visibility.
Tickled Pink
Since we’ve already discussed the Moving Average component of the indicator, refocus our attention to the profiled portion. The default color of the signal line is pink, so easy to see. We just thickened it up a bit and away we went. Since you already know what it looks like, we’ll take a look at what makes this tick.
Settings
With three settings, you get pretty good control of the signal line.
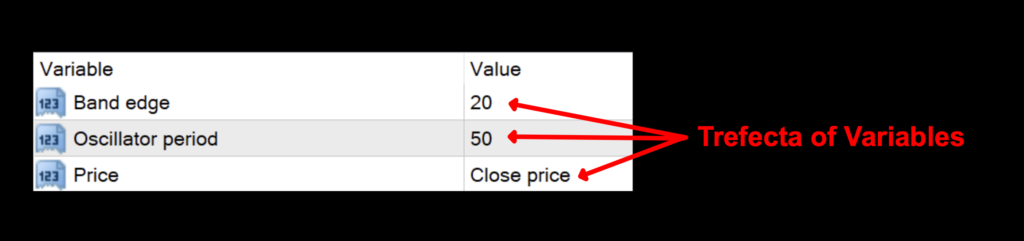
Band edge: This variable calculates the band edge of the signal line. The default value is 20.
Oscillator period: The number of periods used for the indicator calculations. The default value is 50.
Price: The price set used for calculations; Close, Open, High, Low, Median, Typical, and Weighted. The default value is Close.
Advantages
* Based on prior high level indicators.
* Presented by one of the greats, John Ehlers
* Easy to use signals.
How we use it.
One of three actions need to happen in the last 30 minutes prior to the close of the trading day. They are; opening, maintaining, or closing, a position. This is when you make your trading decisions, and not actually wait for the close at 1700 EST, because we trade on the daily time frame.
Since we’re going to be showcasing this indicator as a zero cross only, we’ll be addressing how to use it and the signals based on that methodology. You are enthusiastically invited to try this indicator as a two lines cross as well, to explore other opportunities.
Long: When the signal line crosses above the zero line. Entry is in the last 30 minutes of the trading day.
Short: When the signal line crosses below the zero line. Entry is in the last 30 minutes of the trading day.
Cross Roads
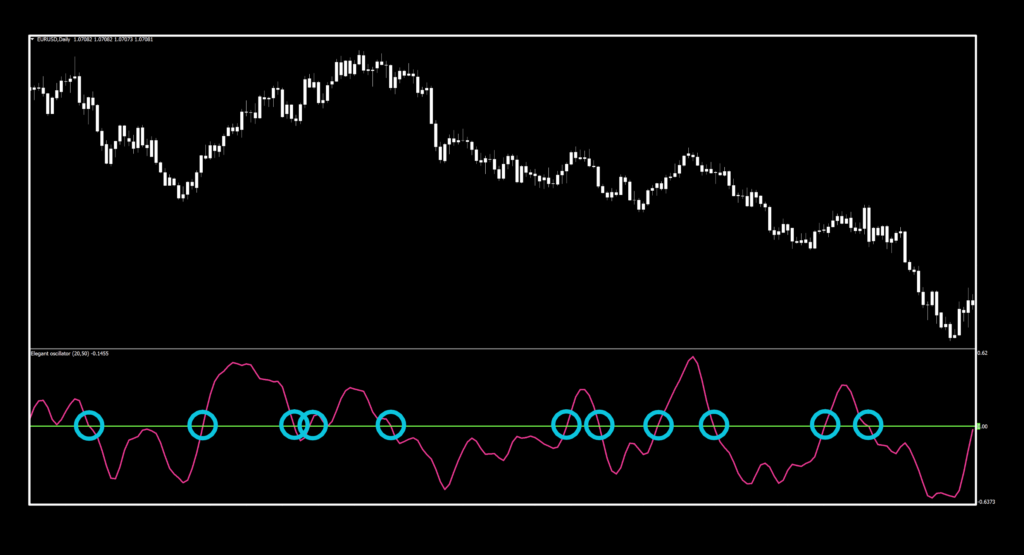
You can see that signals are pretty reactive to price action, and it does a good job keeping you in a trade until it’s time to exit. Even on default settings, we were able to pick out pretty decent trades which would have booked consistent profits.
Good to be Curious
If you’re curious what it looks like as a two lines cross, this is what you’d be looking at. Just so you know, we tested it both ways and felt that it performed better overall as a zero line cross; however, that’s just for this indicator during the time span and the pairs we tested. That certainly doesn’t mean it can’t work better for other oscillator indicators, or even this one during a different time span and on different pairs. Go try it. Go on…do the thing!
Numbers Tell a Story
If you’re new to these studies, we recommend looking at some older blogs to understand how we conduct our testing.
Stacked and Racked
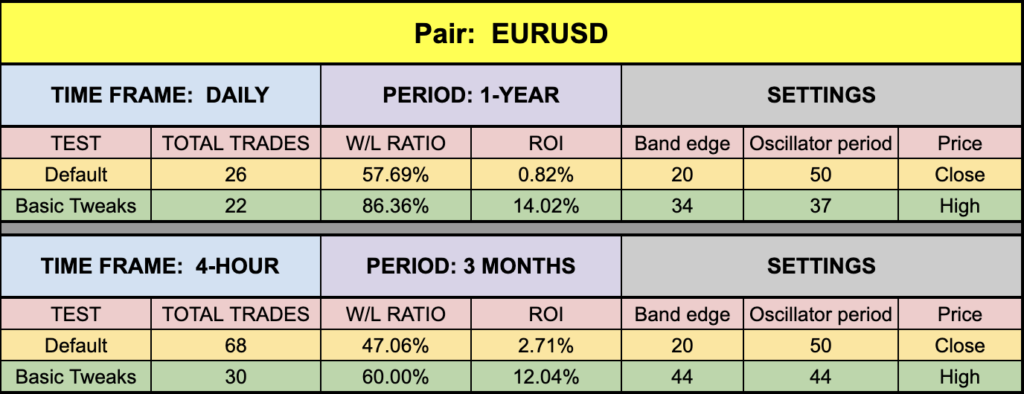
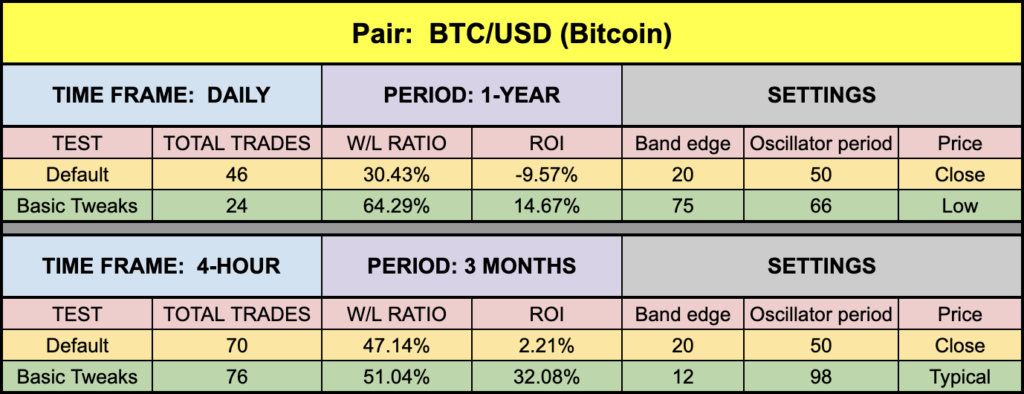
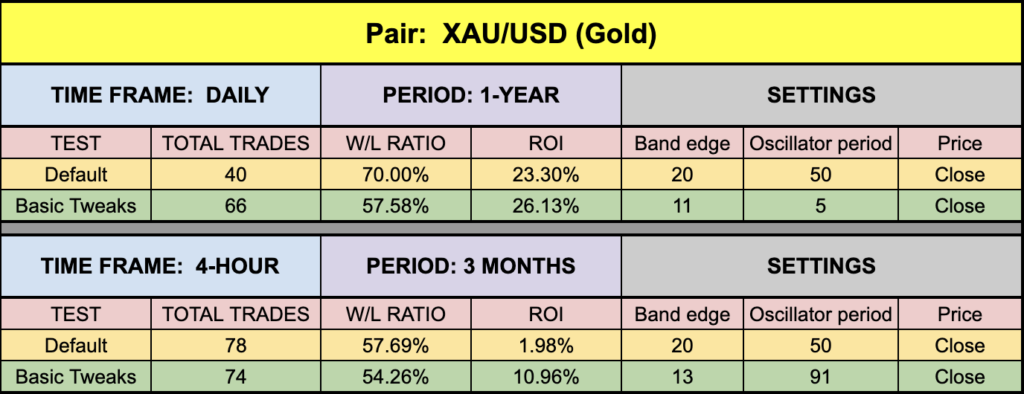
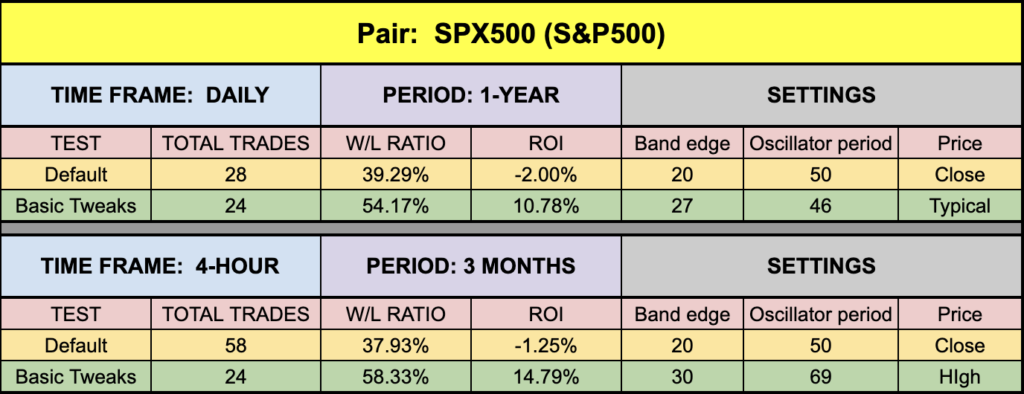
Below is the data from our testing.
Gold Award
Looking through the numbers, XAU is the clear winner. Overall, the default numbers weren’t that bad, considering that five out of eight were above zero and two of the three in the minus region were not really that far from break even. That’s a great way to start when it comes to tweaking an indicator. Remember, we don’t pick the best settings because that wouldn’t be helpful…and they change over time. Now go forth, and multiply those pips!
Resources
You can find this indicator in the library for free. When you’re ready to get it, click HERE. Be sure to subscribe to the Stonehill Forex YouTube channel for the technical analysis videos. For the advanced course, click HERE.
Our published testing results are based on money management strategies employed by the
NNFX system and depend on varying external factors, which may be different between individuals
and their specific broker conditions. No guarantee, trading recommendations, or other
market suggestions are implied. Your results and subsequent trading activities are solely your
own responsibility.
Our only goal is to make you a better trader.
BTW — Any information communicated by Stonehill Forex Limited is solely for educational purposes. The information contained within the courses and on the website neither constitutes investment advice nor a general recommendation on investments. It is not intended to be and should not be interpreted as investment advice or a general recommendation on investment. Any person who places trades, orders or makes other types of trades and investments etc. is responsible for their own investment decisions and does so at their own risk. It is recommended that any person taking investment decisions consults with an independent financial advisor. Stonehill Forex Limited training courses and blogs are for educational purposes only, not a financial advisory service, and does not give financial advice or make general recommendations on investment.